
1:1
Lisa Jevbratt
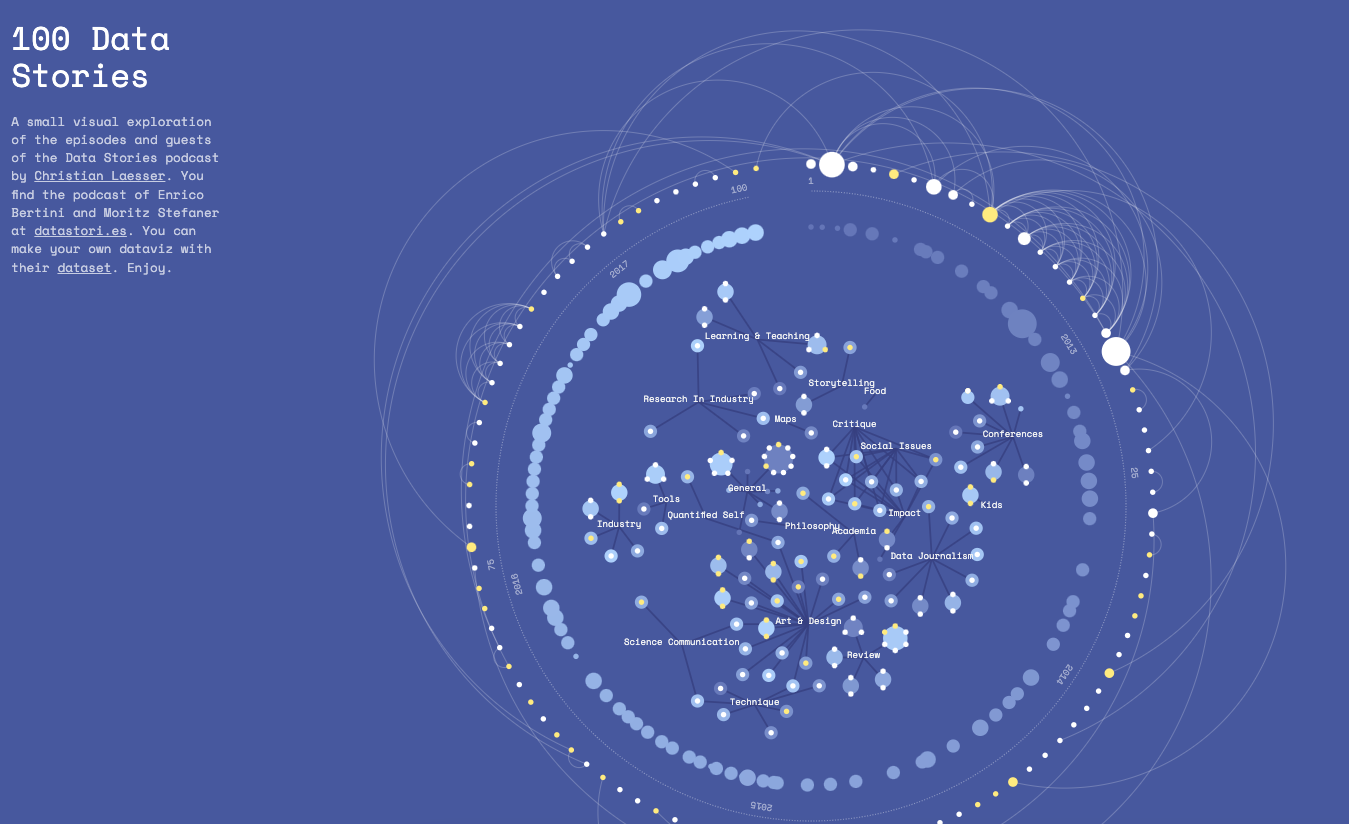
100 Data Stories
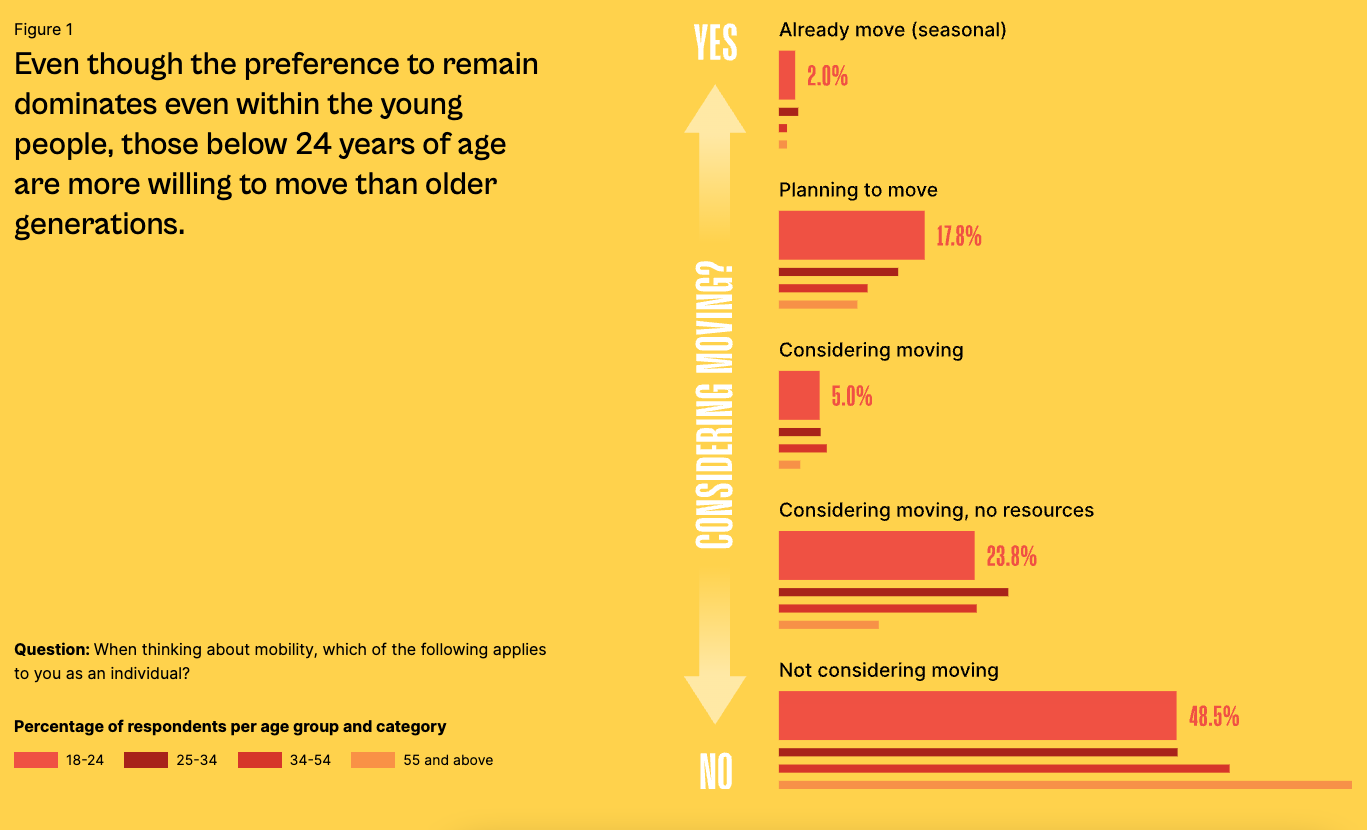
Christian Laesser
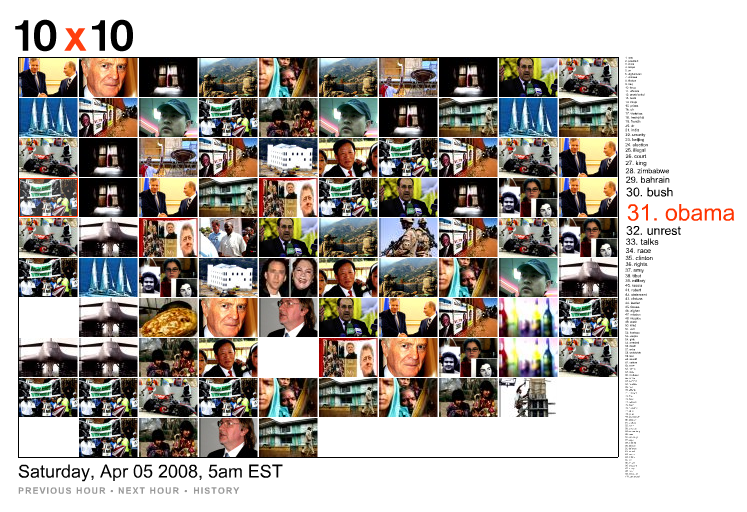
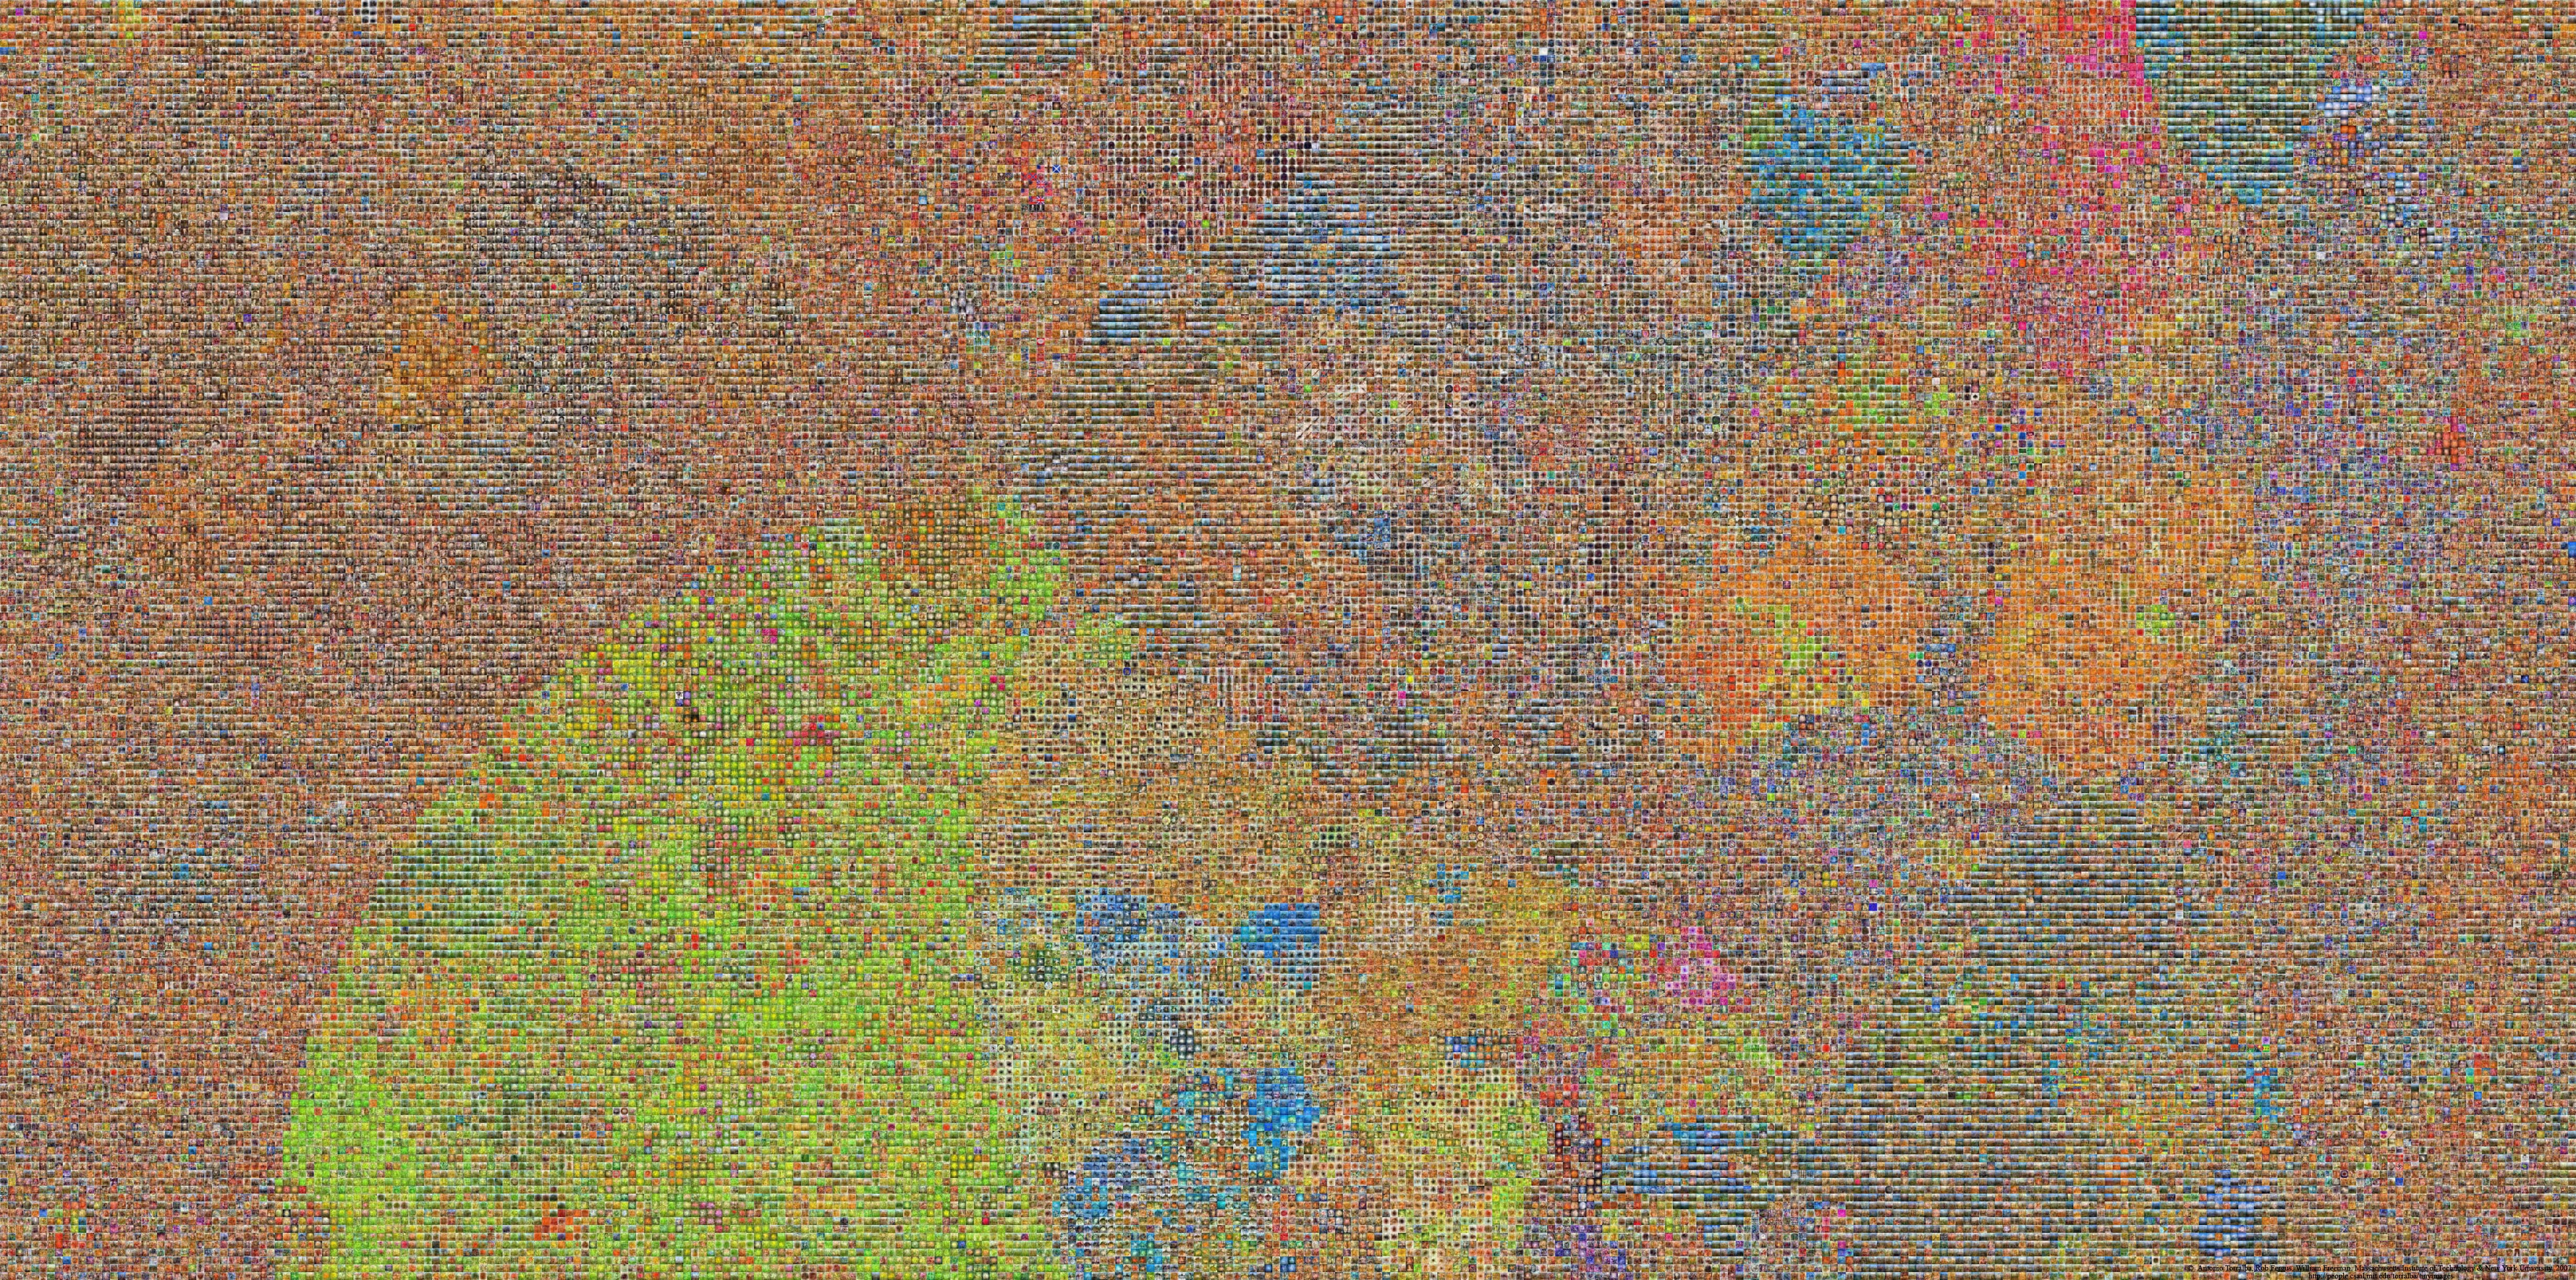
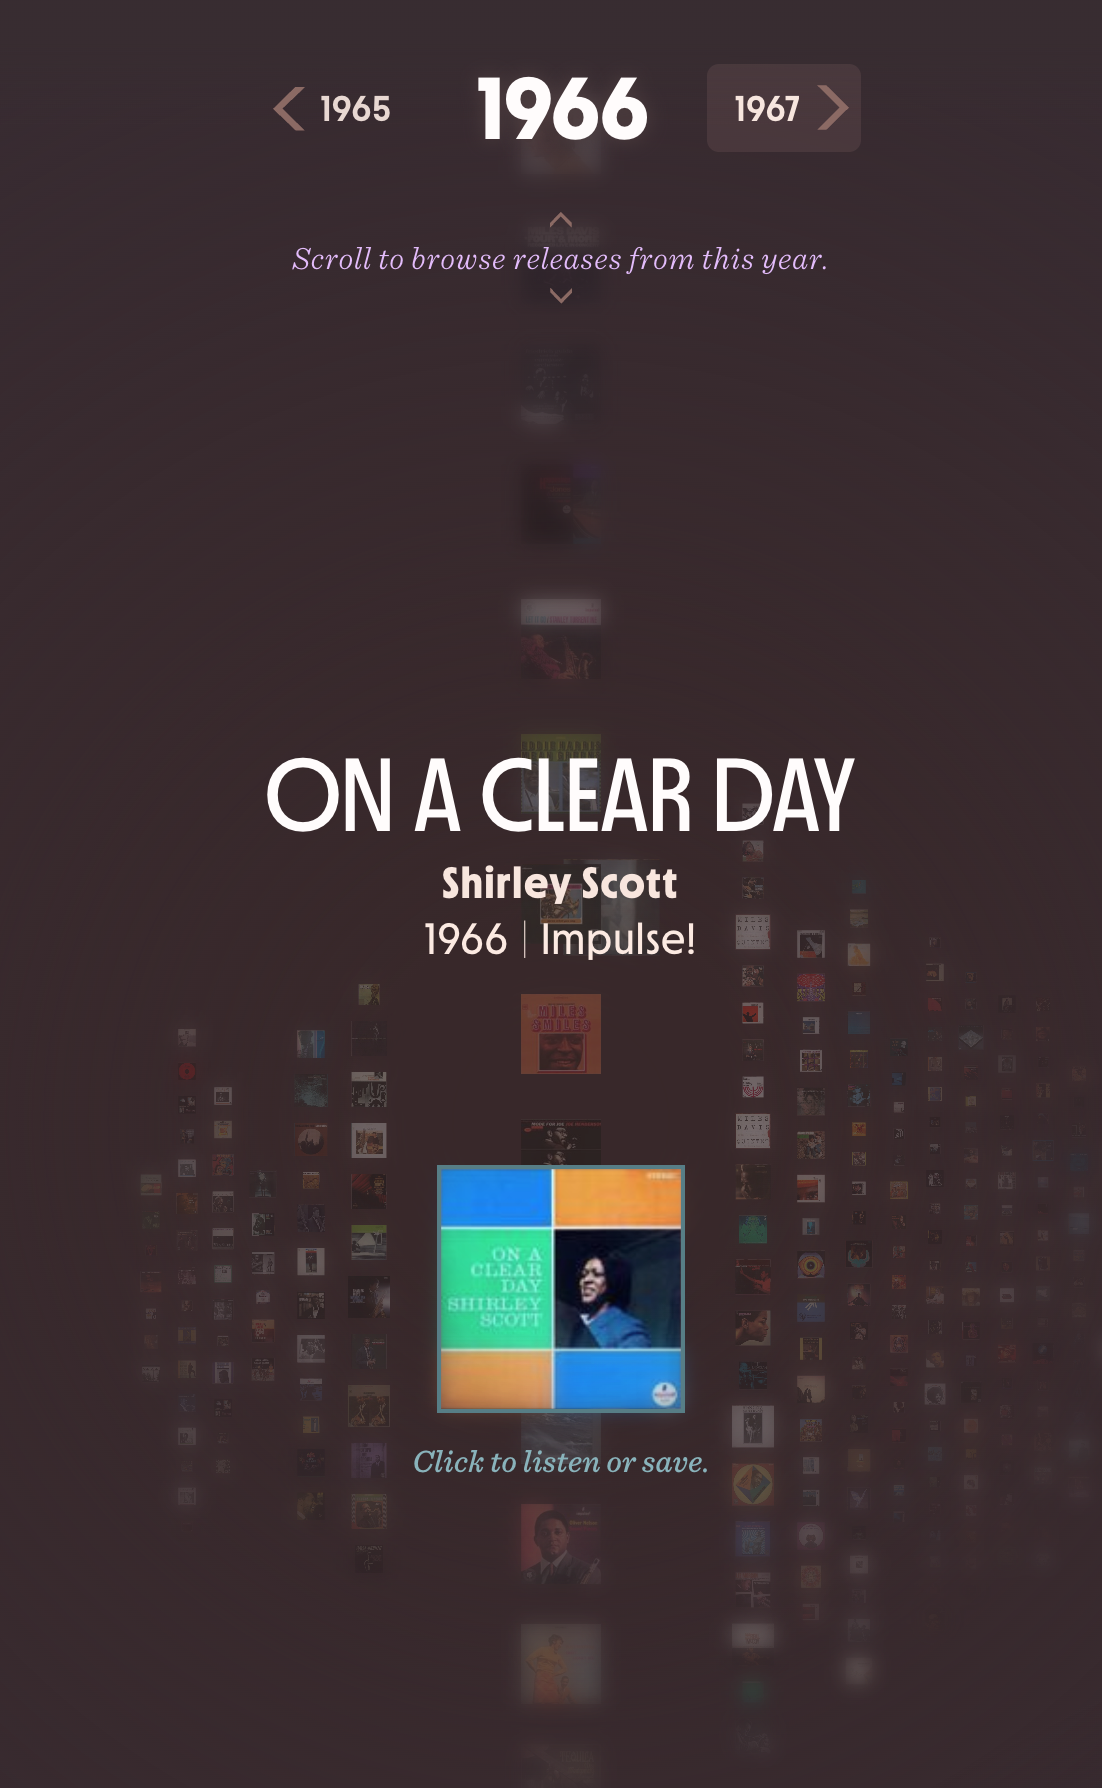
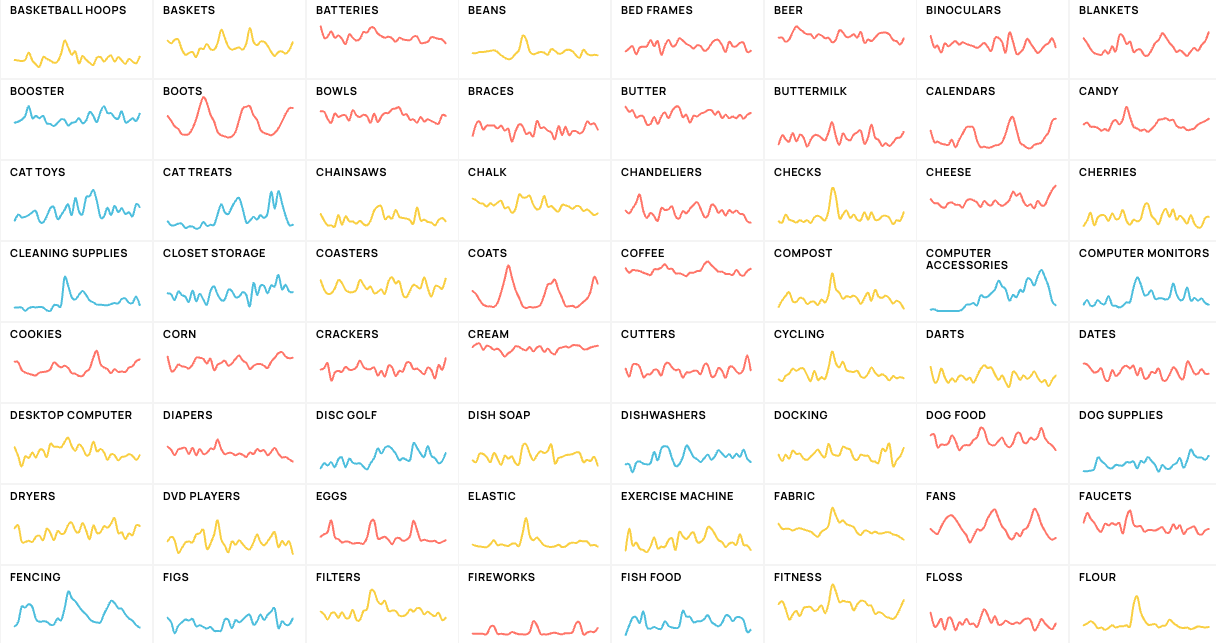
10x10
Jonathan Harris
2022 Global Report on Public Financial Management
PEFA (World Bank)
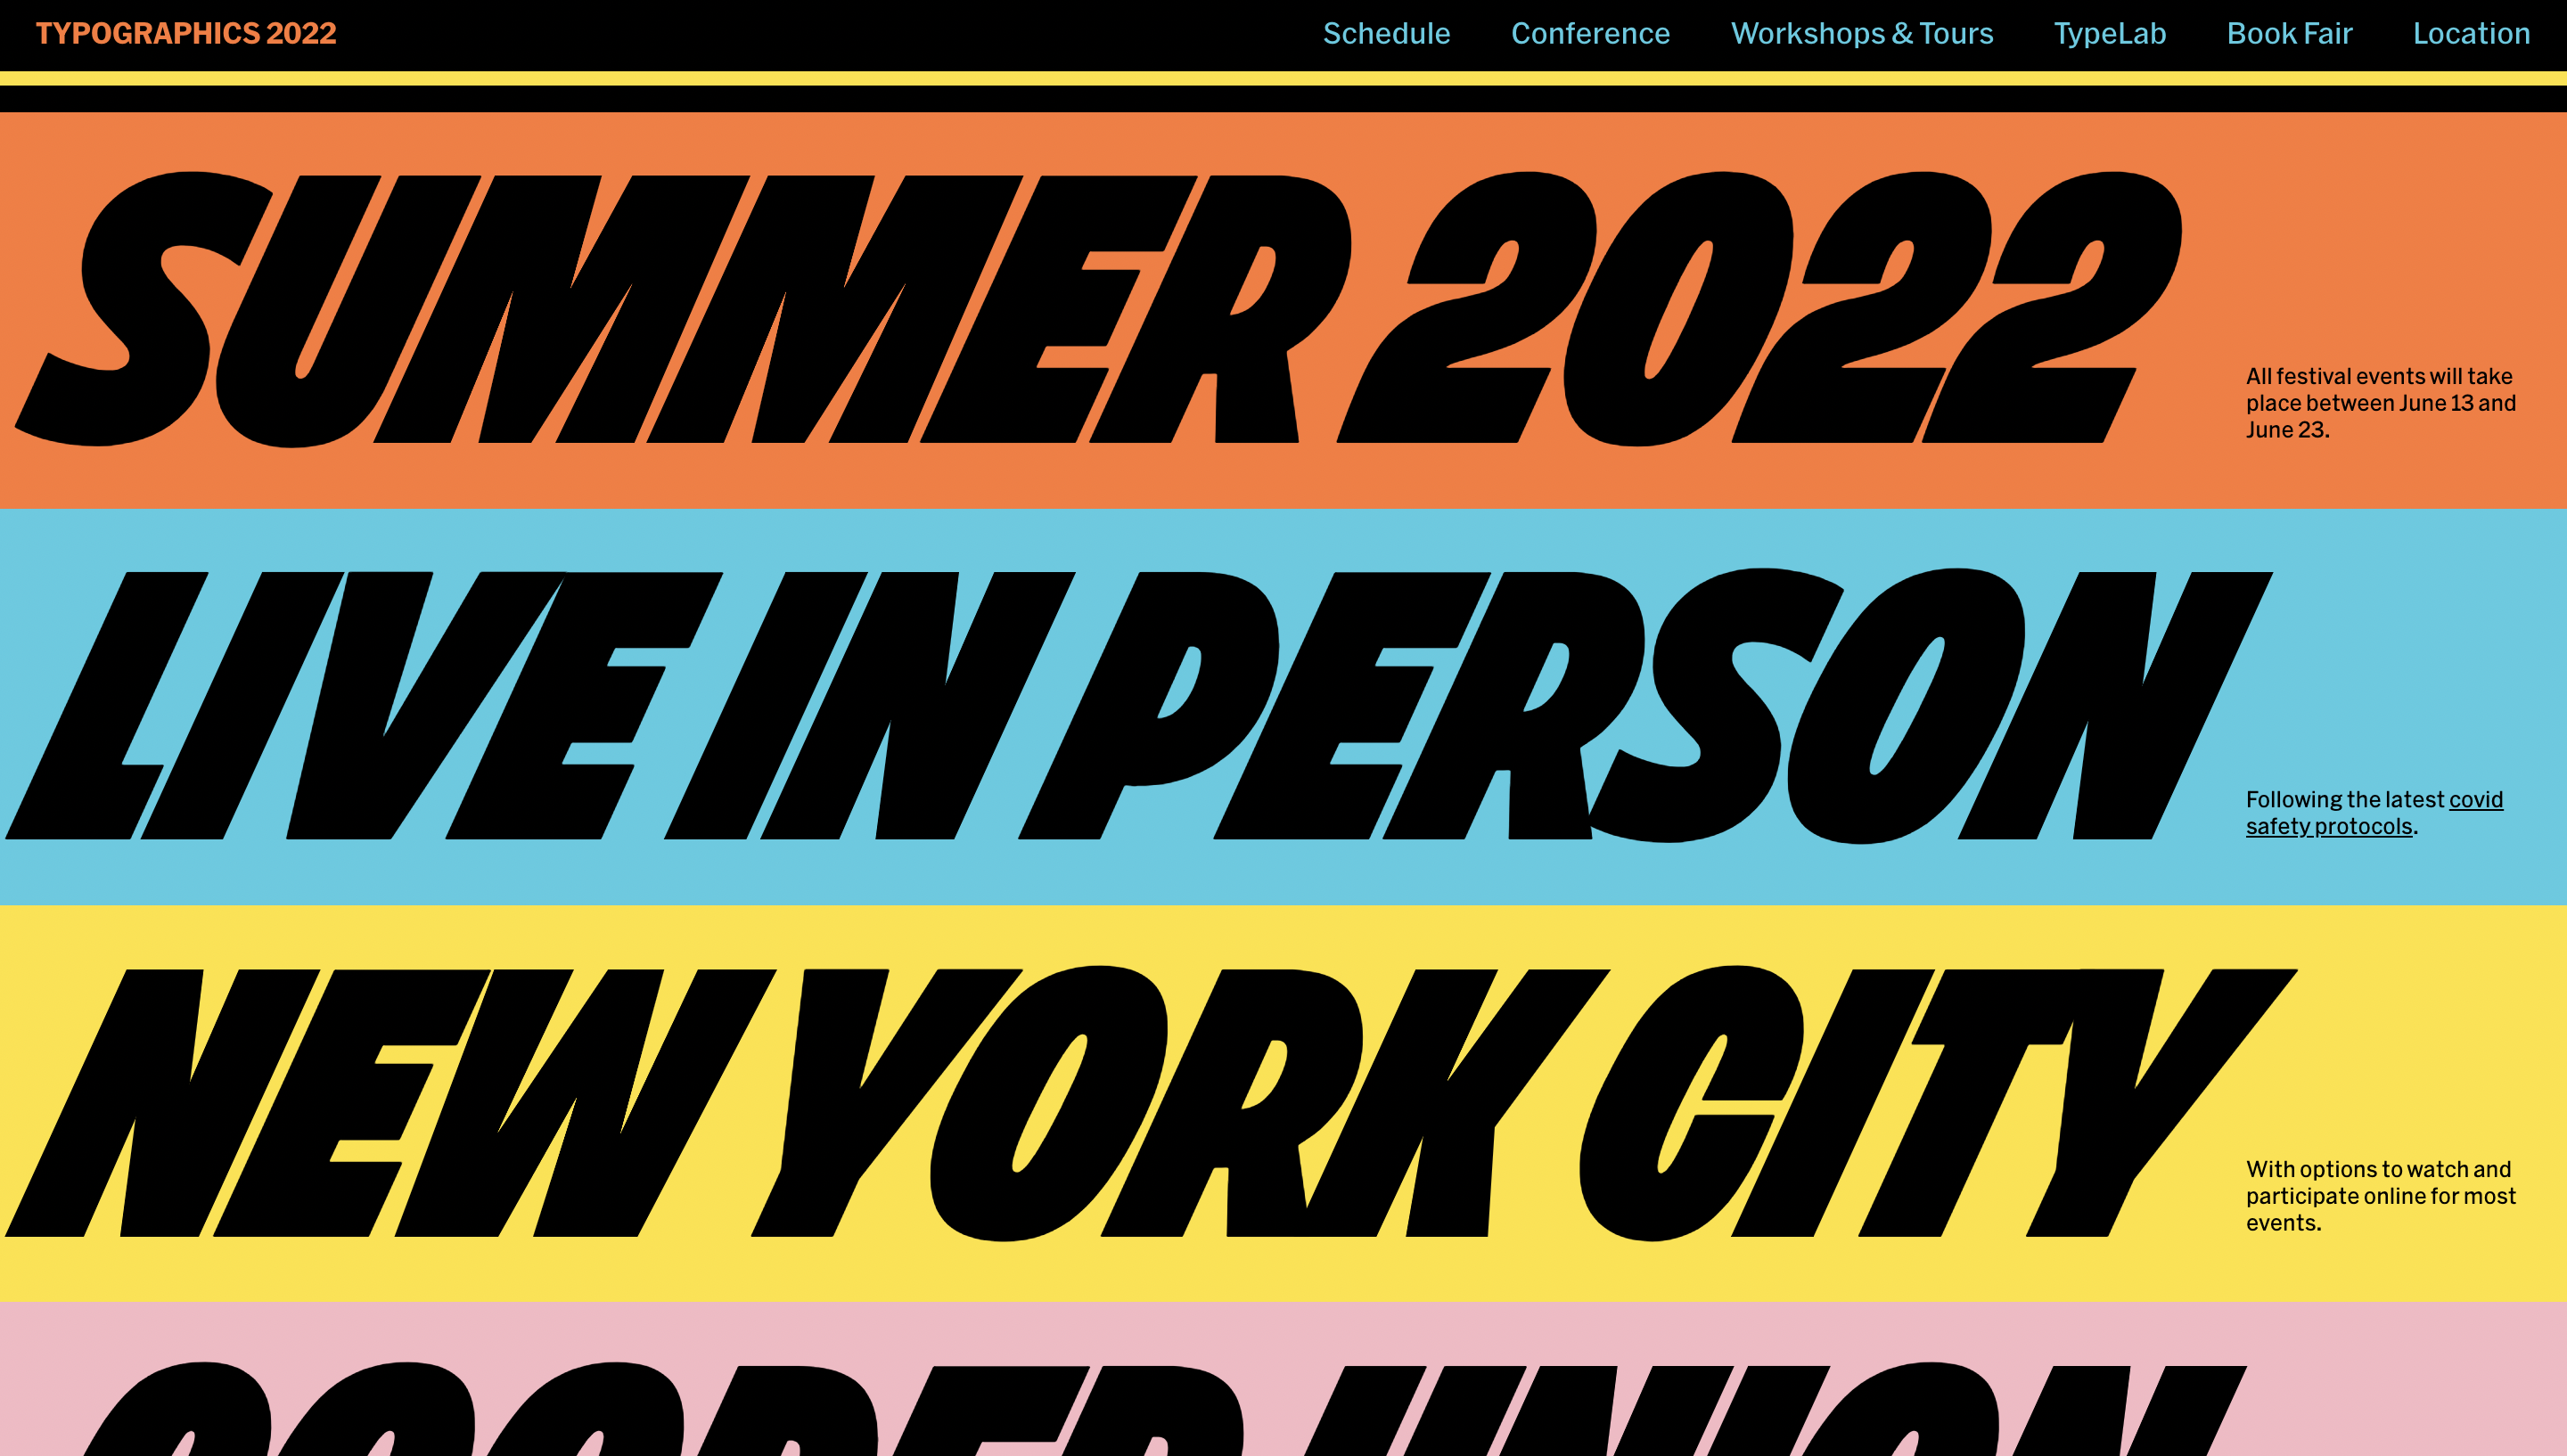
2022 Typographics
2023 Freedom and Prosperity Indexes
Schema Design

30 Years of Ukraine Independence
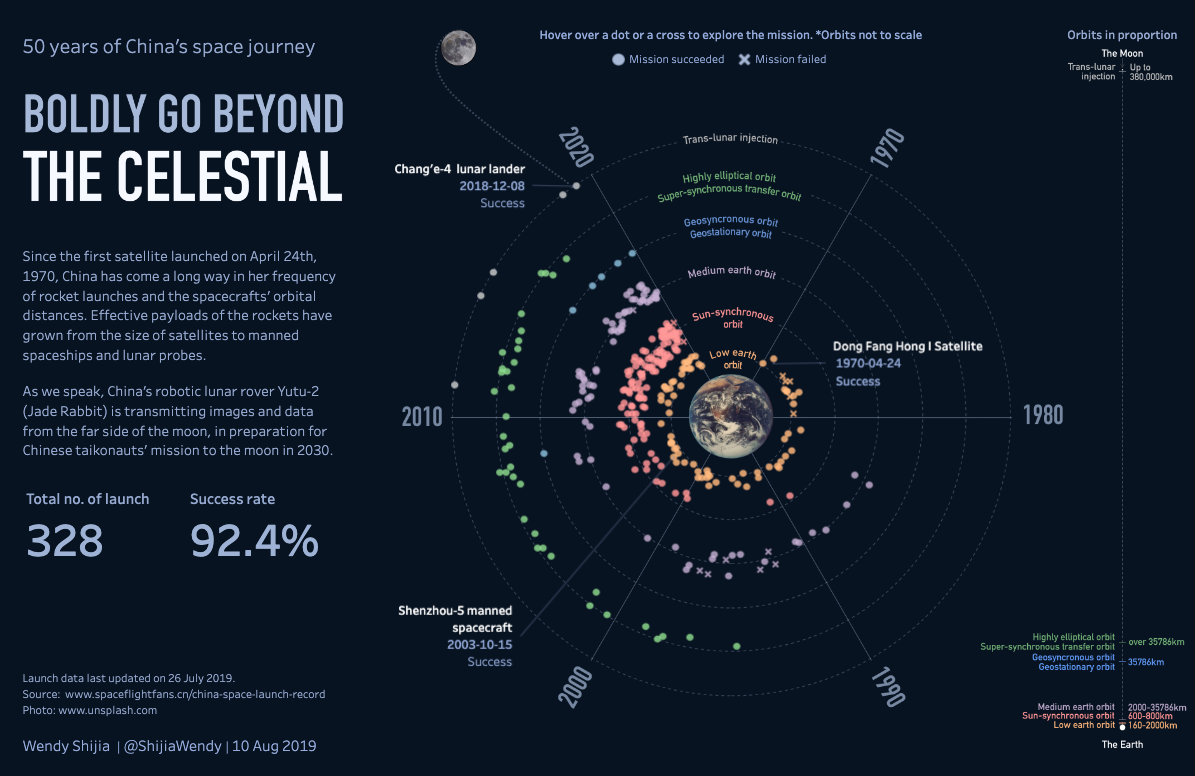
50 Years of China's Space Journey
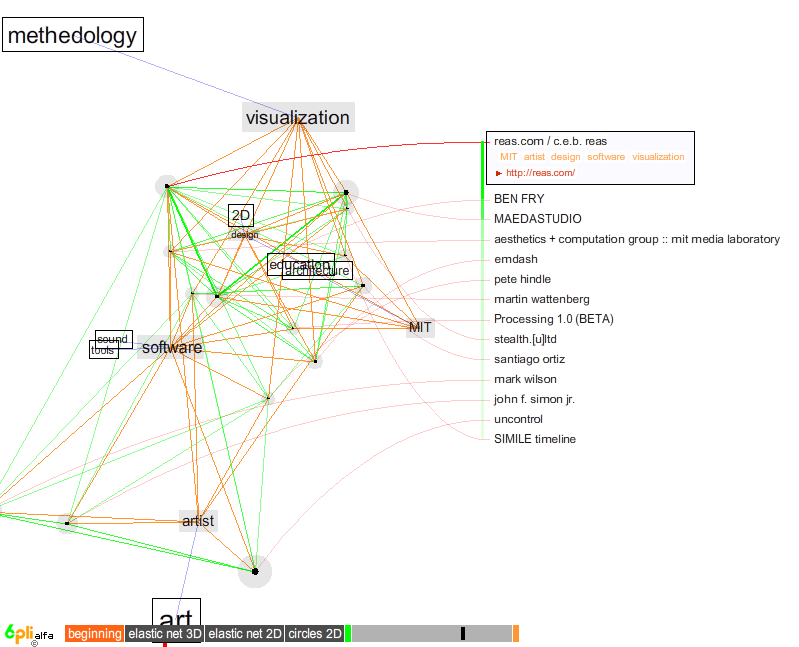
6pli Social Network
Unknown
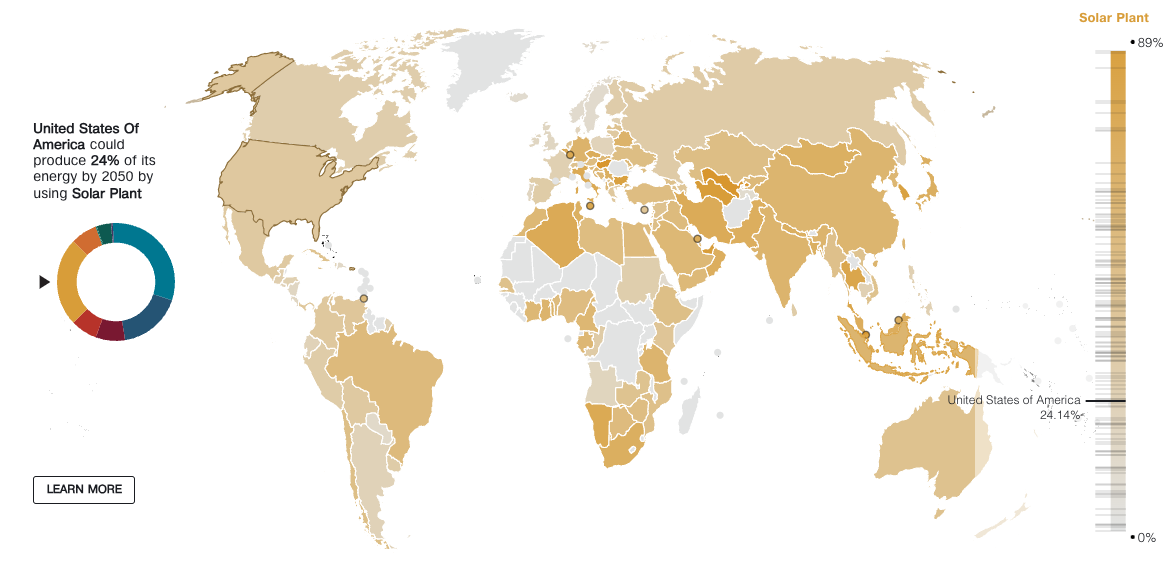
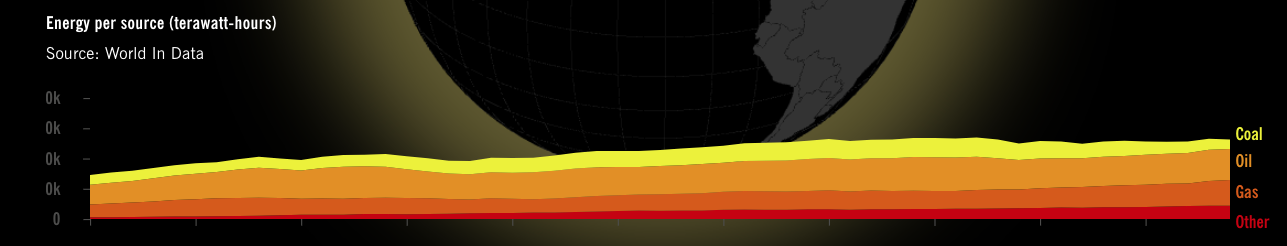
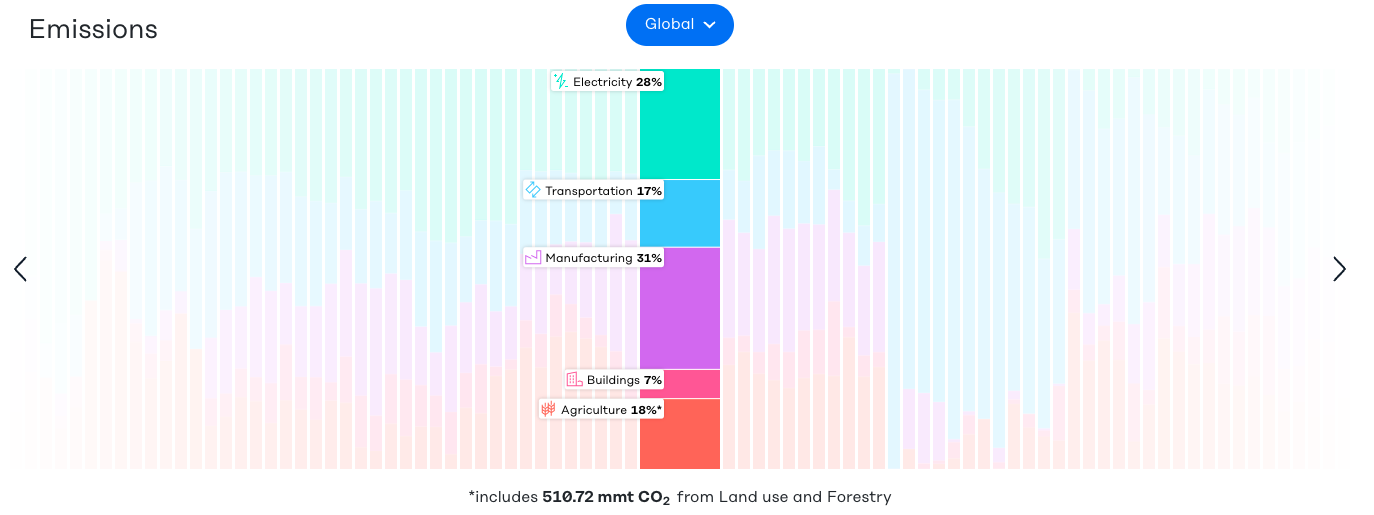
A Blueprint for a Carbon Free World
A Close Look at the Chaotic House Republican Majority
The New York Times
A Day in the Life of Americans
Flowing Data
A Day in the Life: Work and Home
Flowing Data
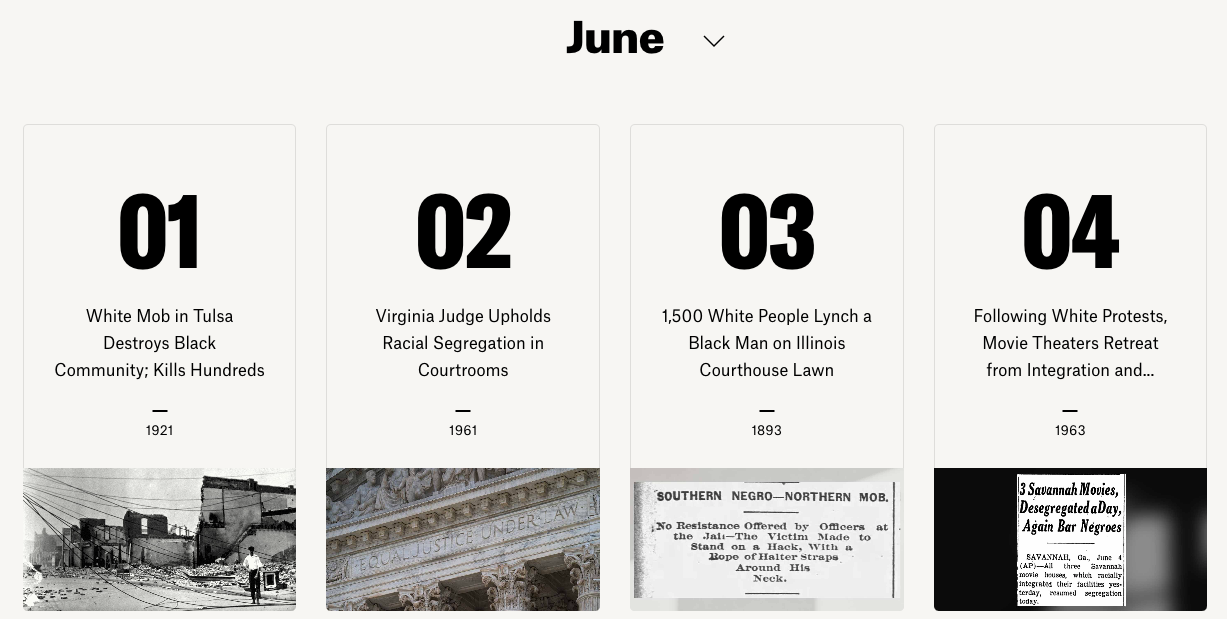
A History of Racial Injustice
Equal Justice Initiative
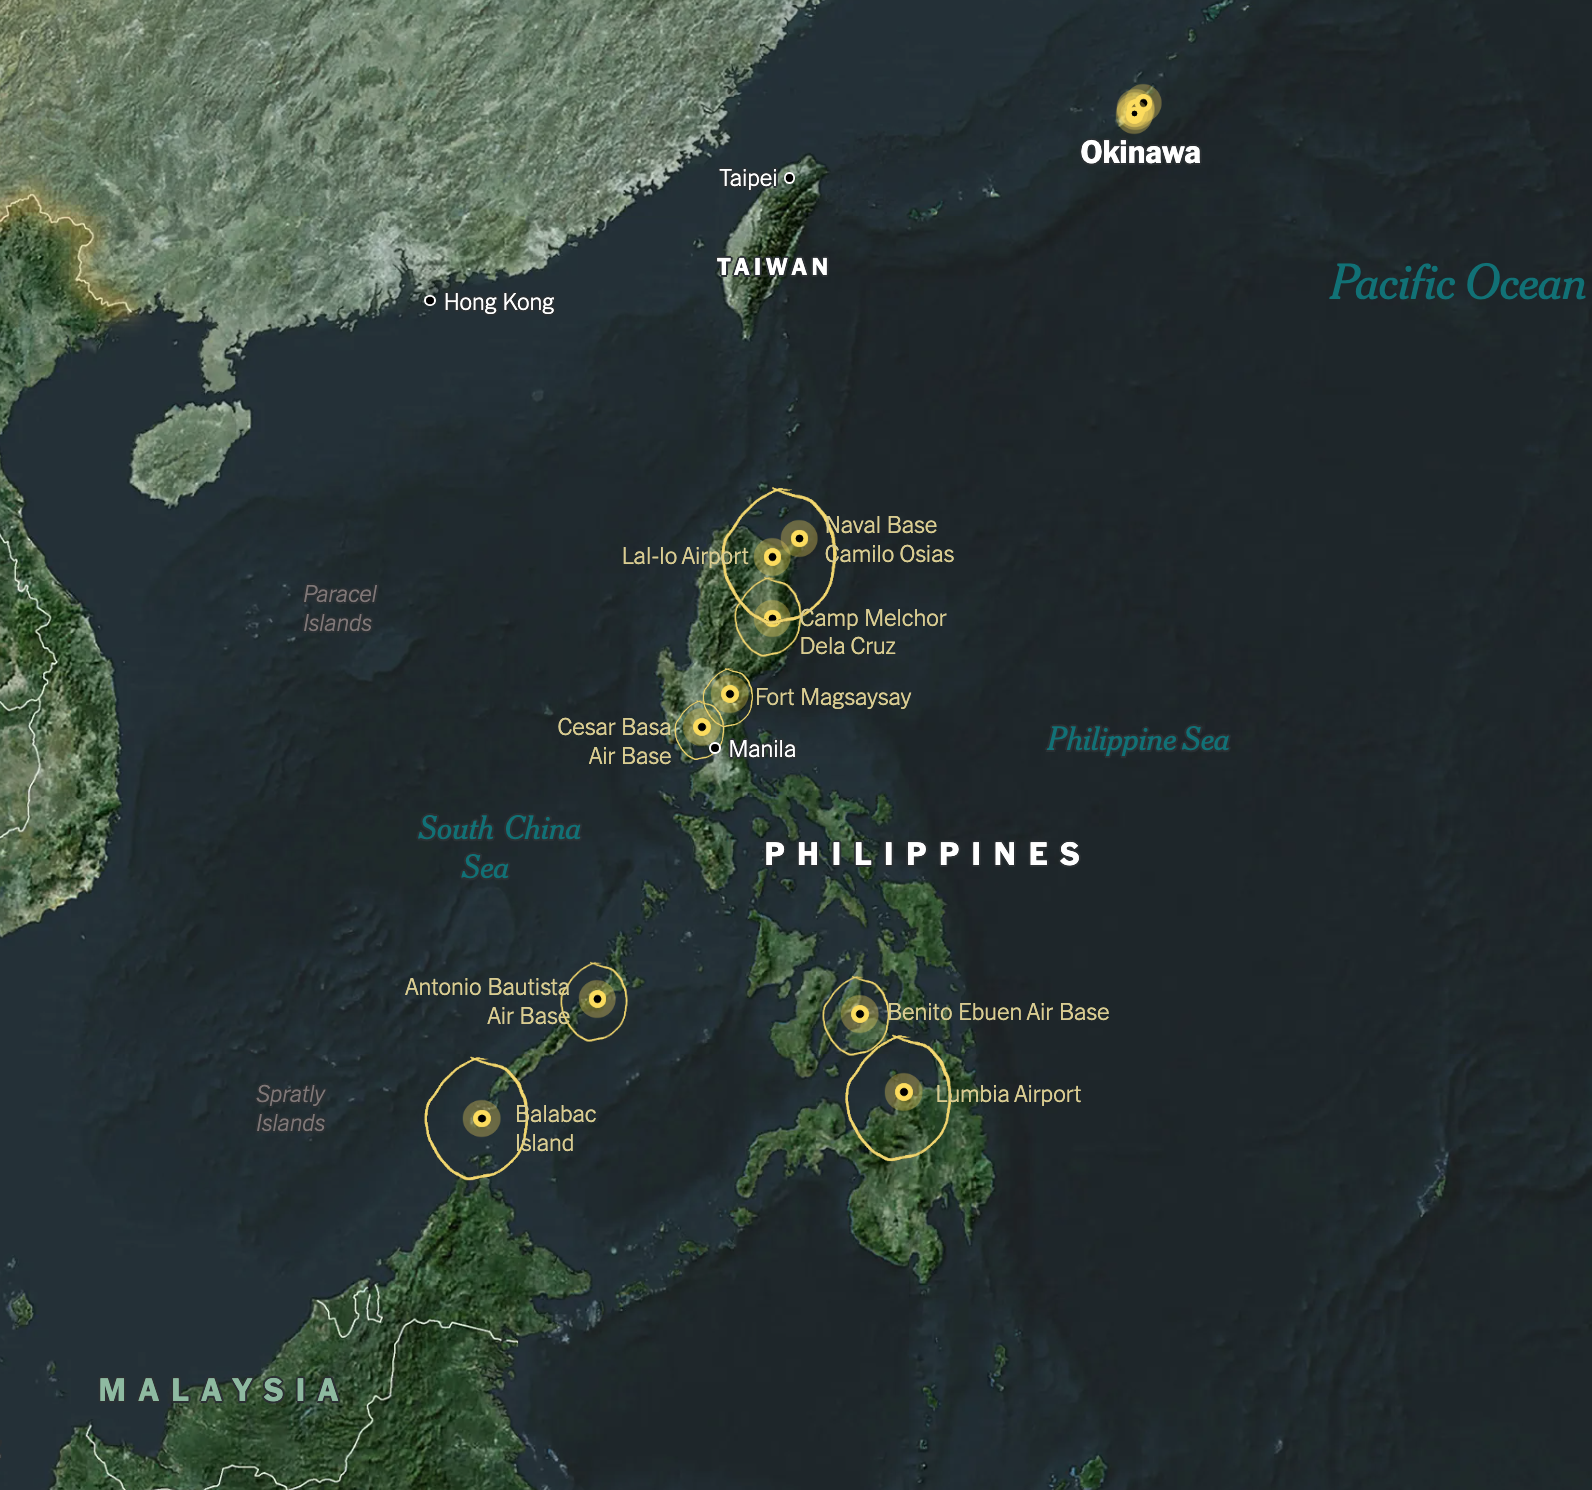
A New Pacific Arsenal to Counter China
The New York Times
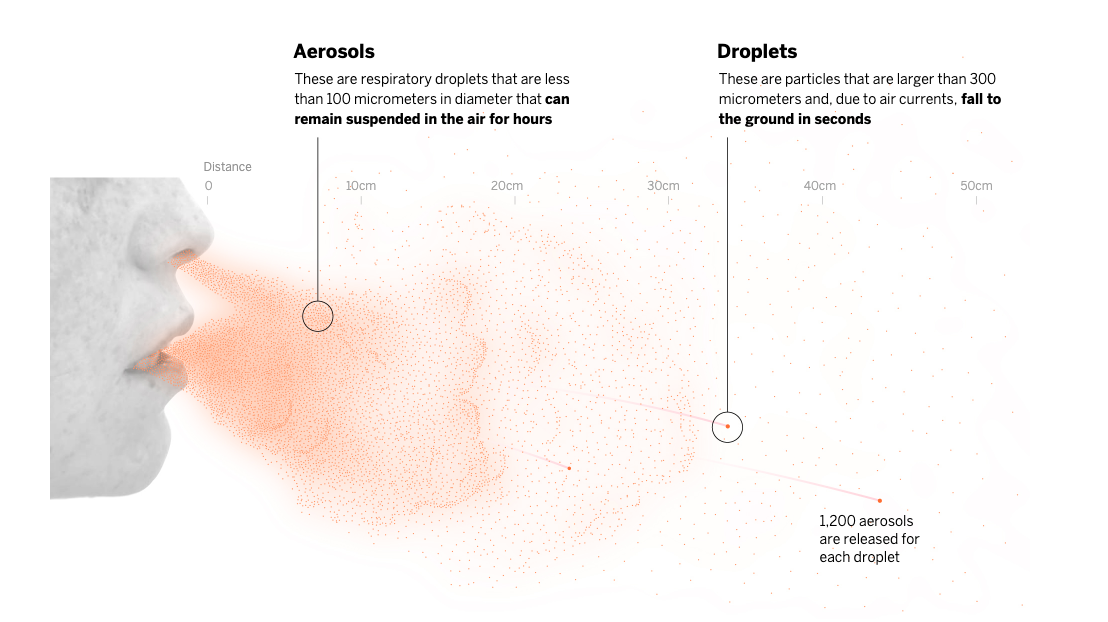
A Room, a Bar and a Classroom: How the Coronavirus is Spread through the Air
El Pais
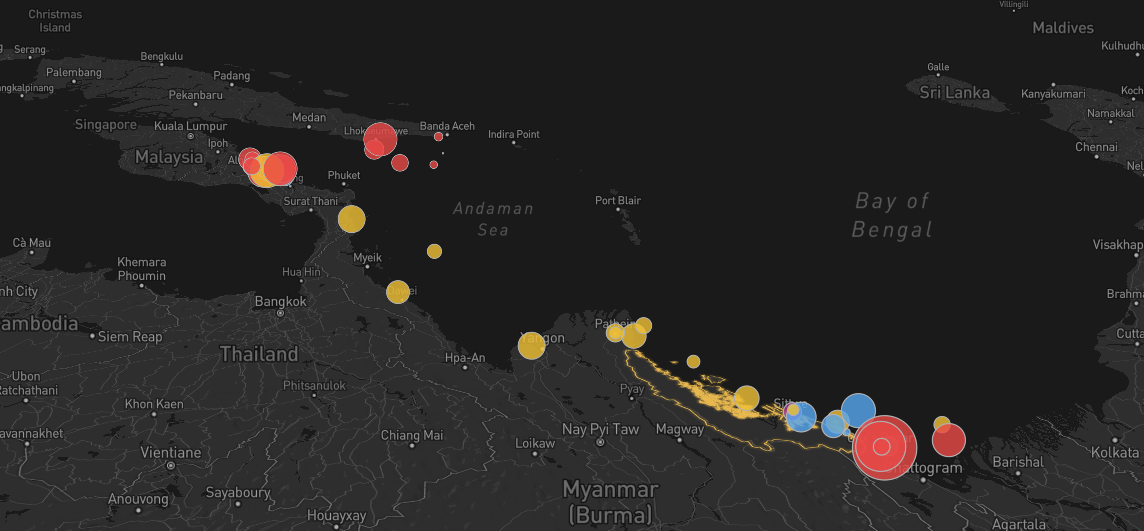
Abandoned at Sea: the Desperate Journeys of Rohingya Refugees
Kontinentalist

ACLU Annual Report 2021
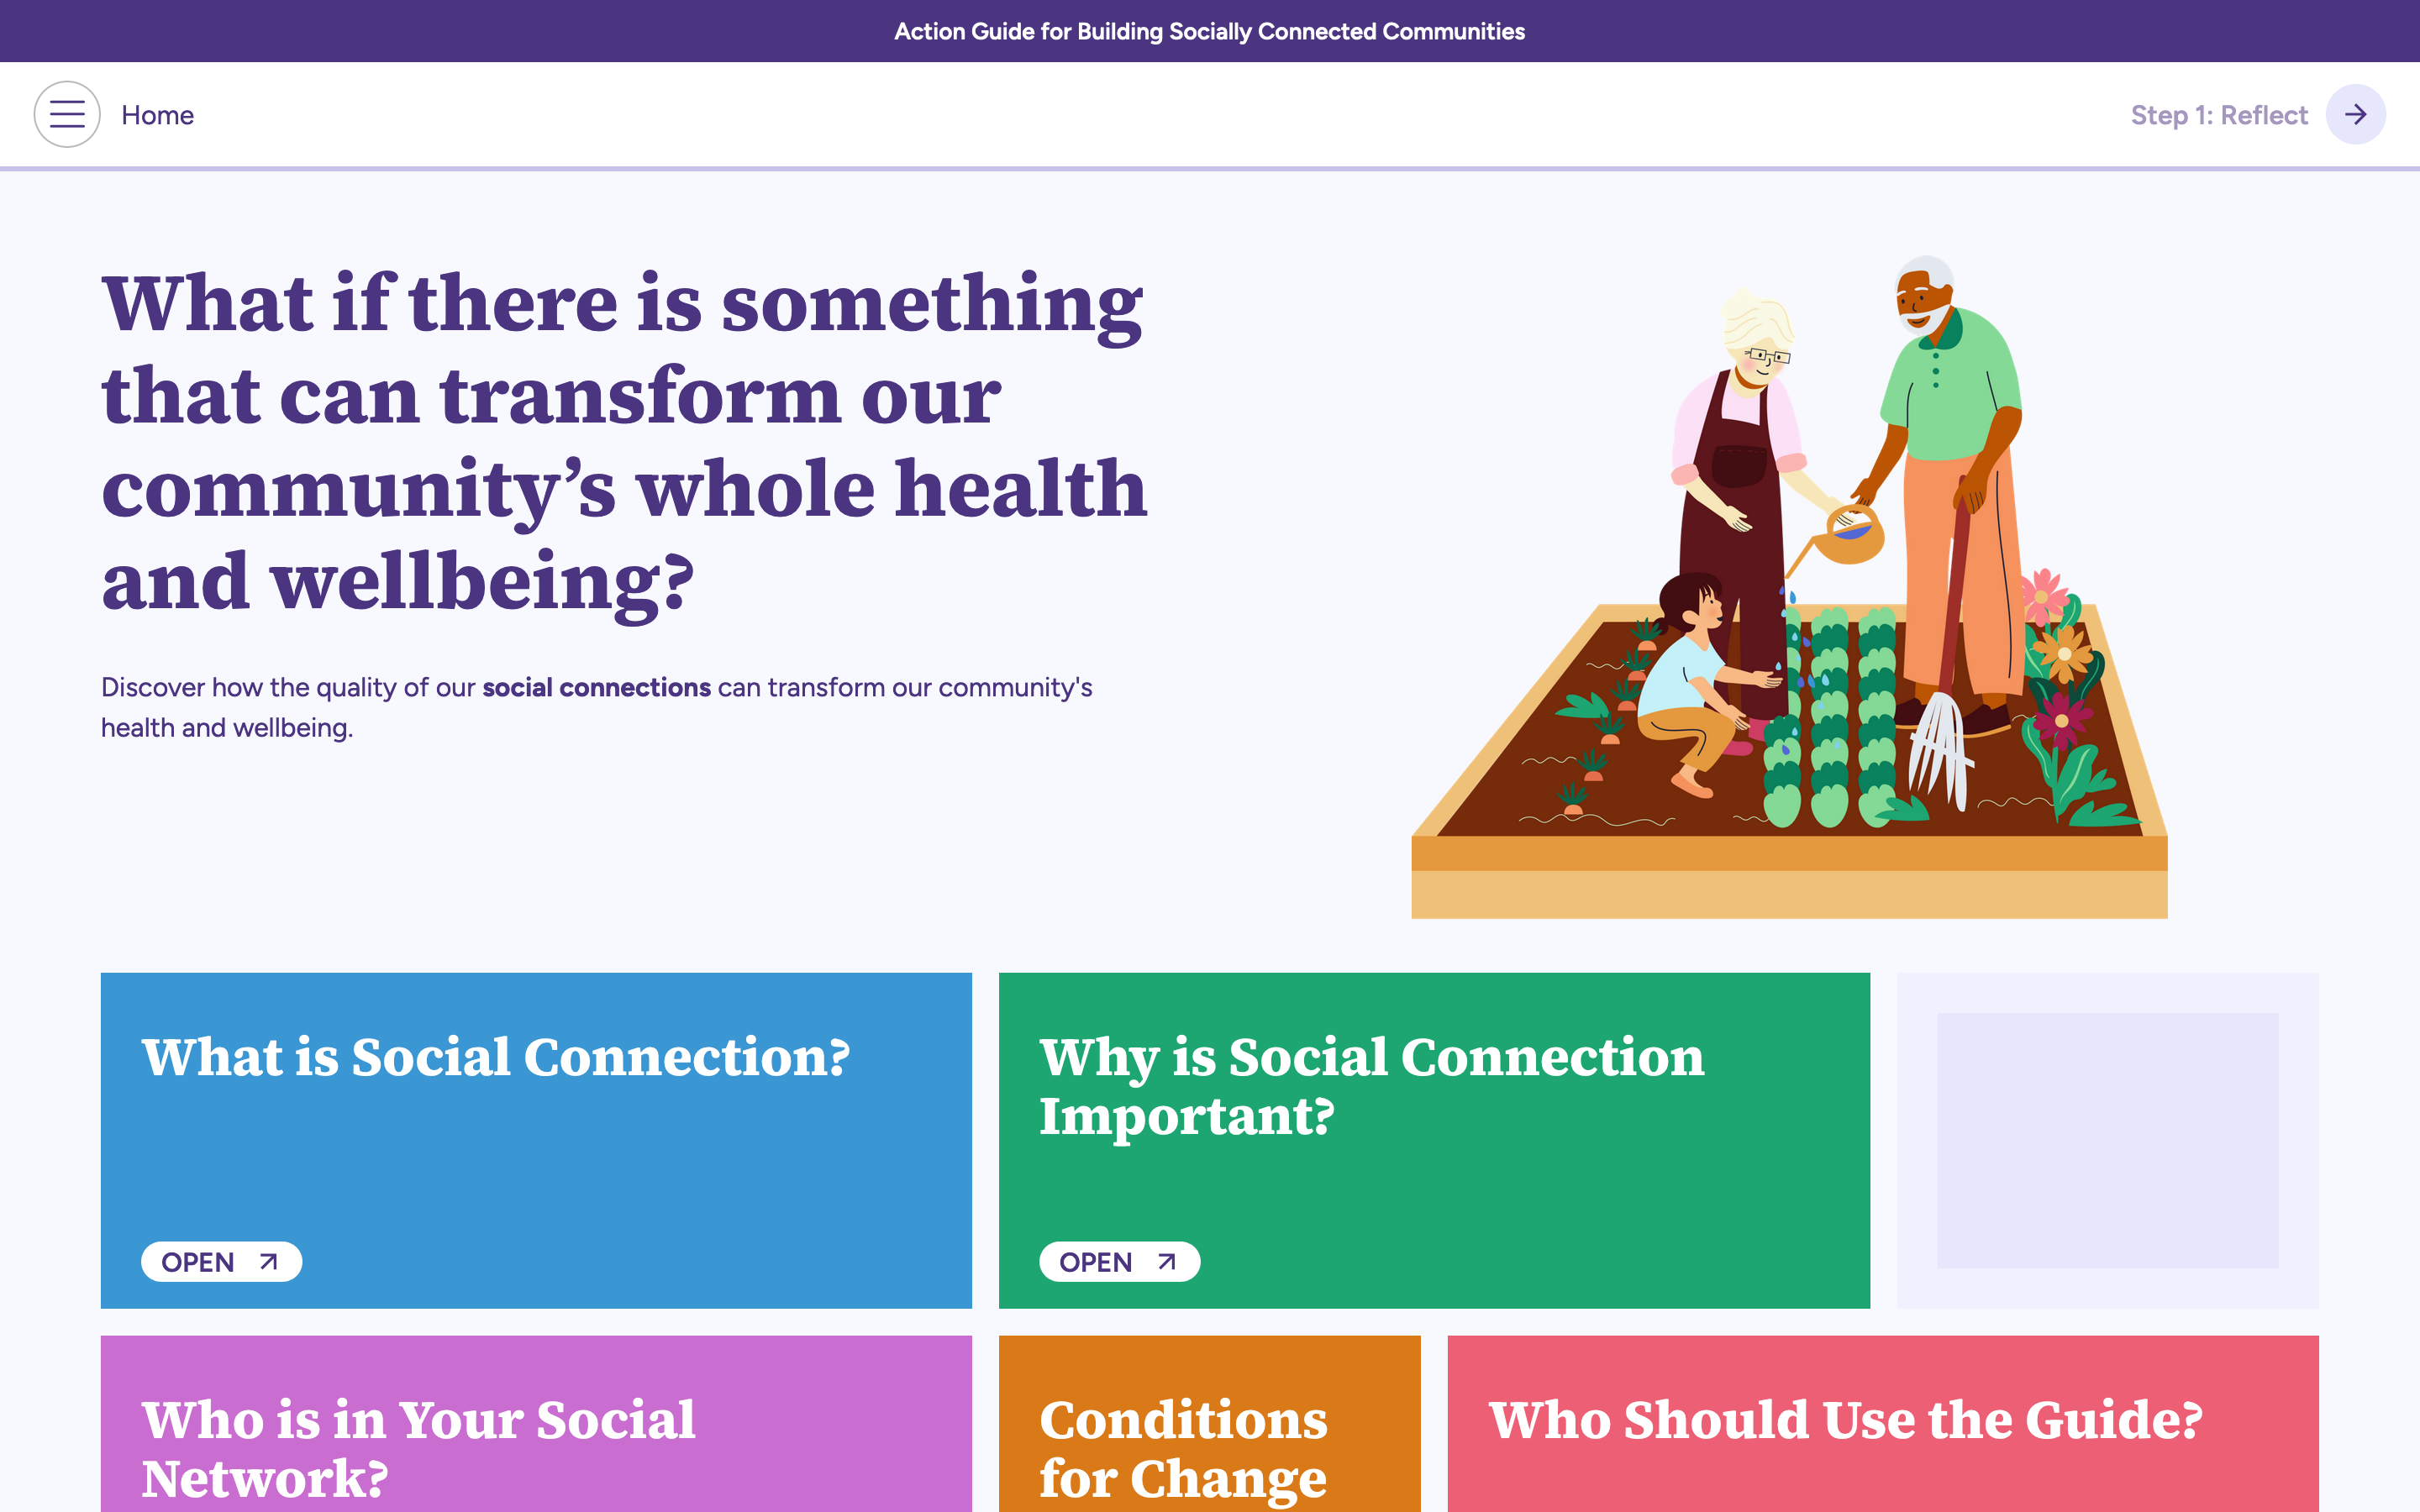
Action Guide for Building Socially Connected Communities
Schema Design
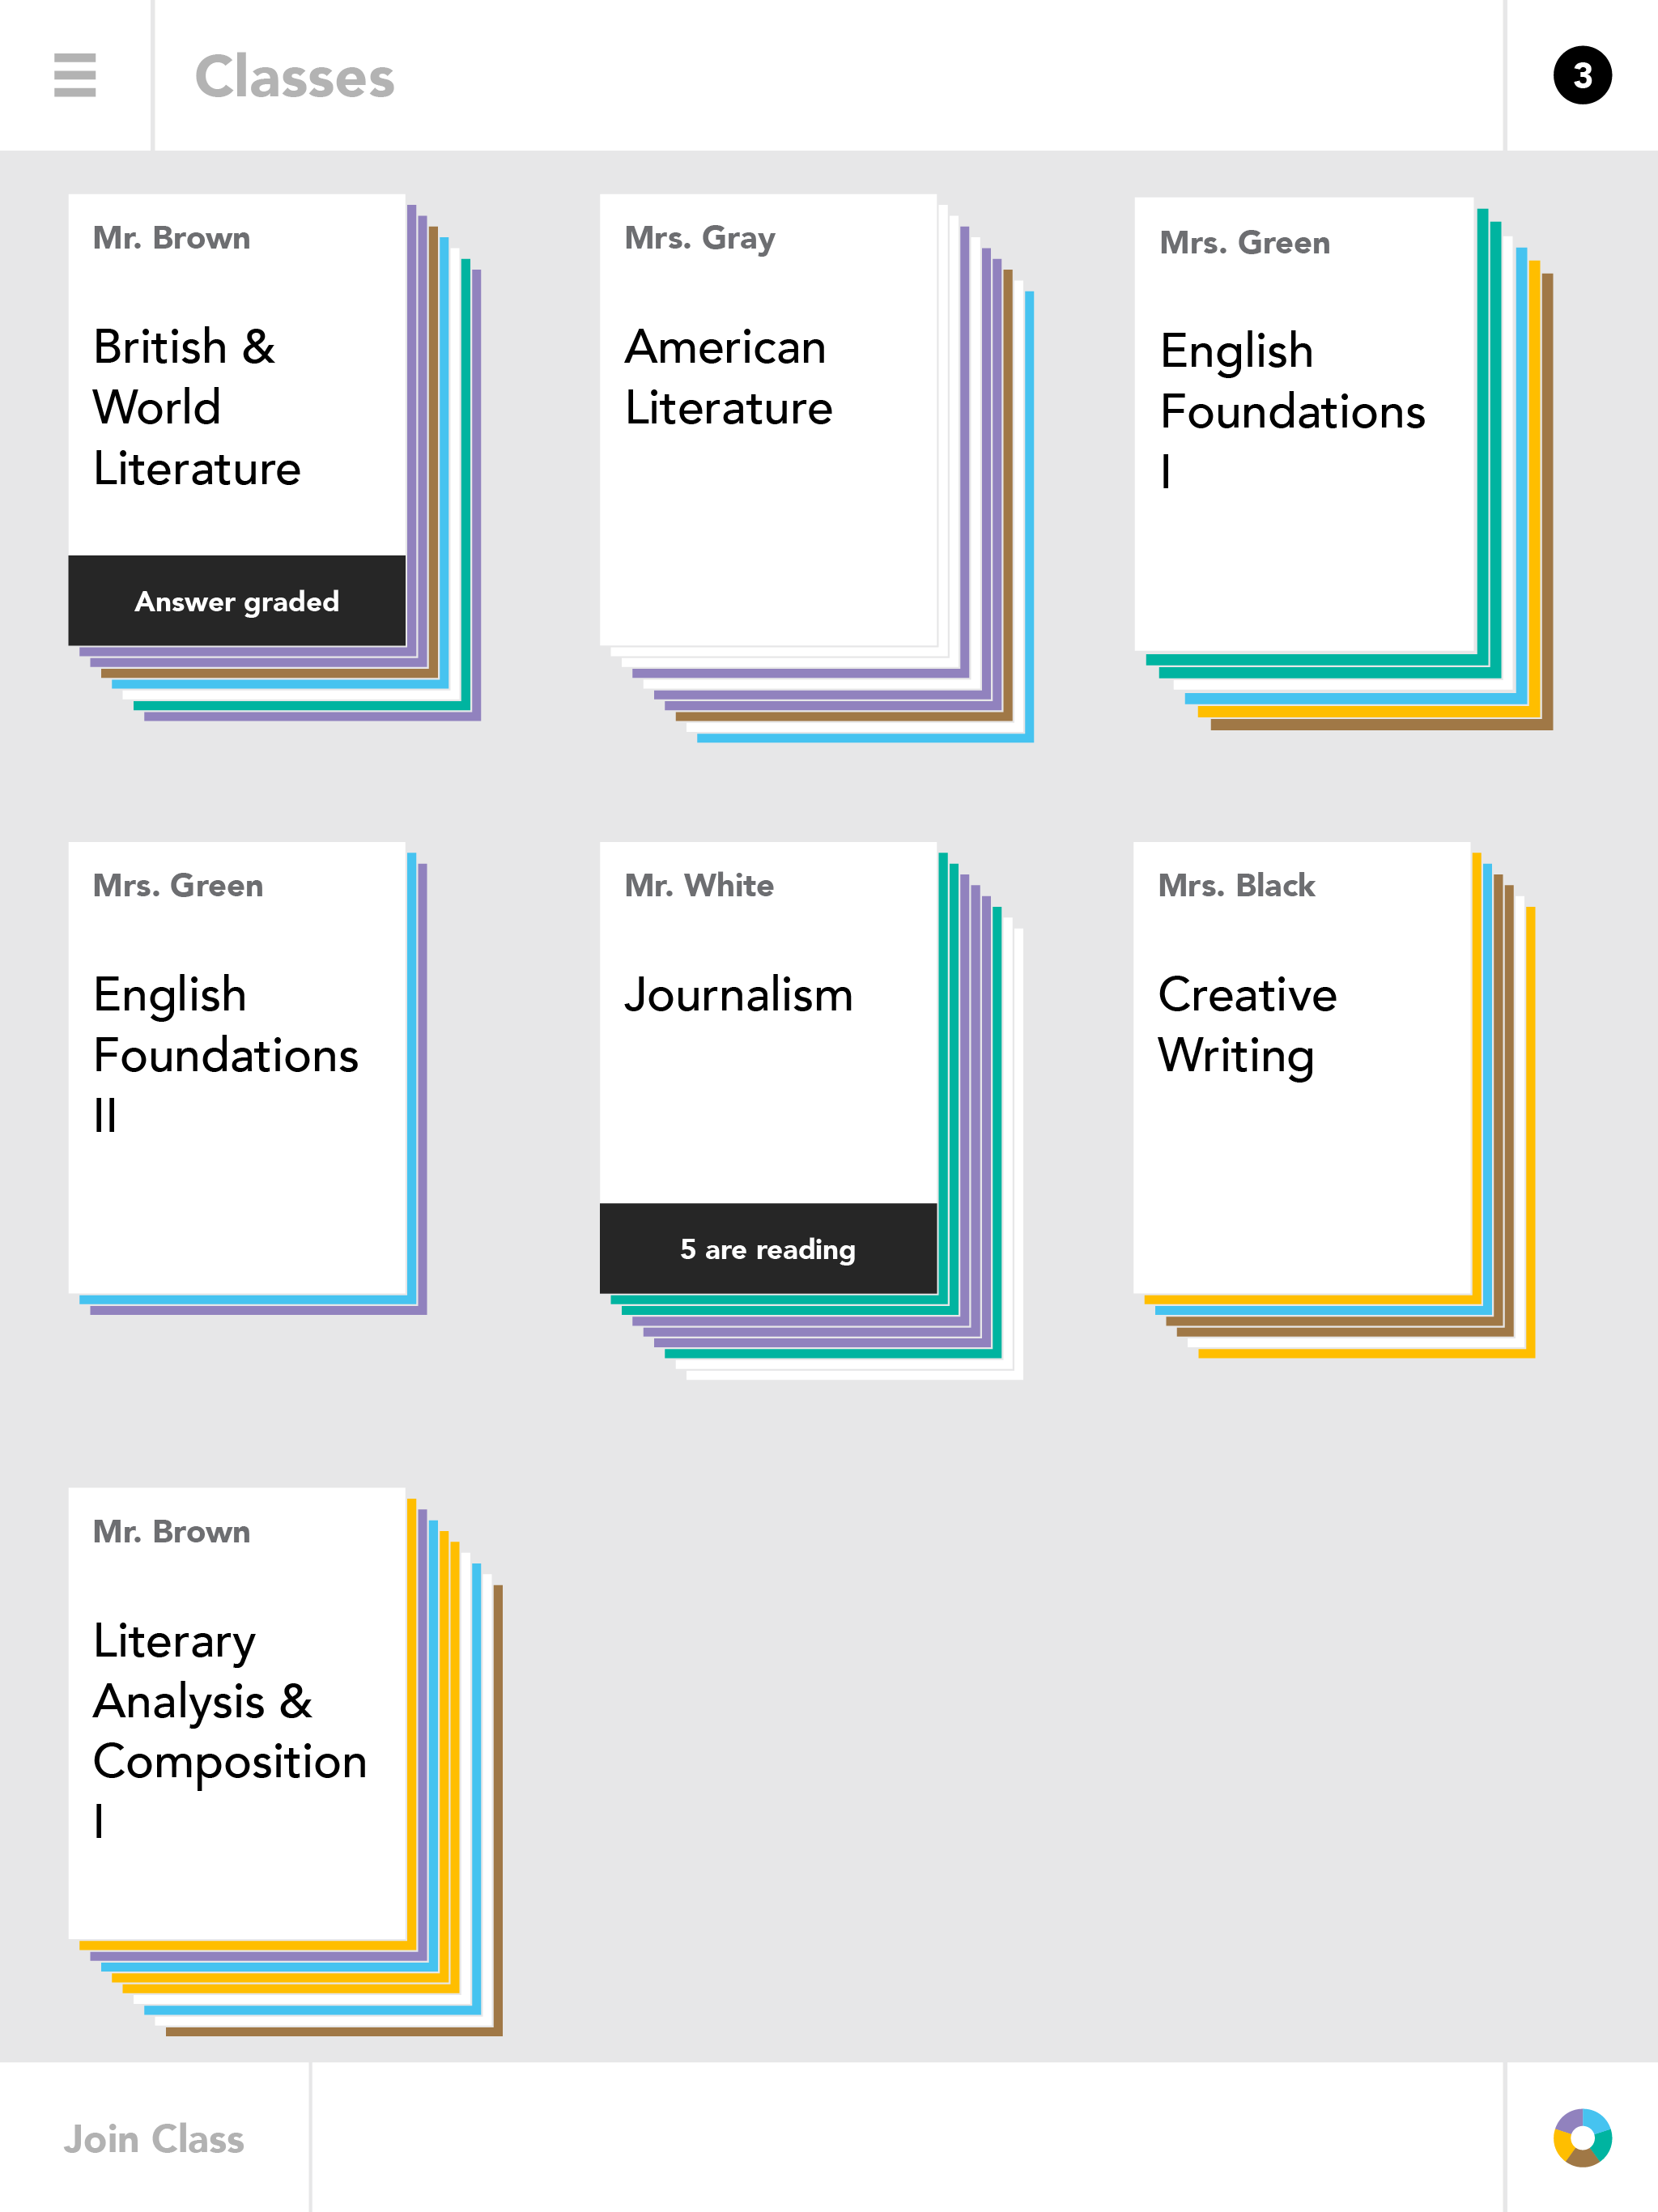
Actively Learn Reader
Schema Design
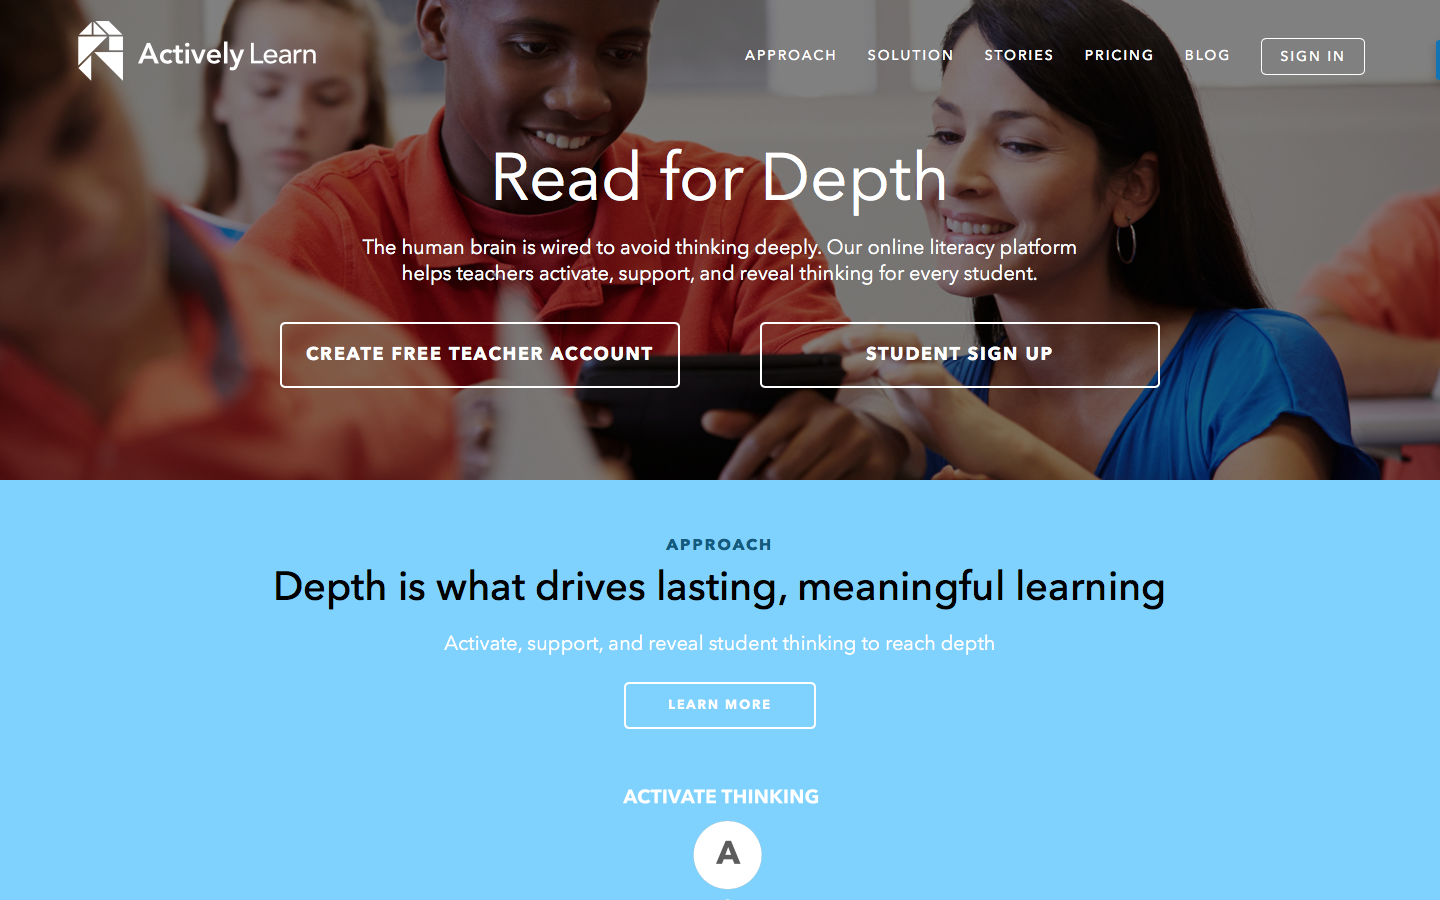
Actively Learn Website
Schema Design

Ada Health
Adding Years to Life and Life to Years
McKinsey

Adventist Health - Garden of Health
Schema Design
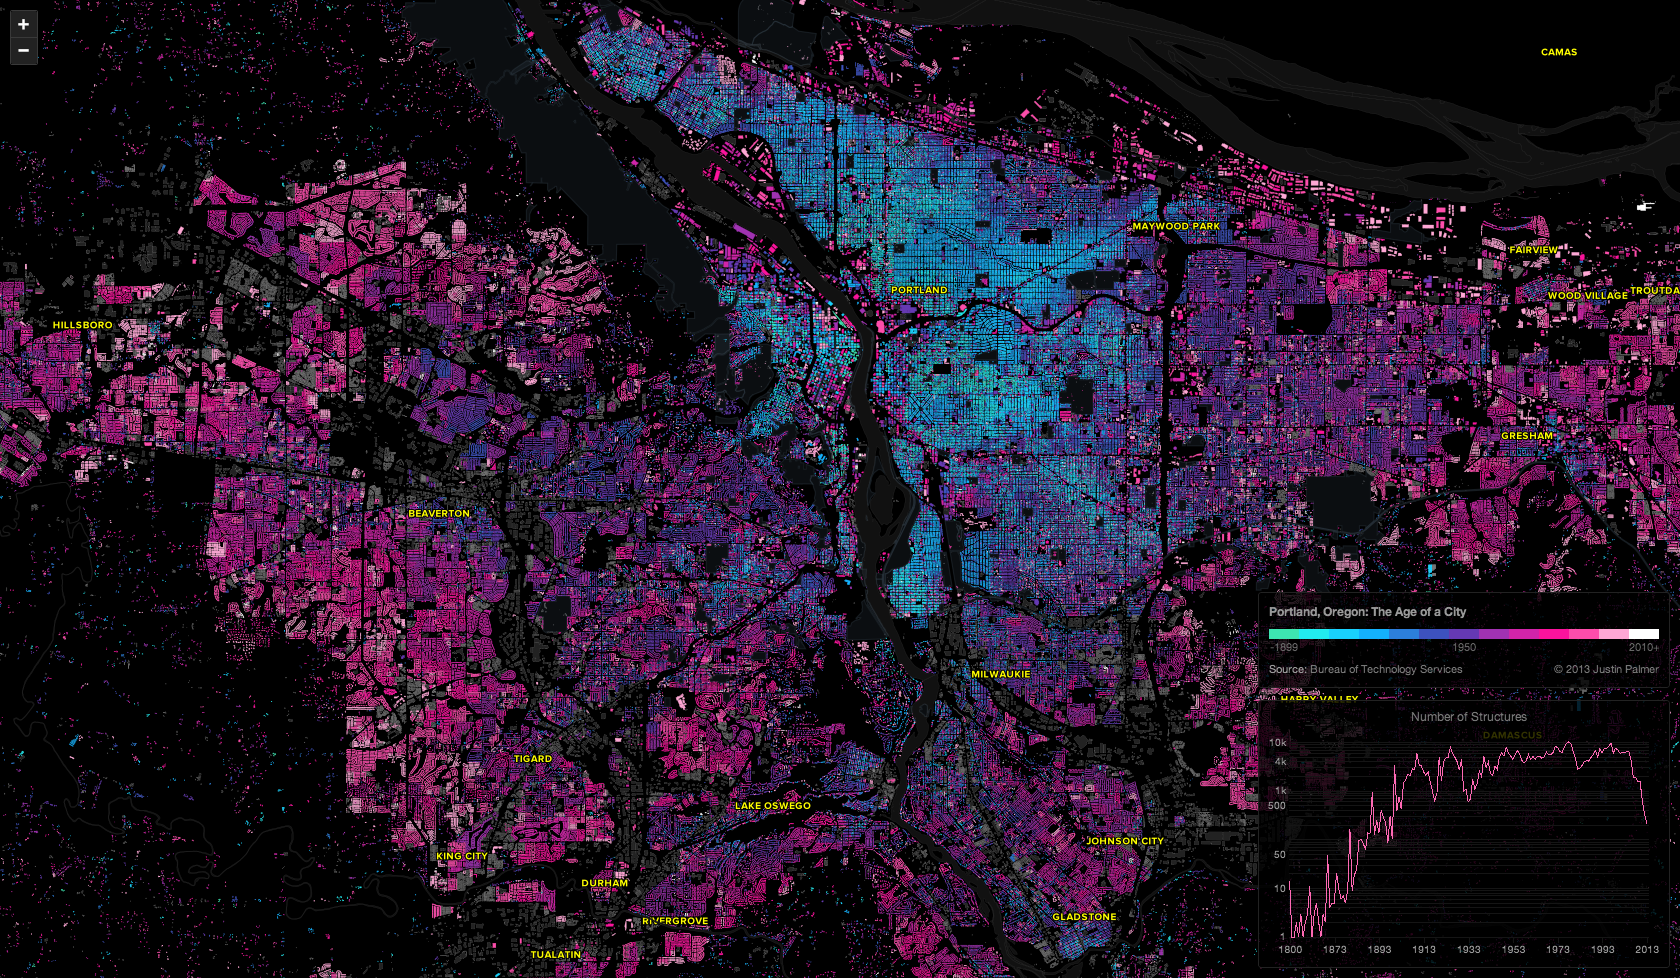
Age of a City
Kelsey Palmer
Agility Cortex
Schema Design
Agora
Schema Design

Airbus Briefing Room
Schema Design

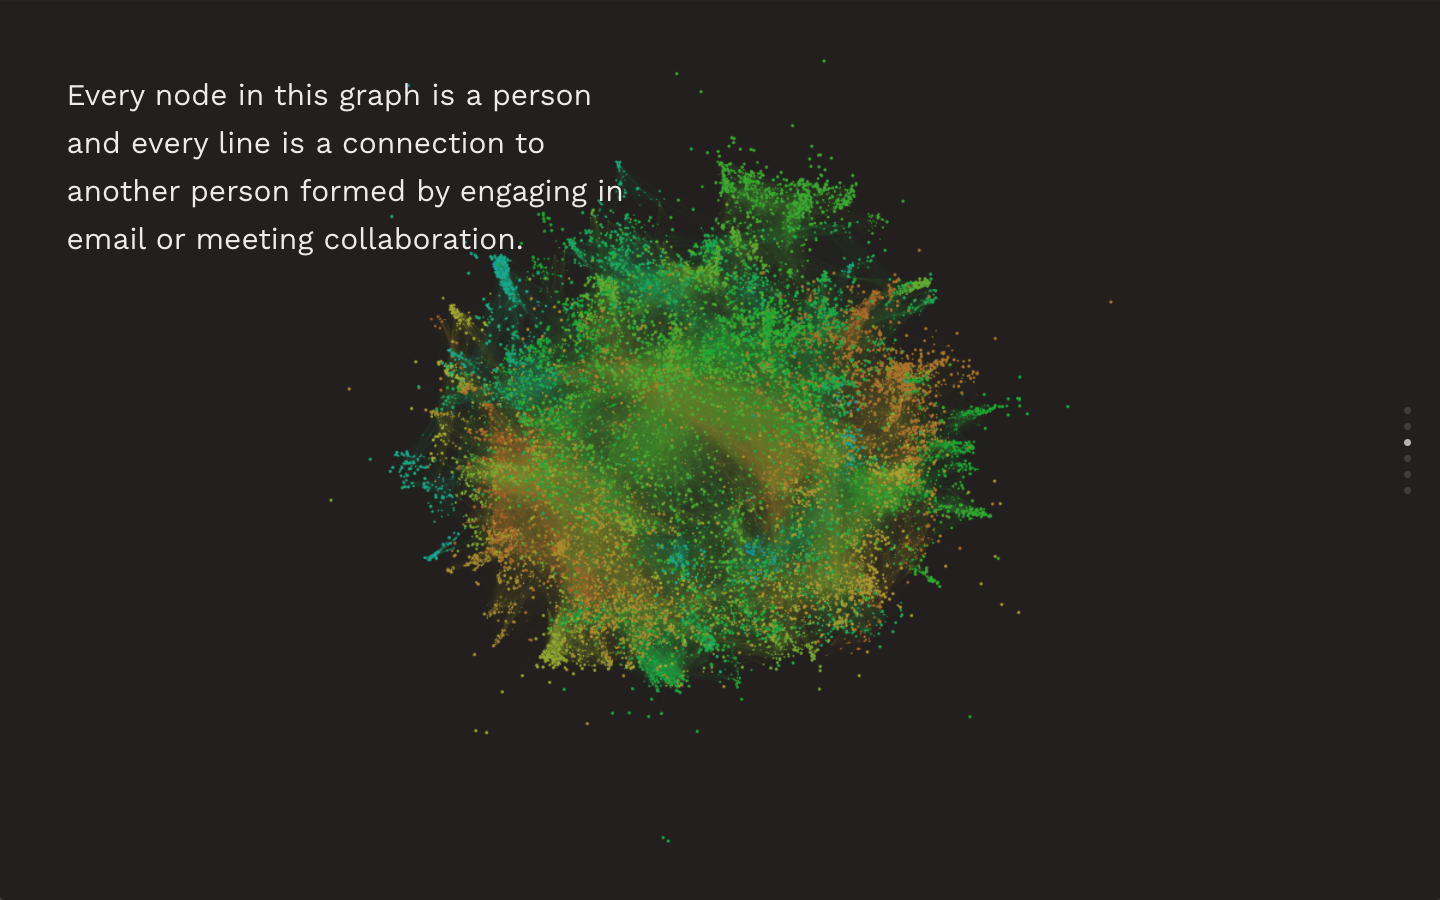
All Flows
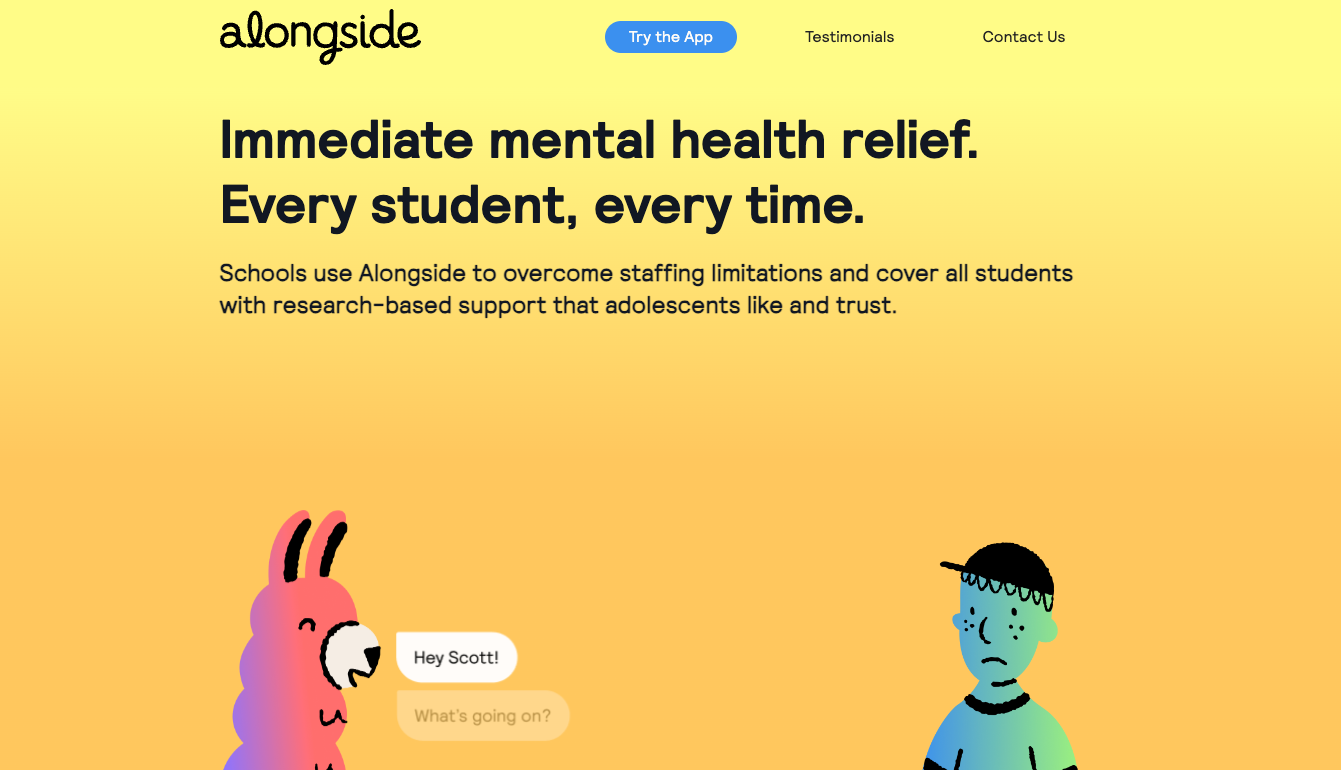
Alongside
Schema Design

Amgen Atlas Drug Delivery
Schema Design
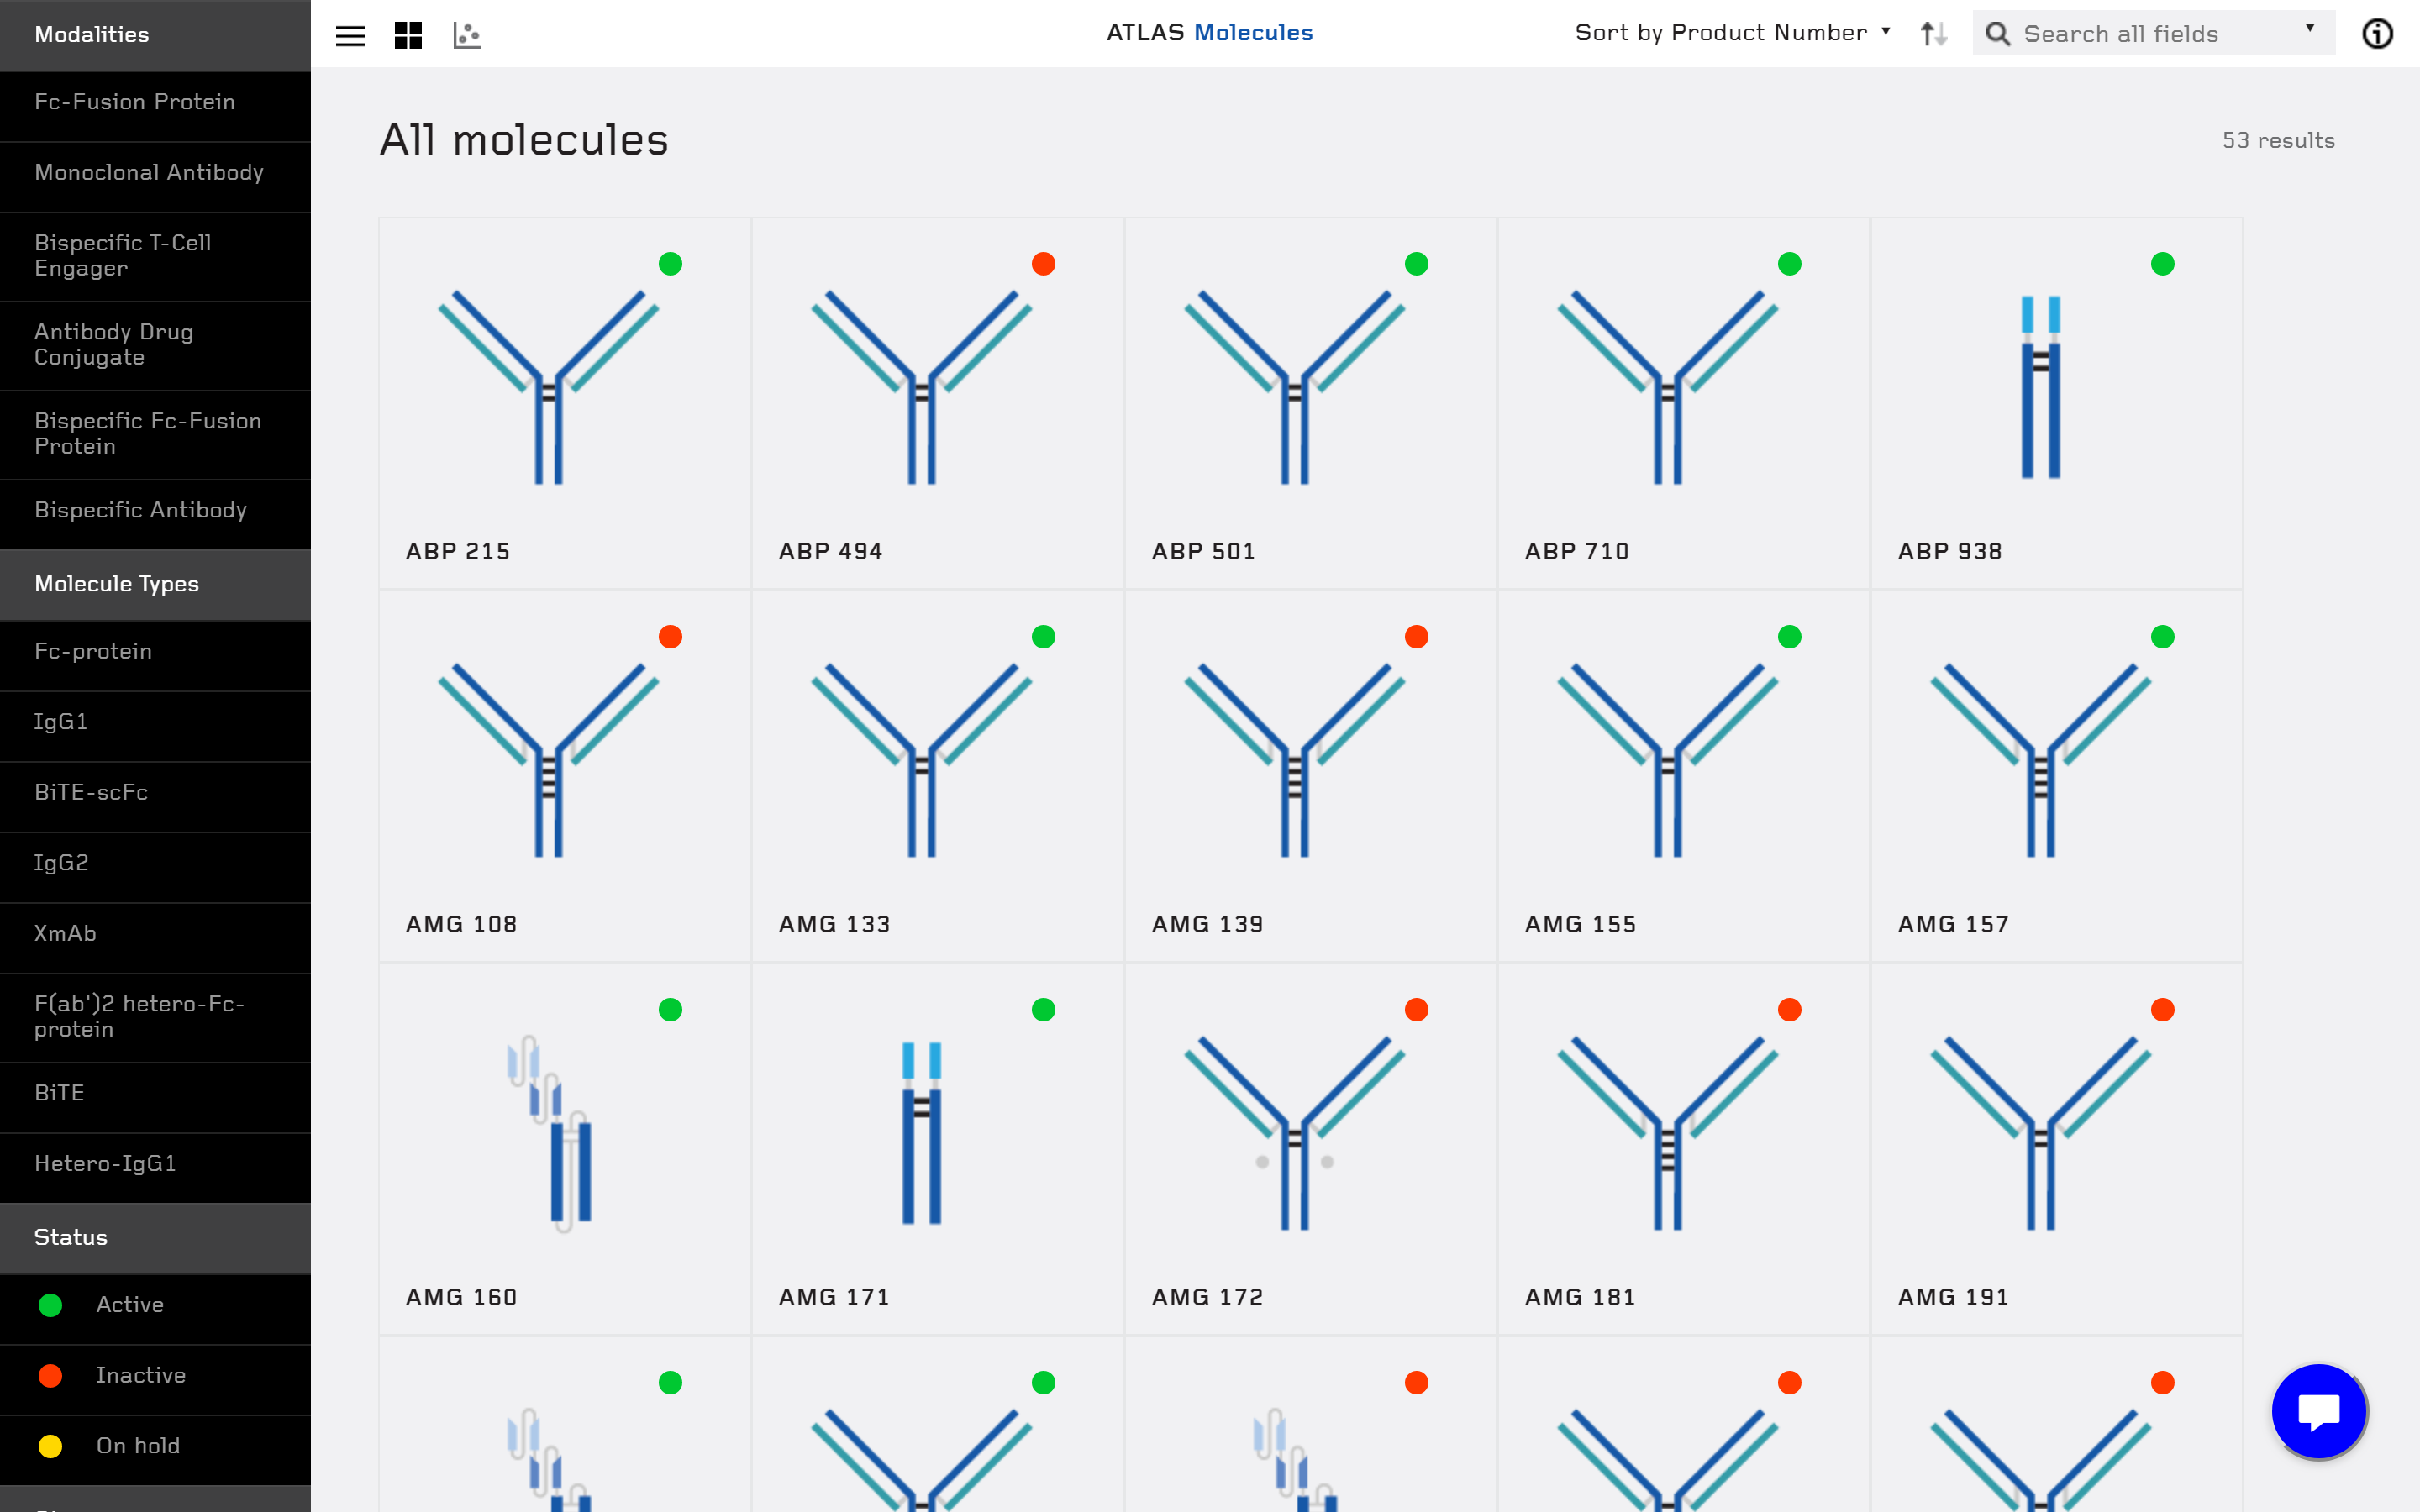
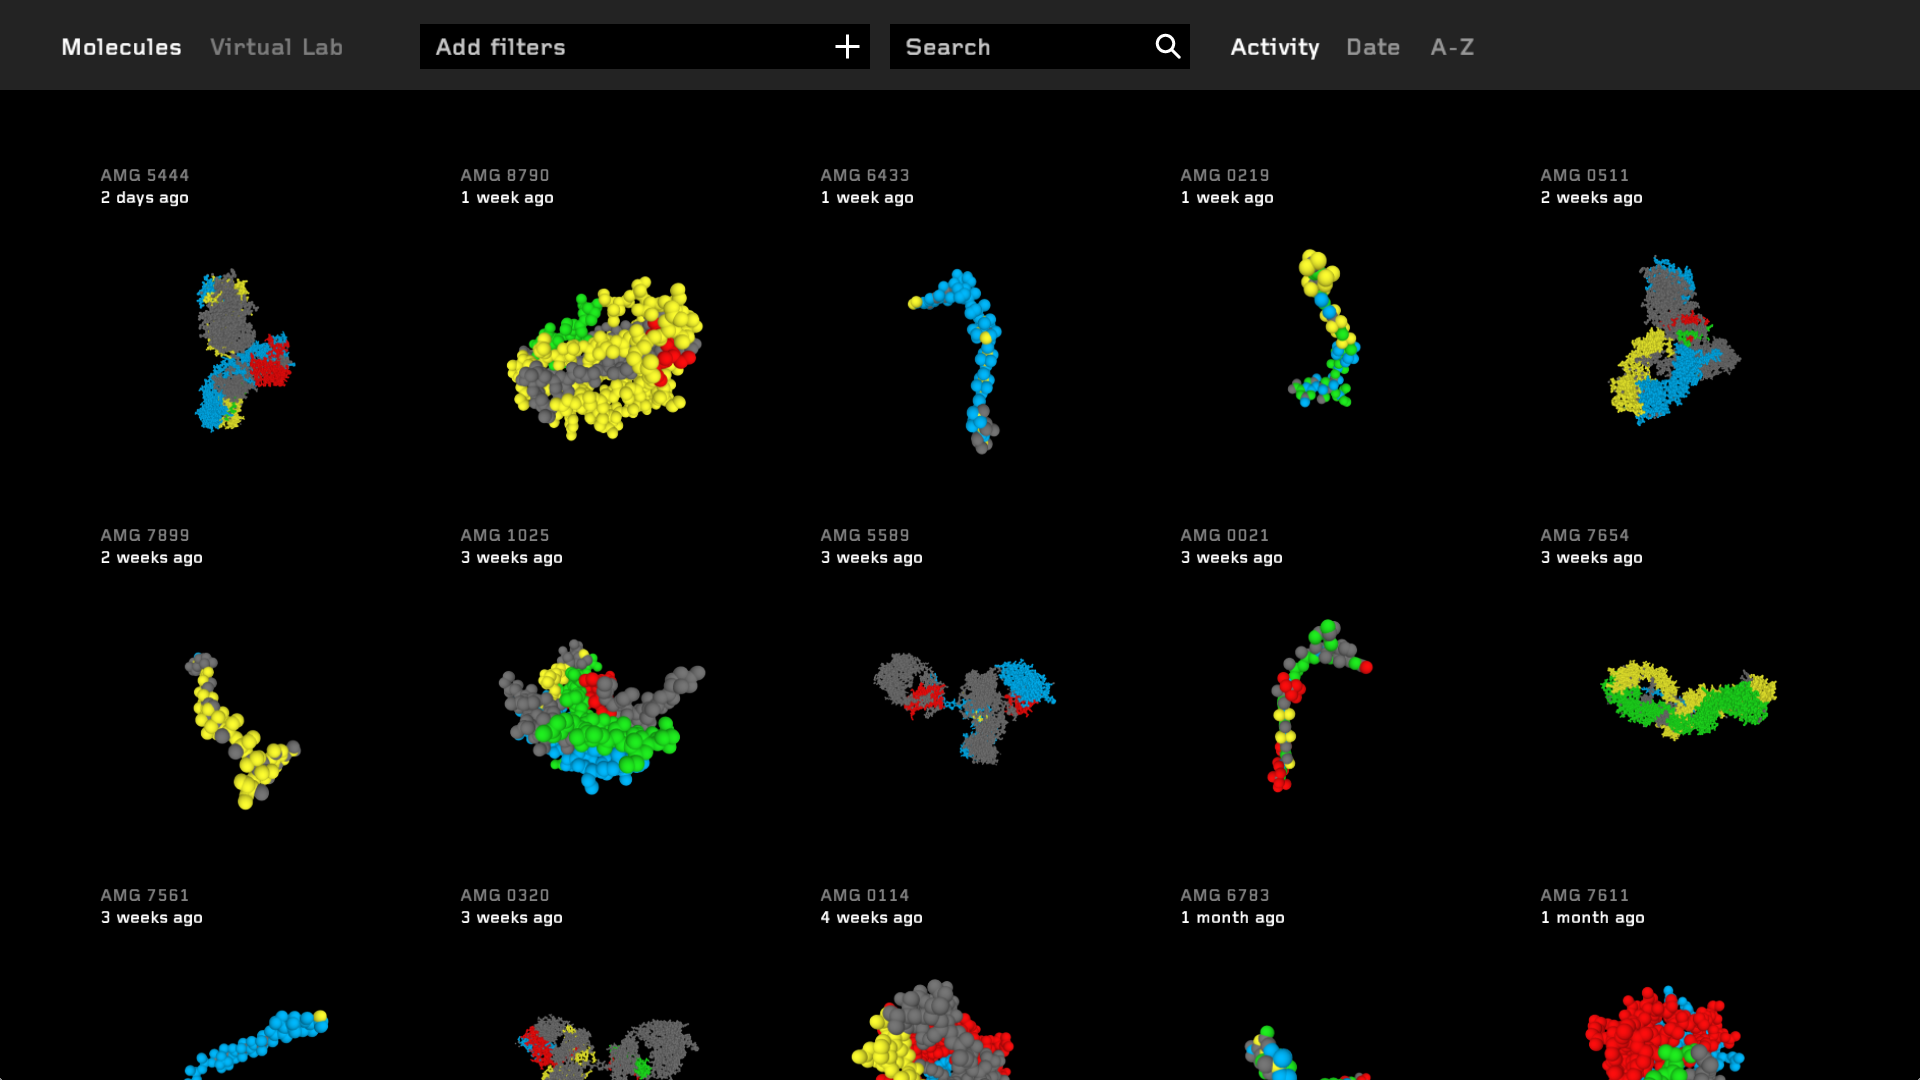
Amgen Atlas Molecules
Schema Design
Amgen Atlas Prototype
Schema Design
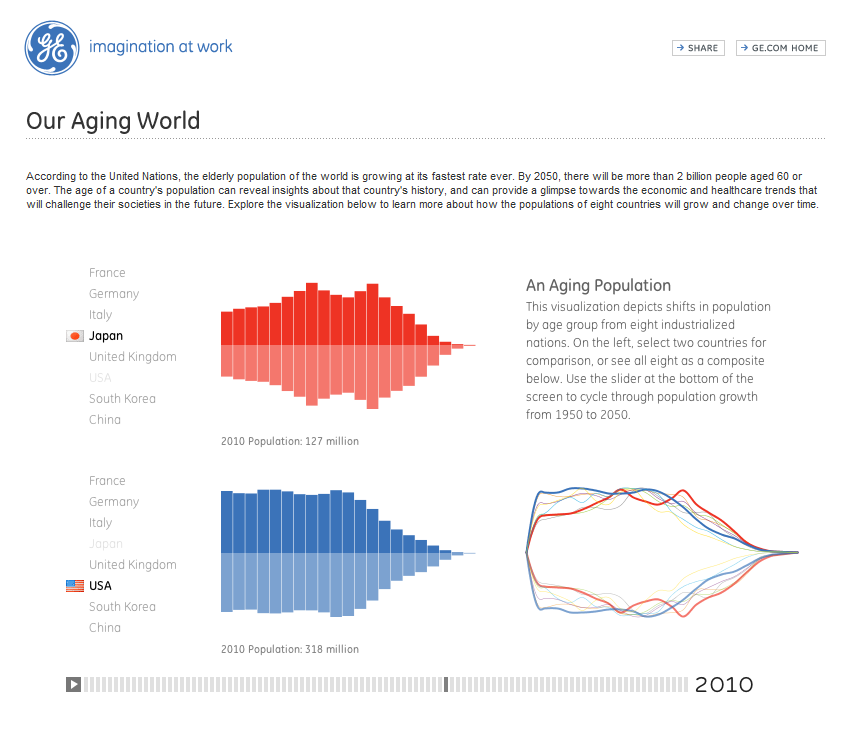
An Aging Population
Fathom Information Design
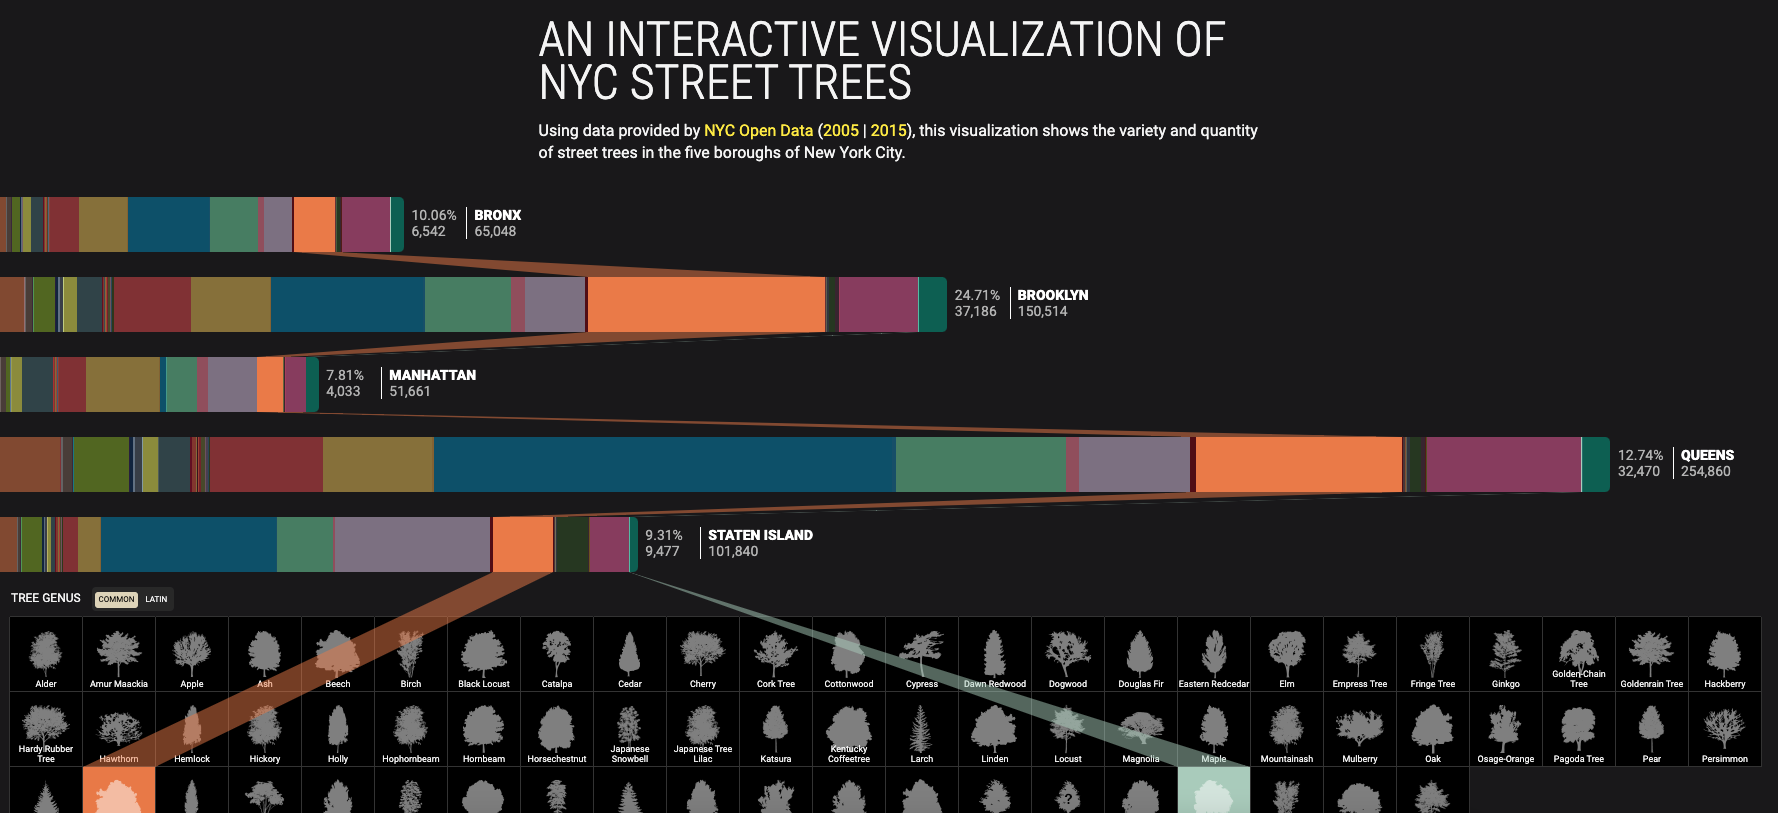
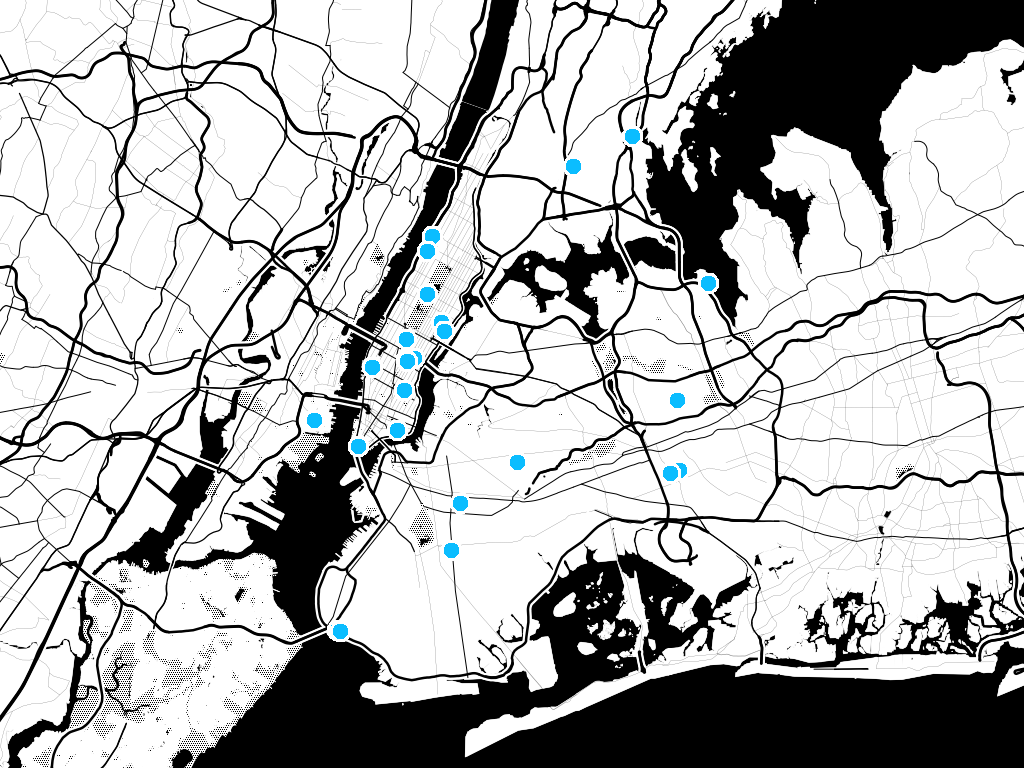
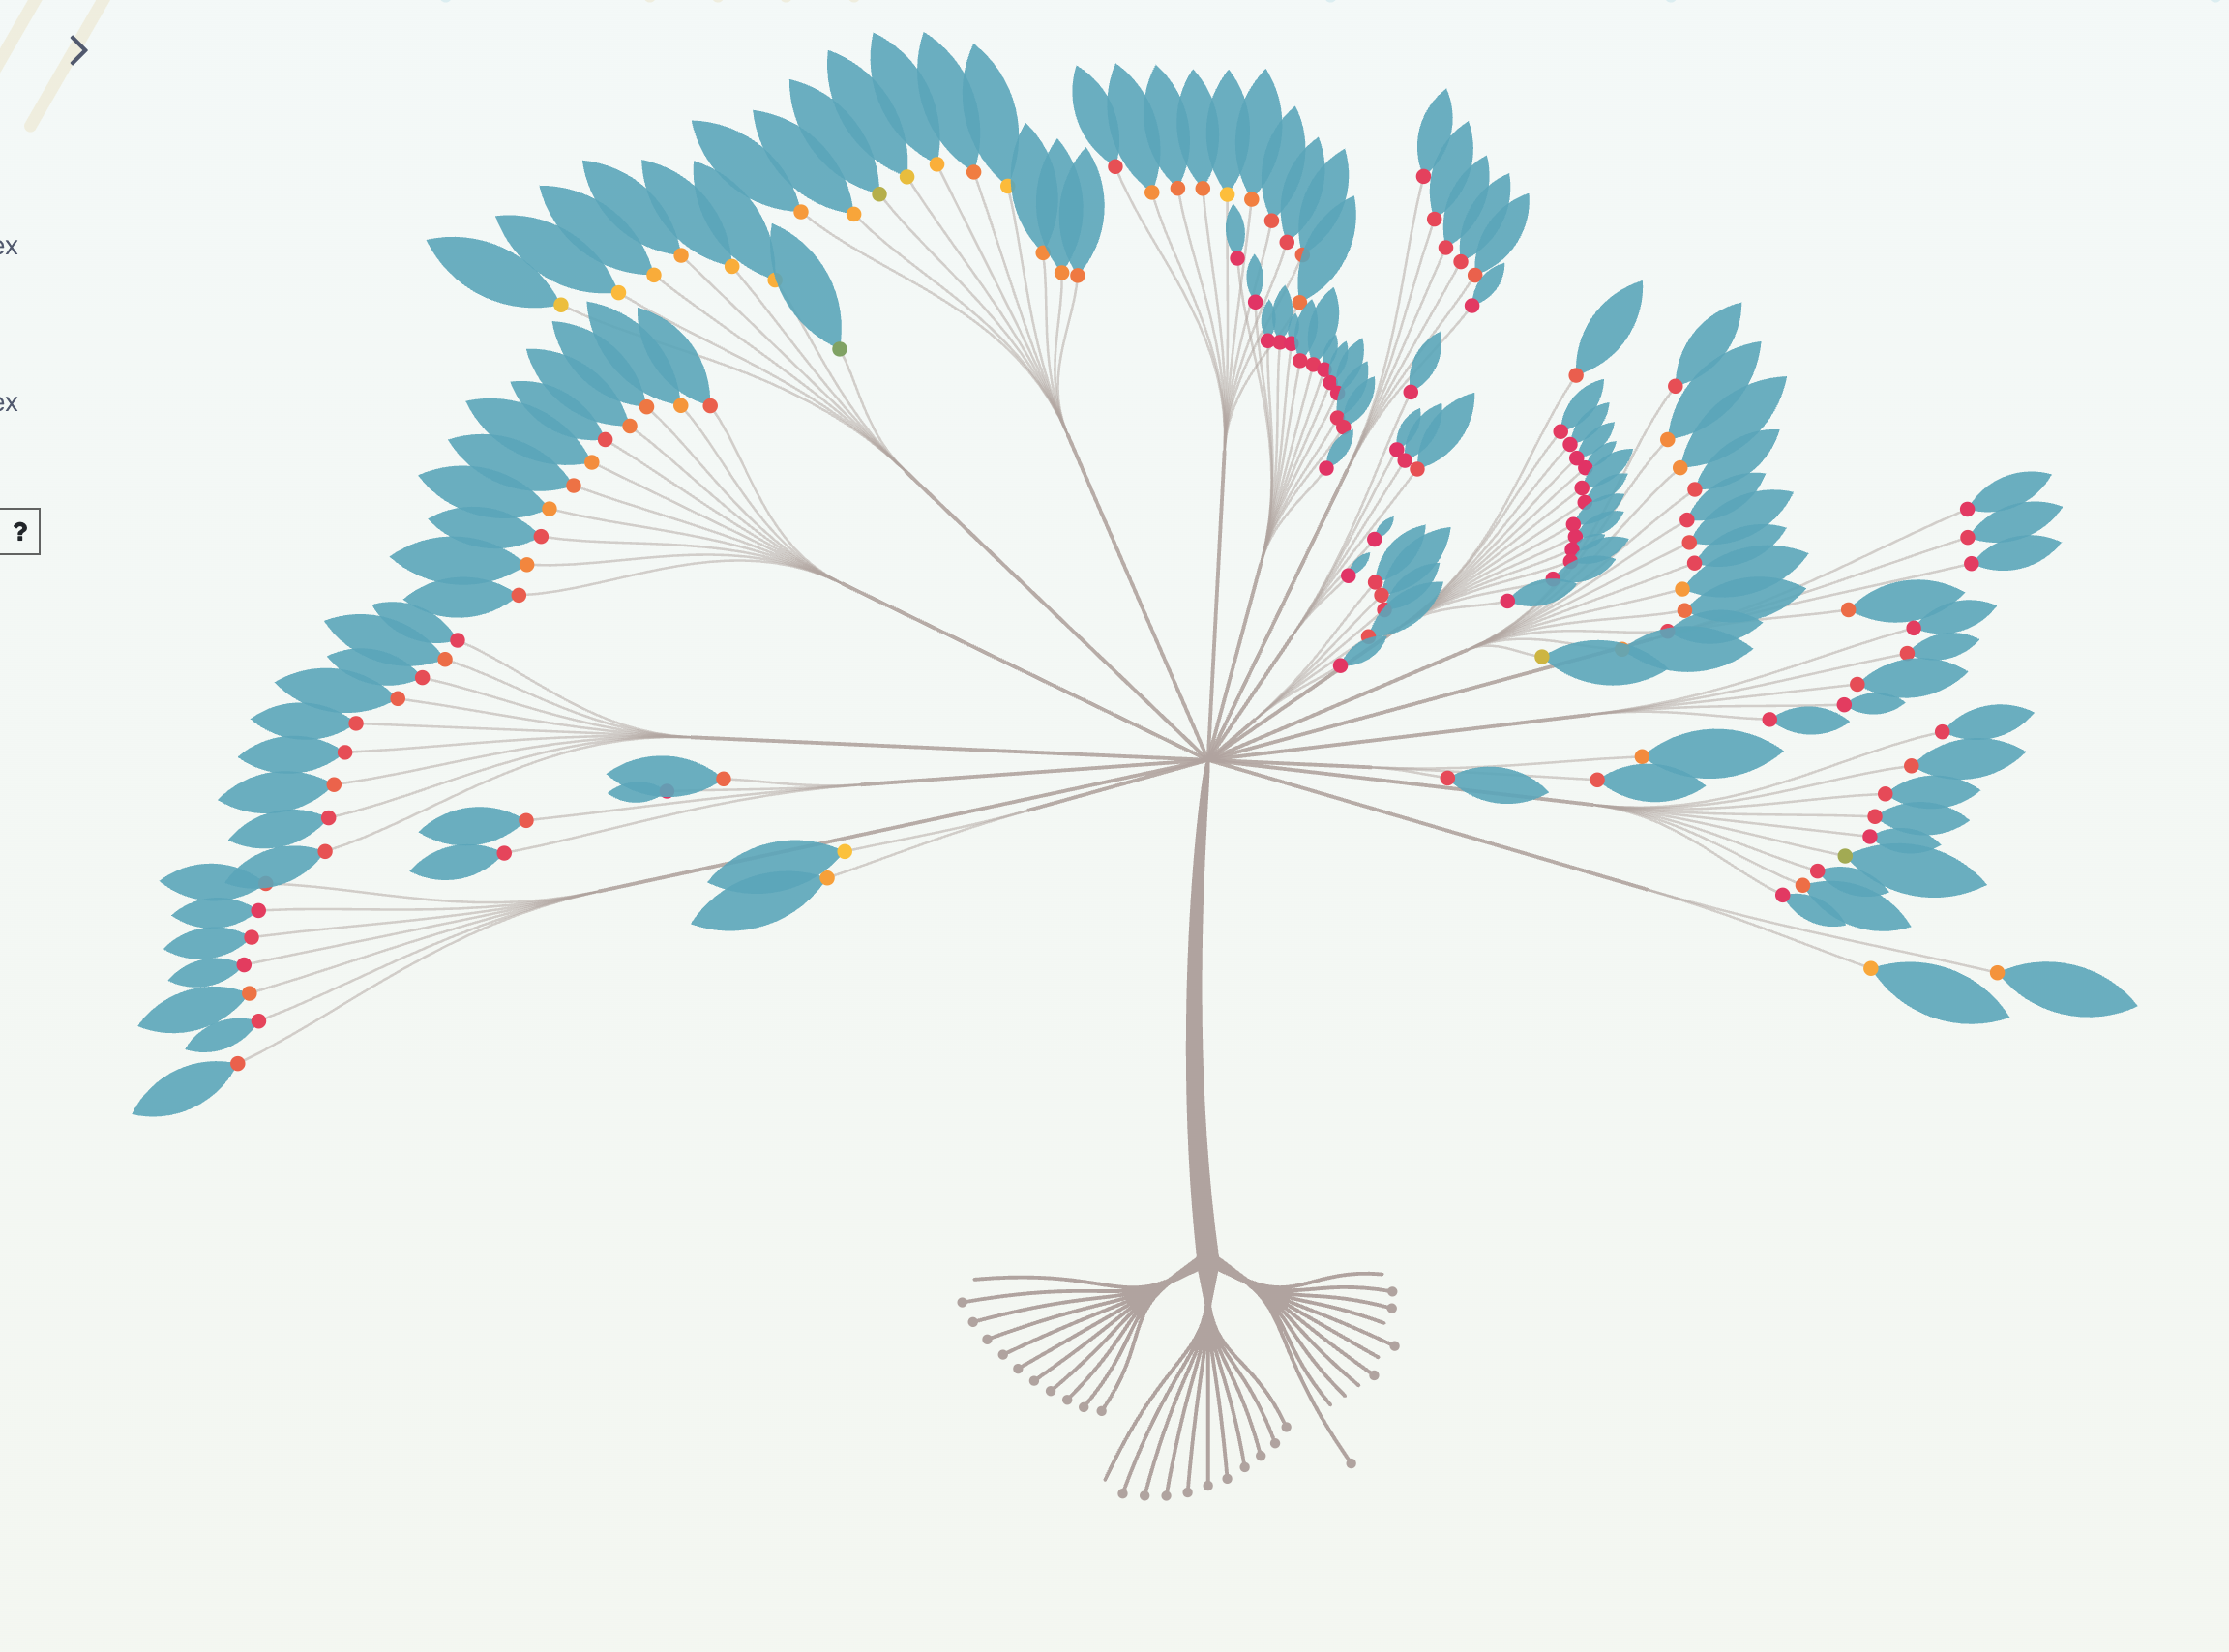
An Interactive Visualization of NYC Street Trees
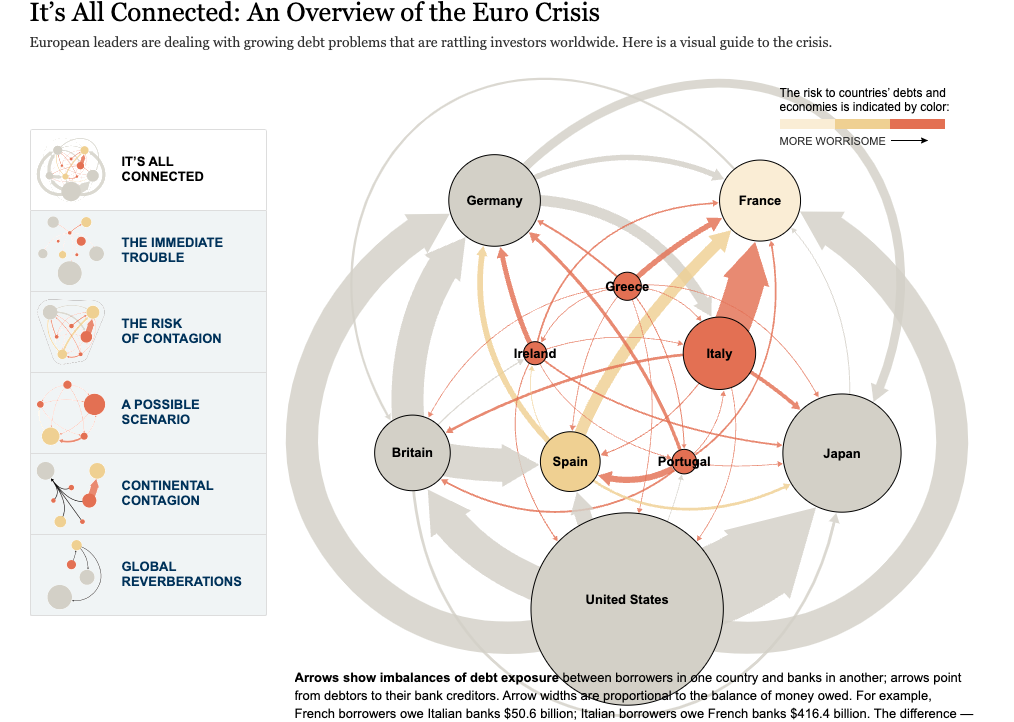
An Overview of the Euro Crisis
The New York Times

Anatomy of Our Battle against COVID-19
ABC News
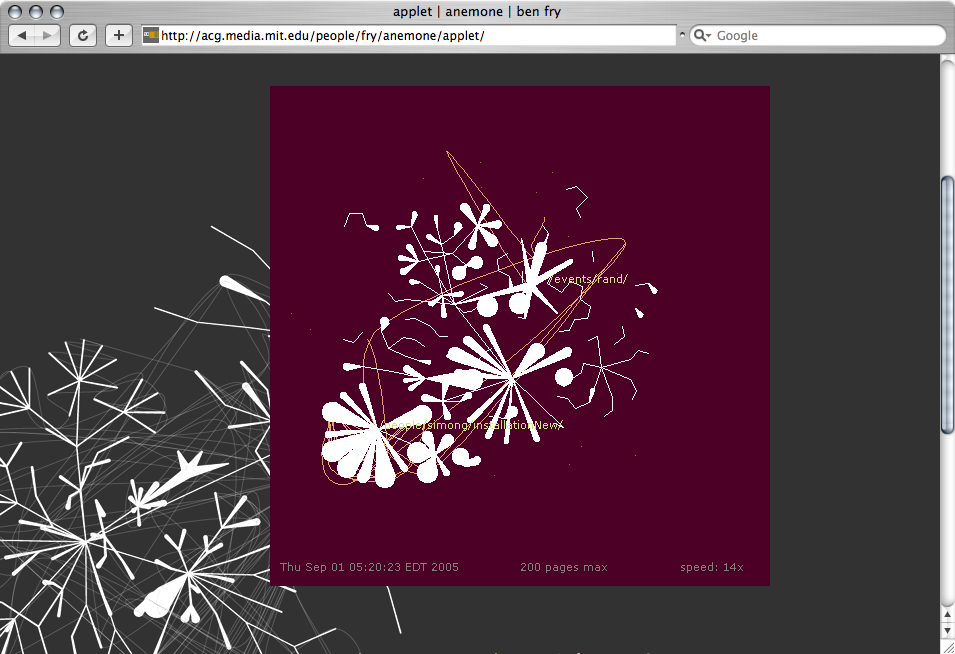
Anemone
Ben Fry
Apossible
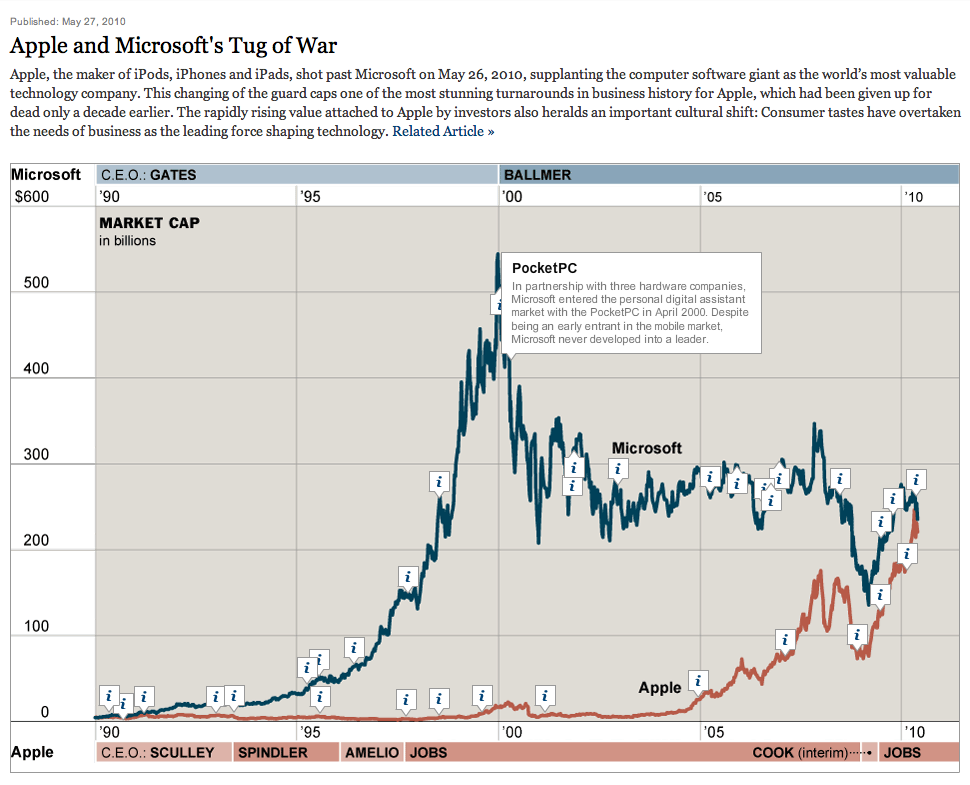
Apple vs Microsoft
New York Times Graphics

ArtCenter
ArtCenter College of Design
Asia Matters for America Website
Schema Design
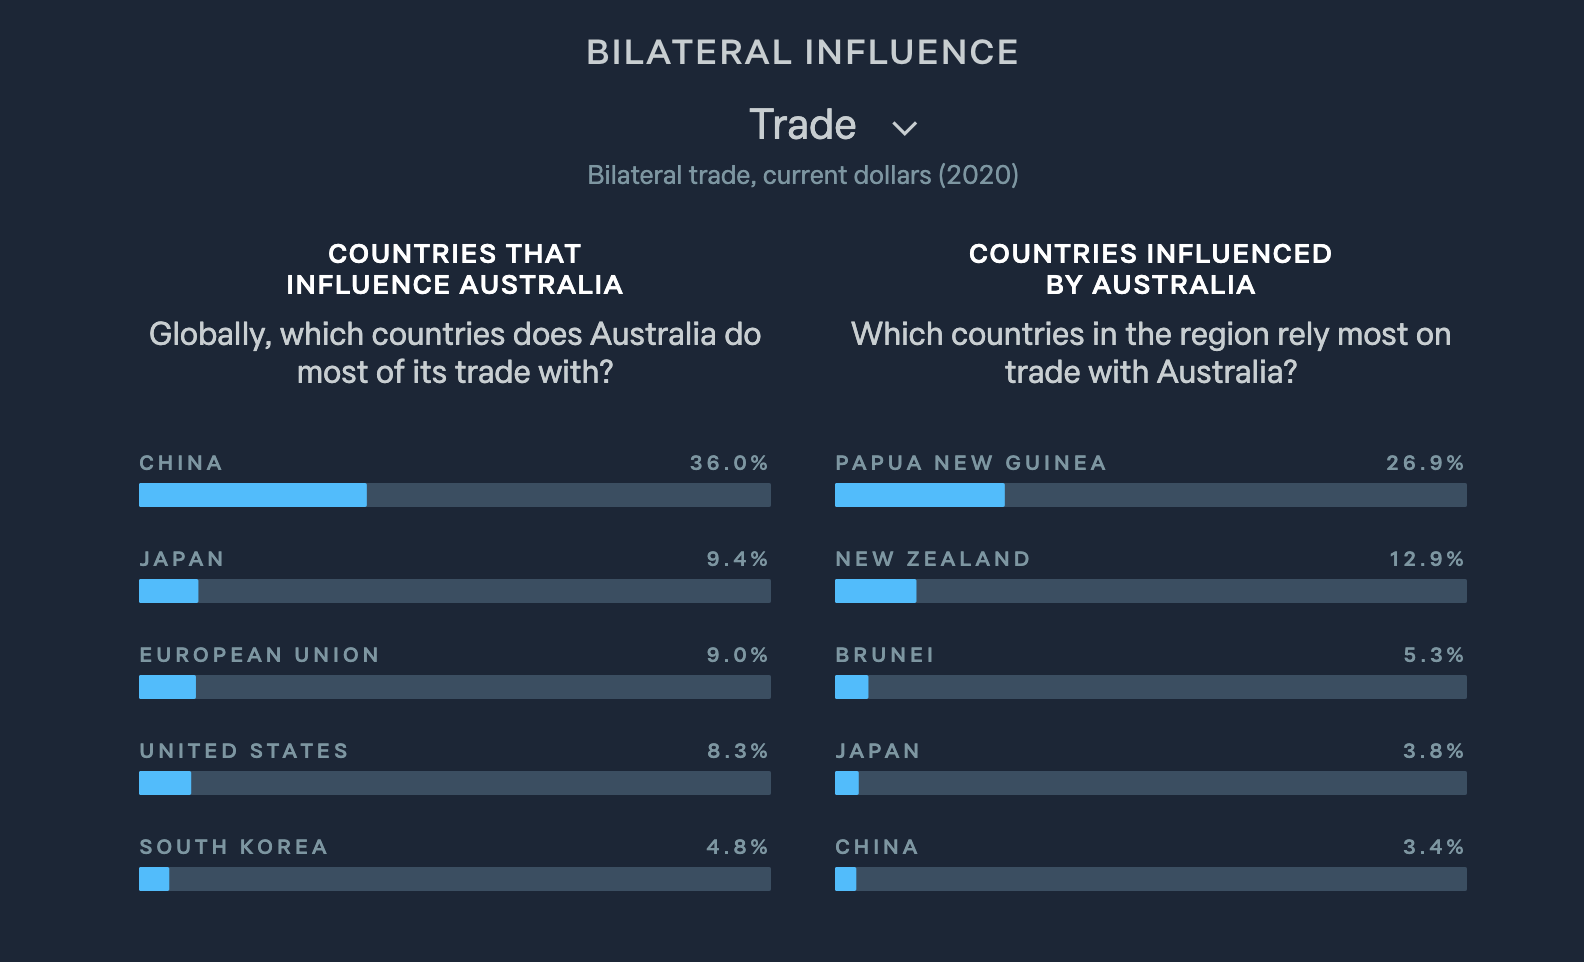
Asia Power Index
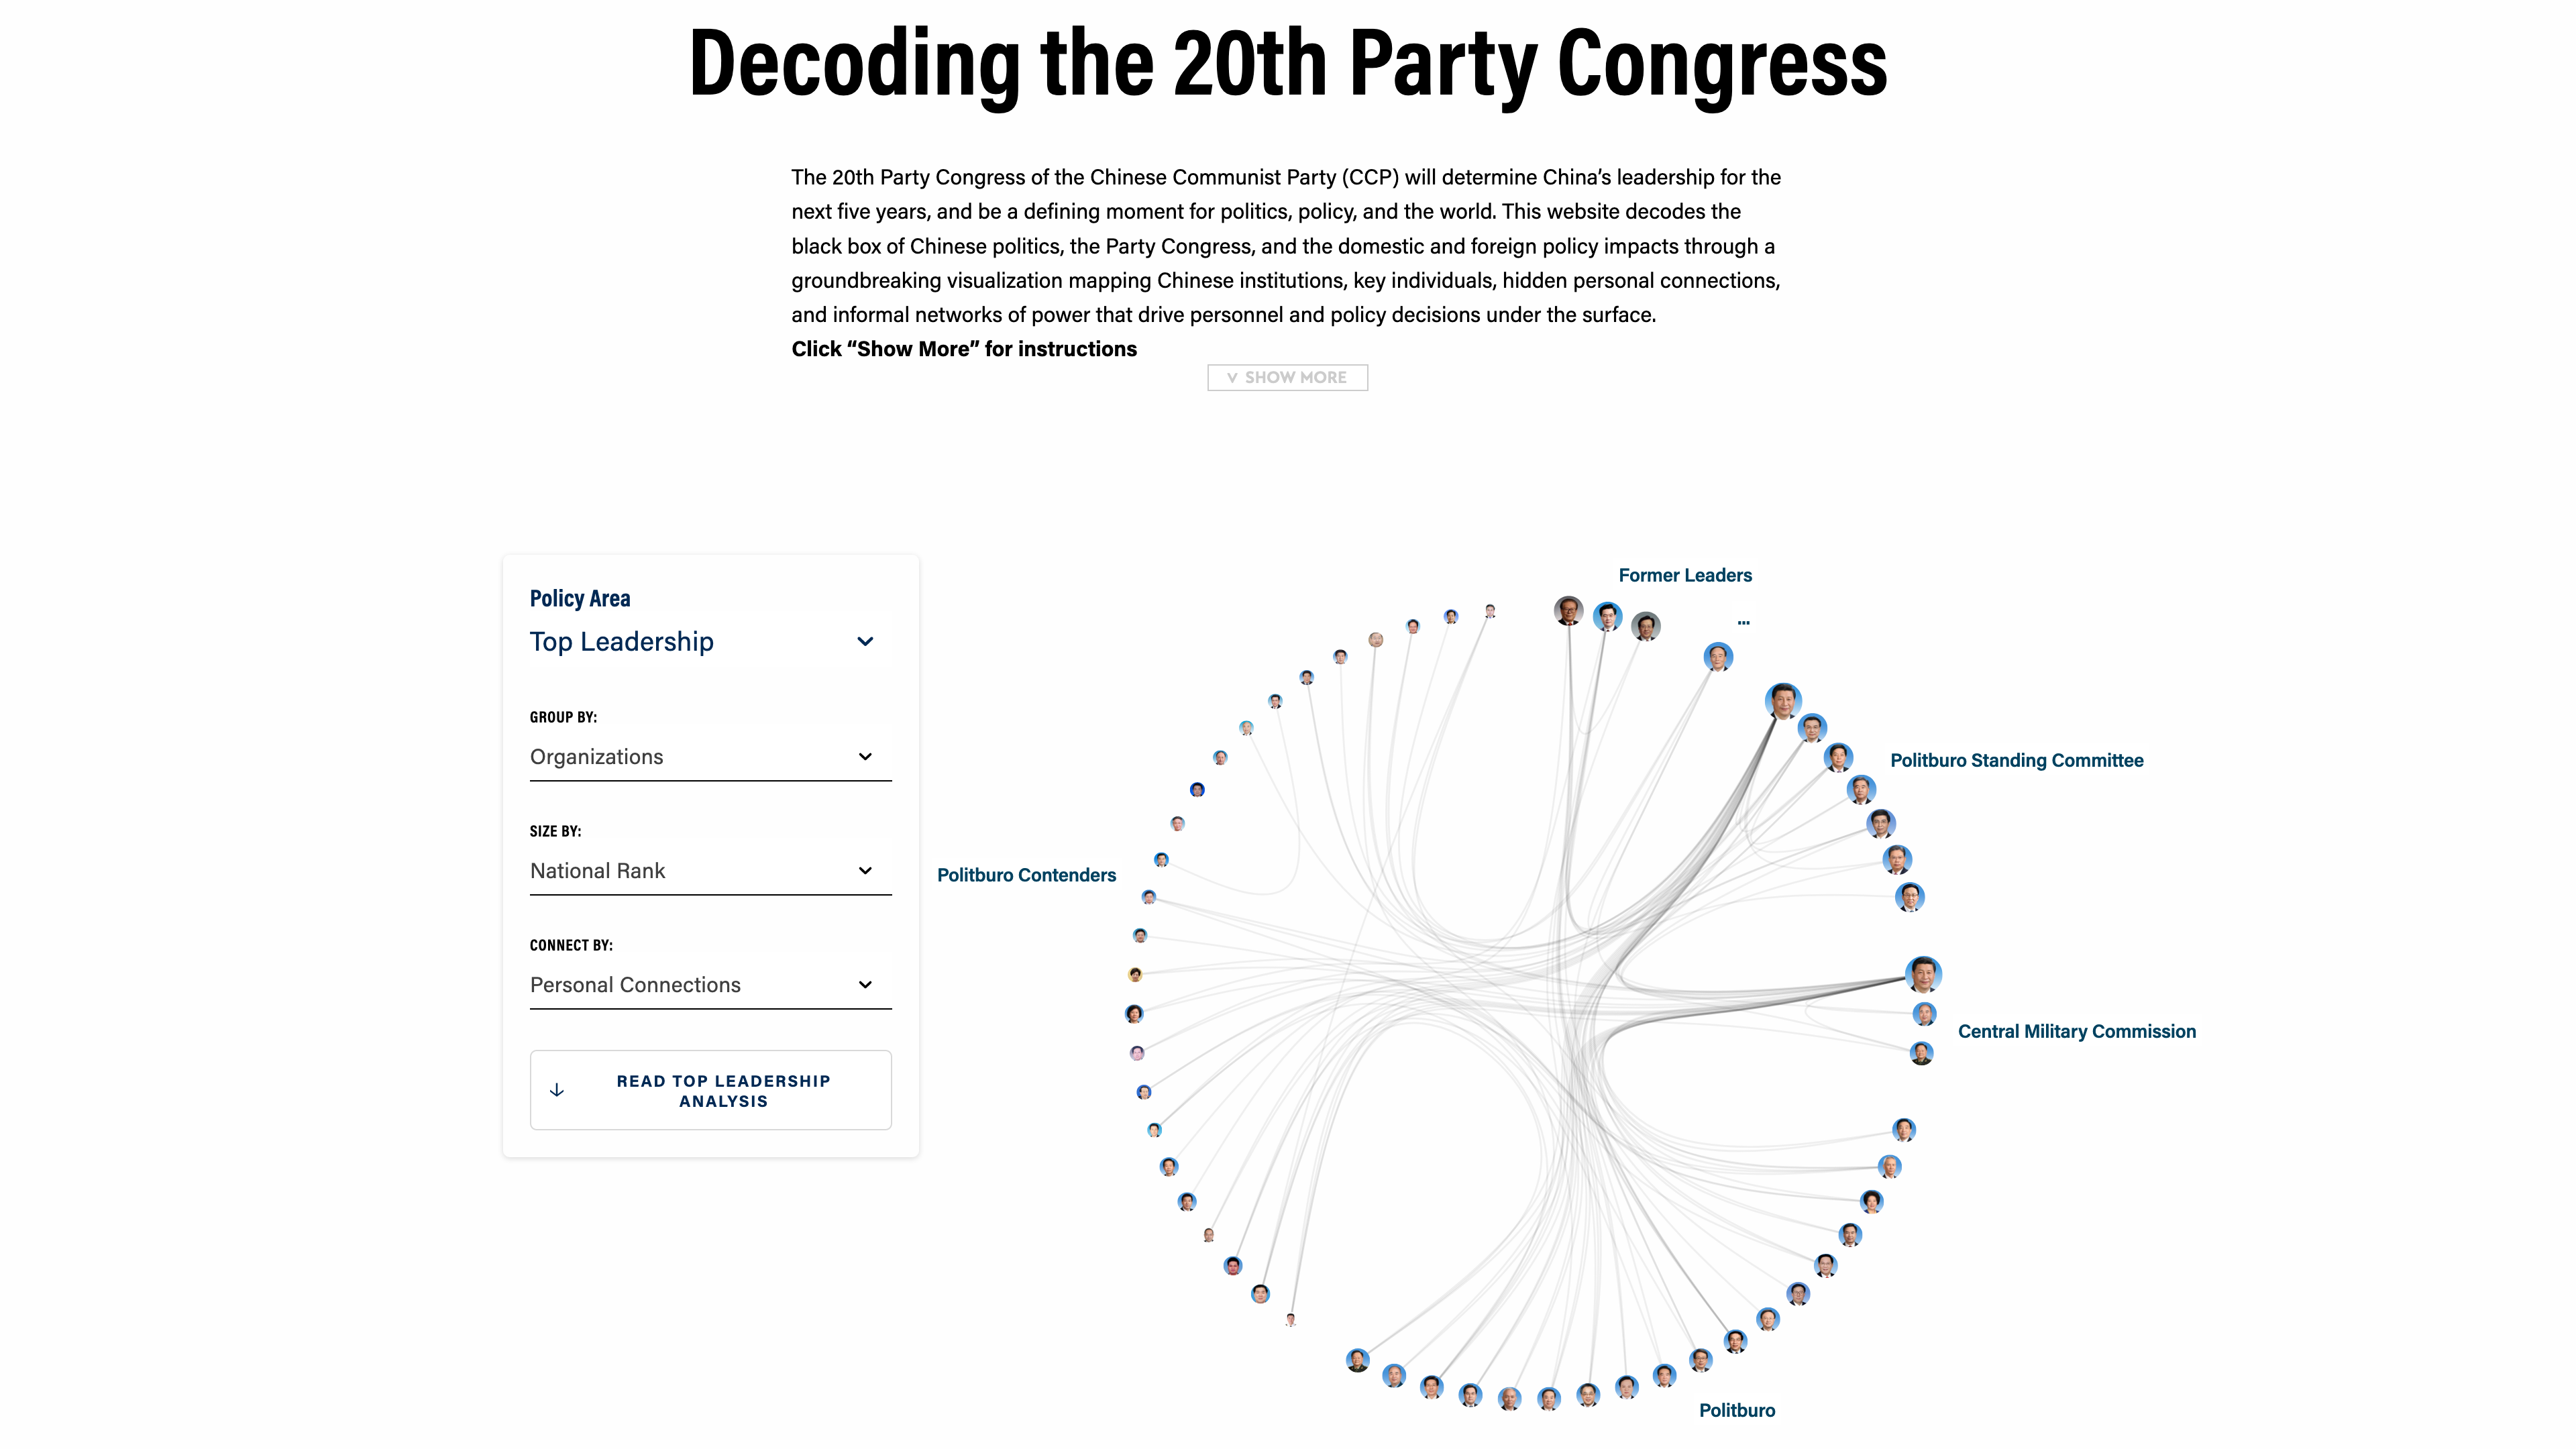
Asia Society 20th Century Congress
Asia Society

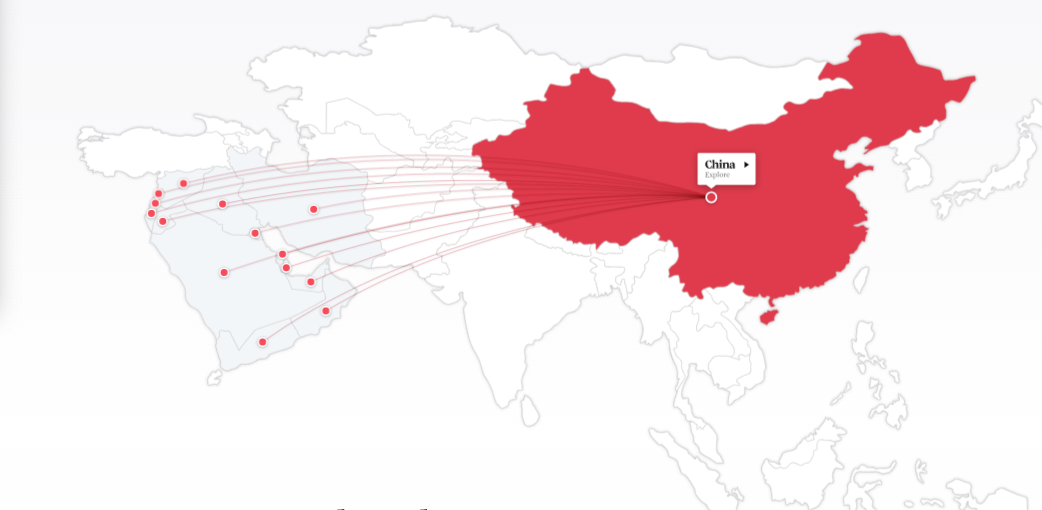
Asia Society BRI
Asia Society
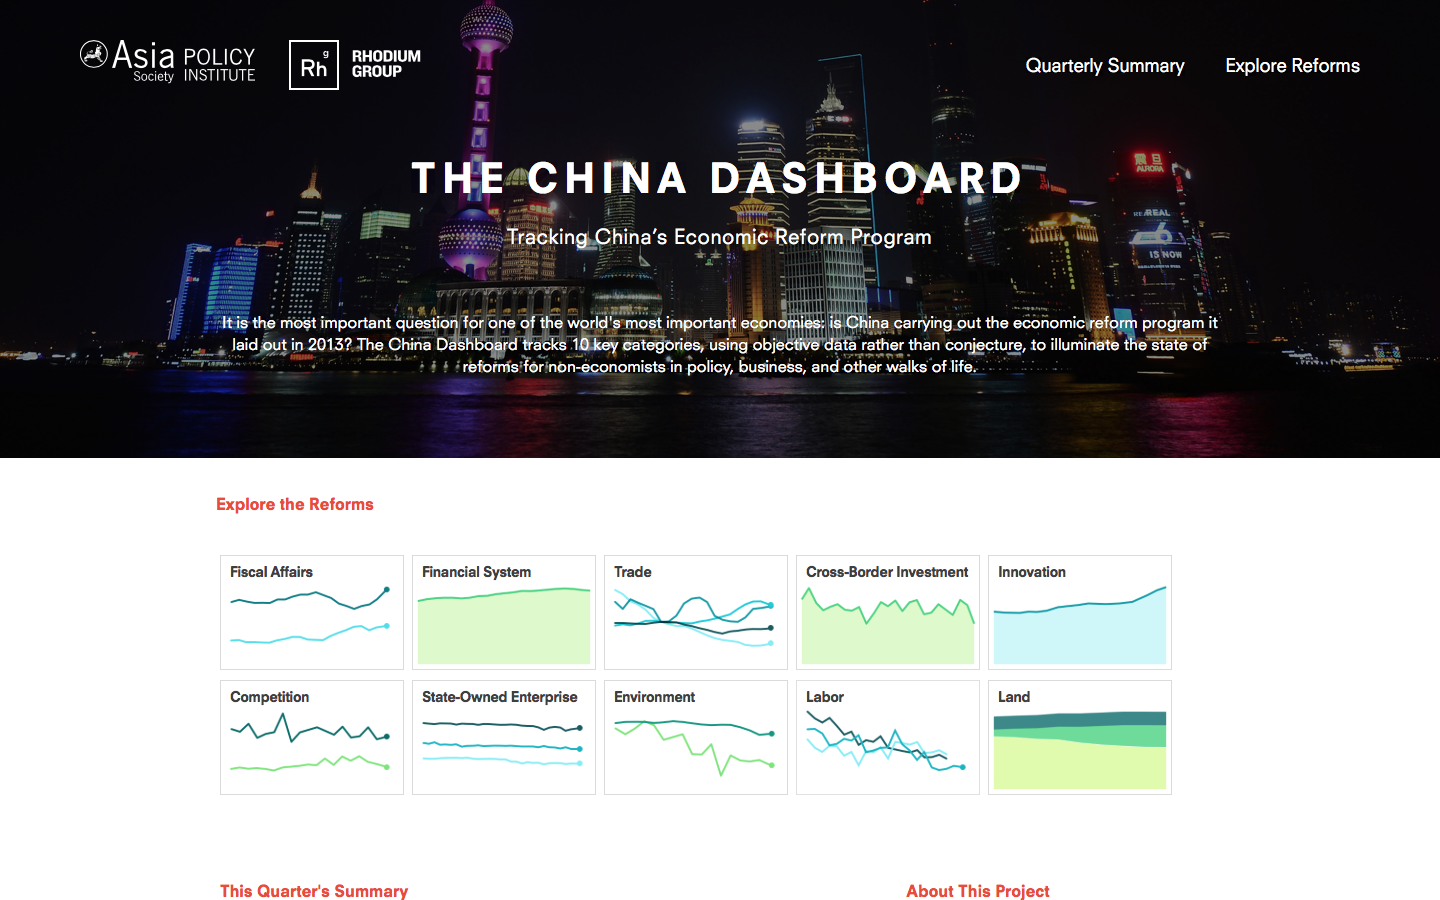
Asia Society: The China Dashboard
Asia’s New Pivot
Asia Society
Atlas of Sustainable Development Goals 2023
Schema Design
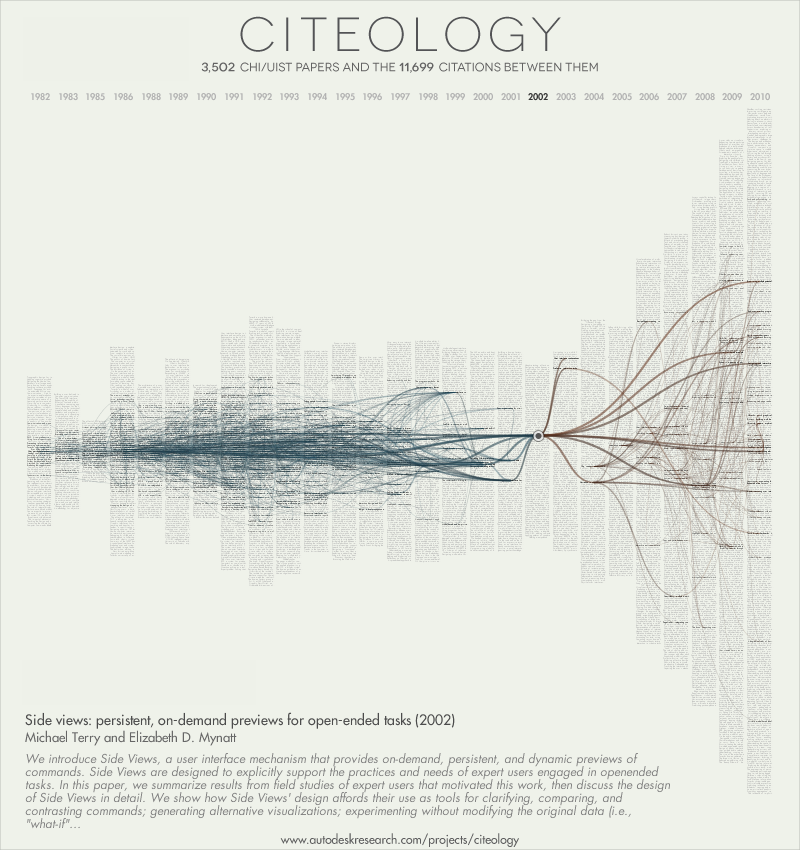
Autodesk Citeology
Autodesk Research
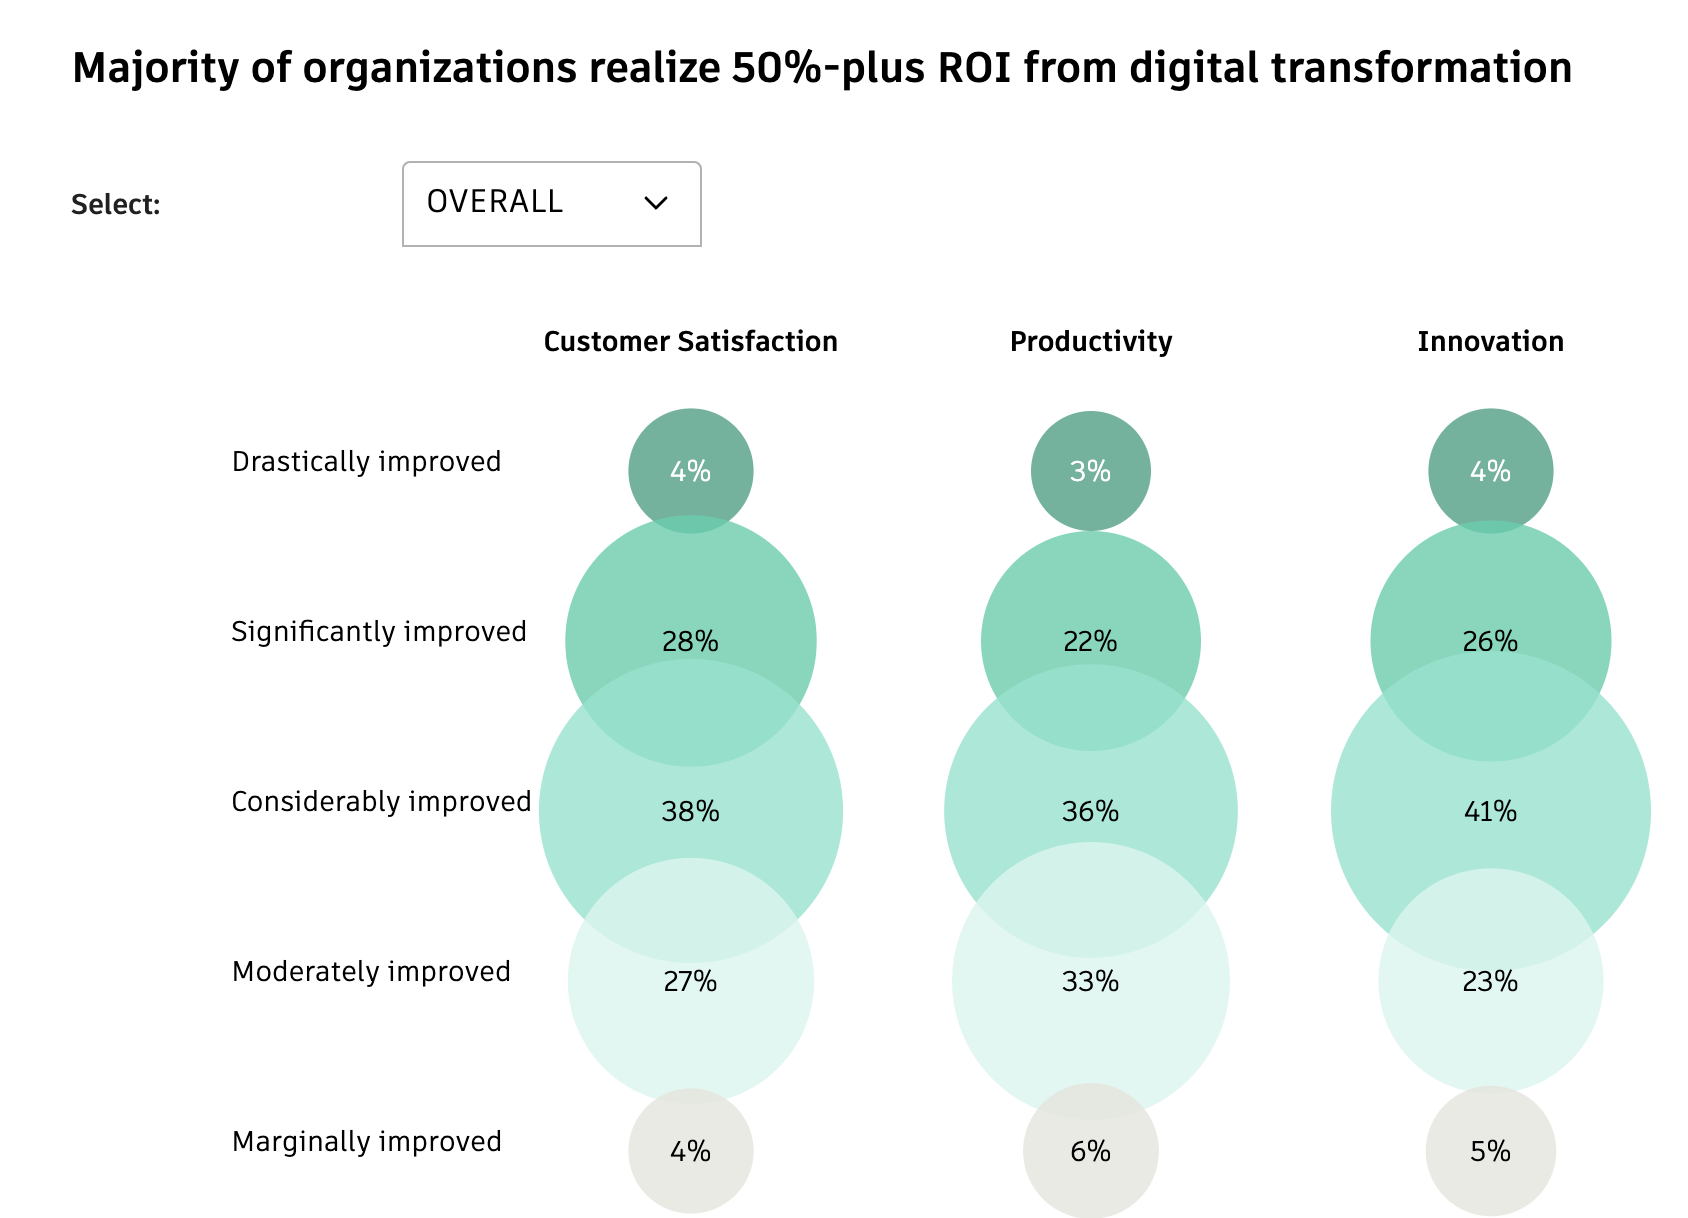
Autodesk State of Design & Make Report 2025
Autodesk
Awash in Grief
Reuters
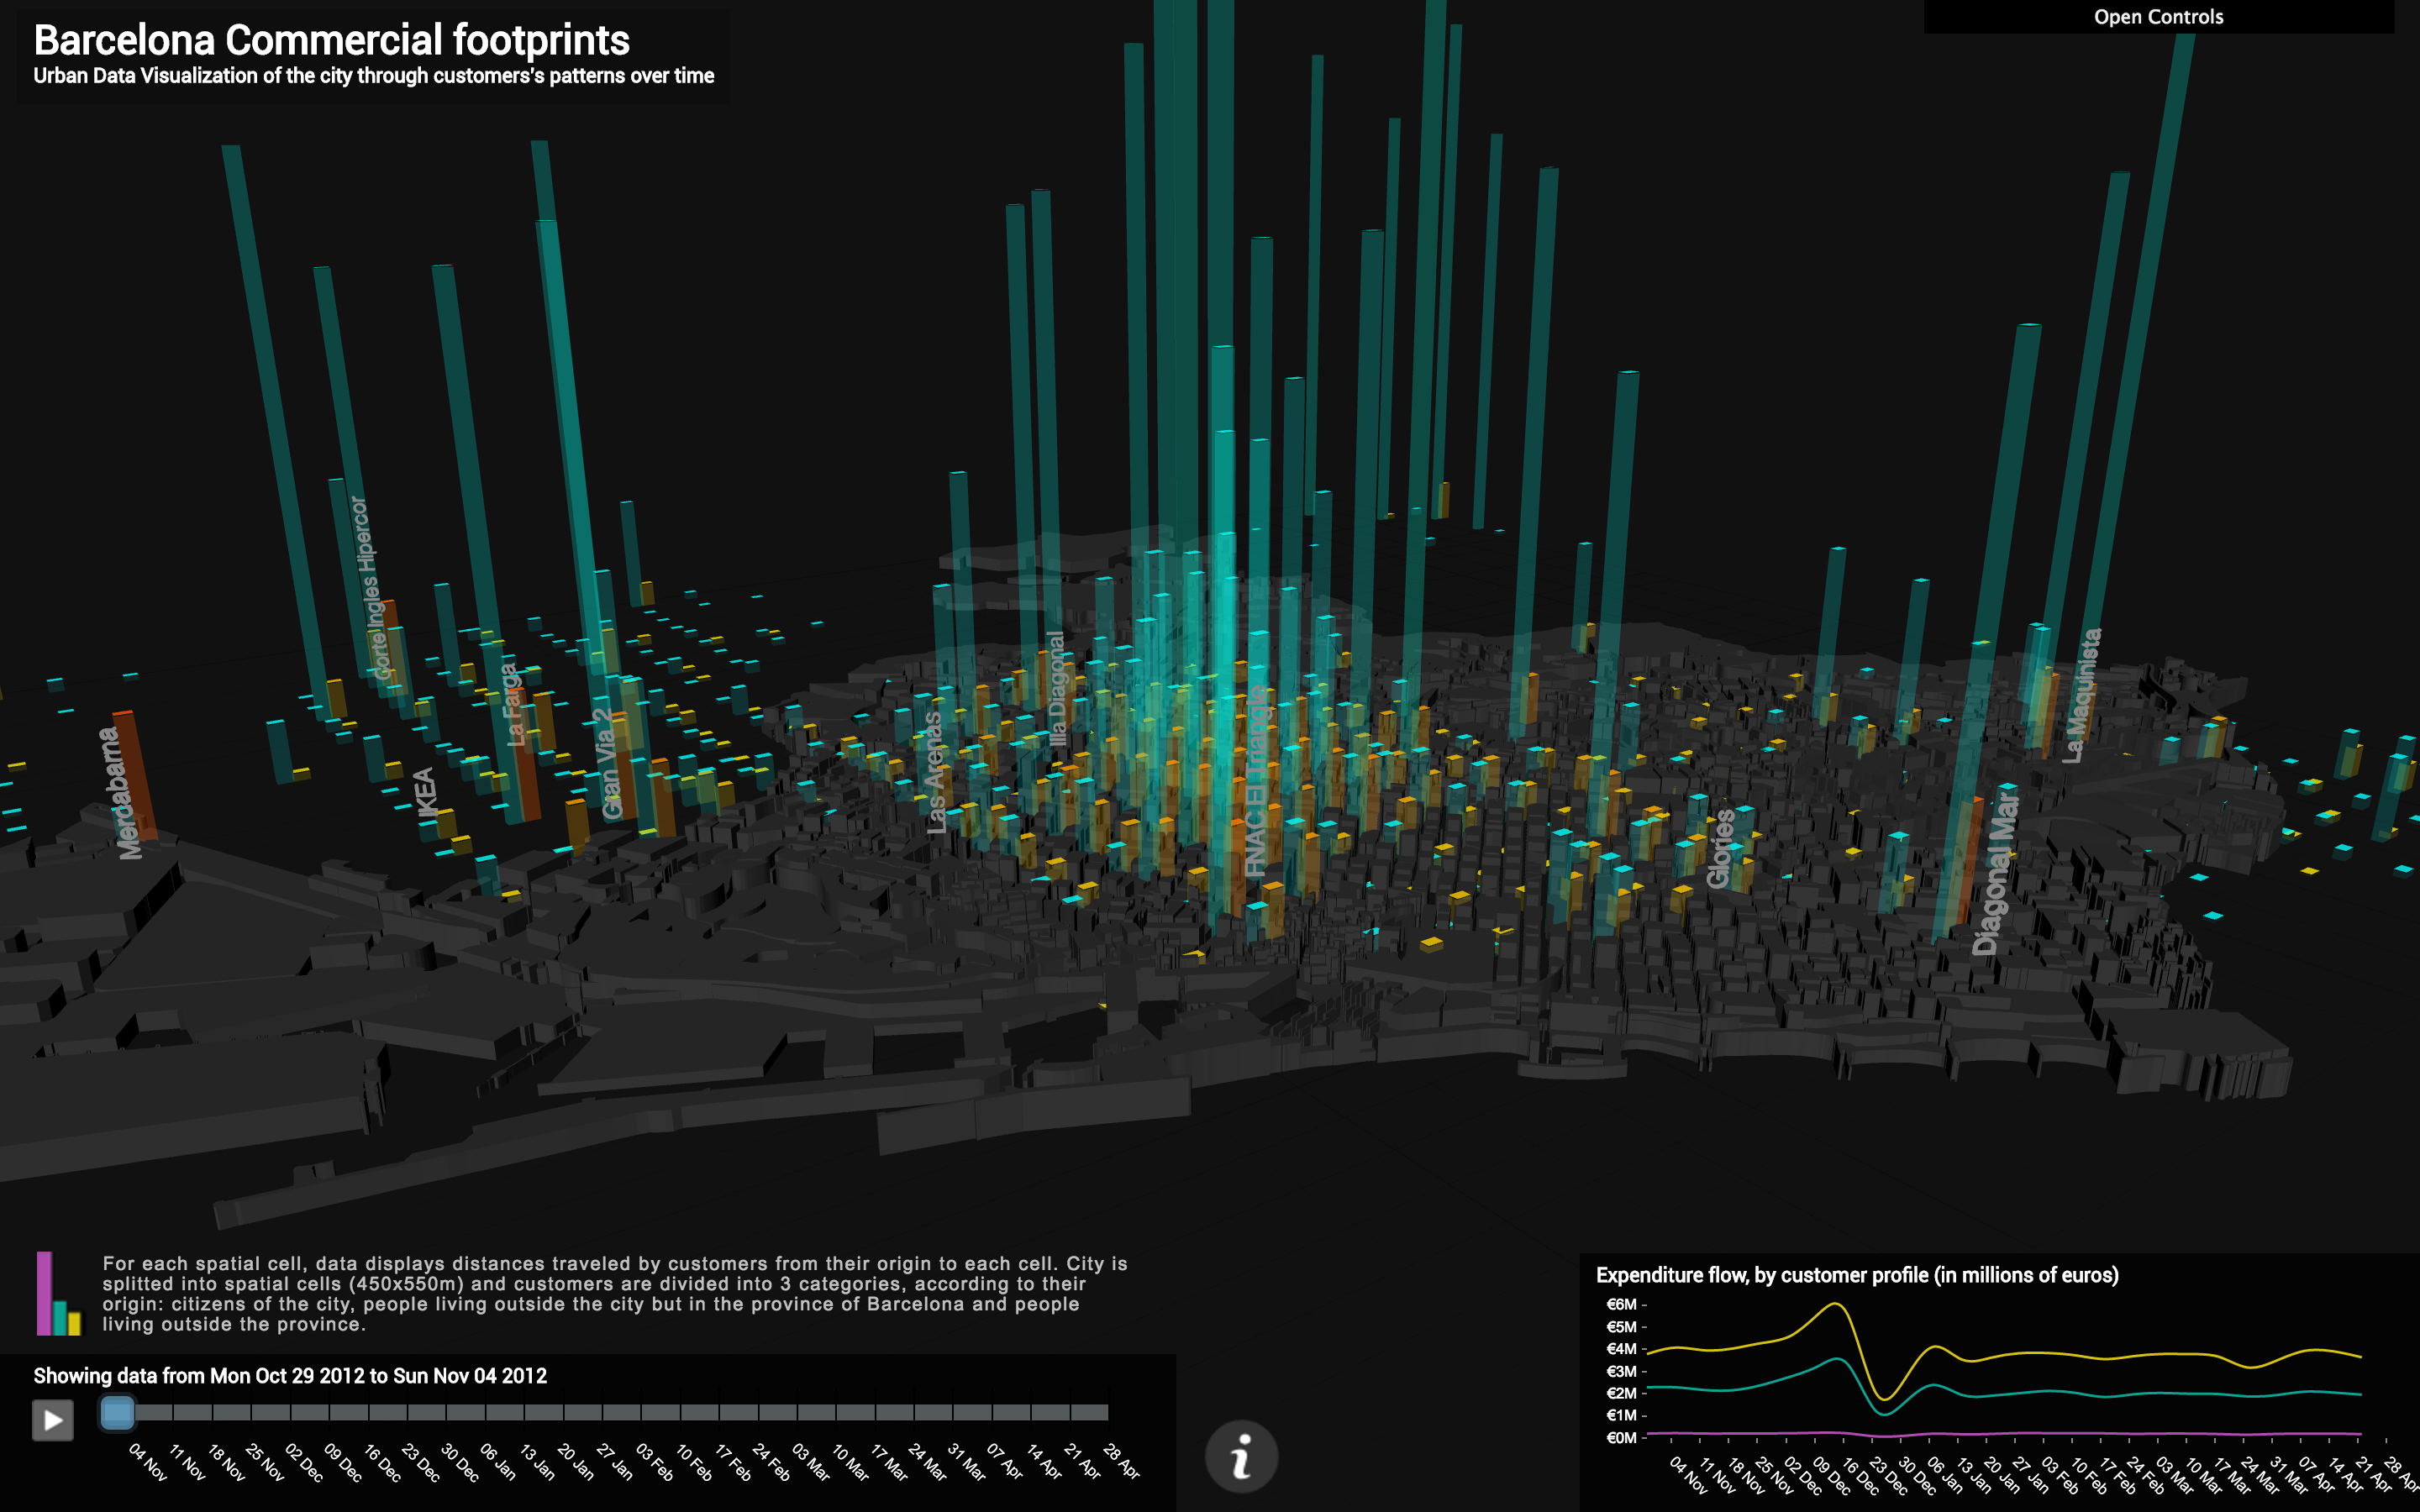
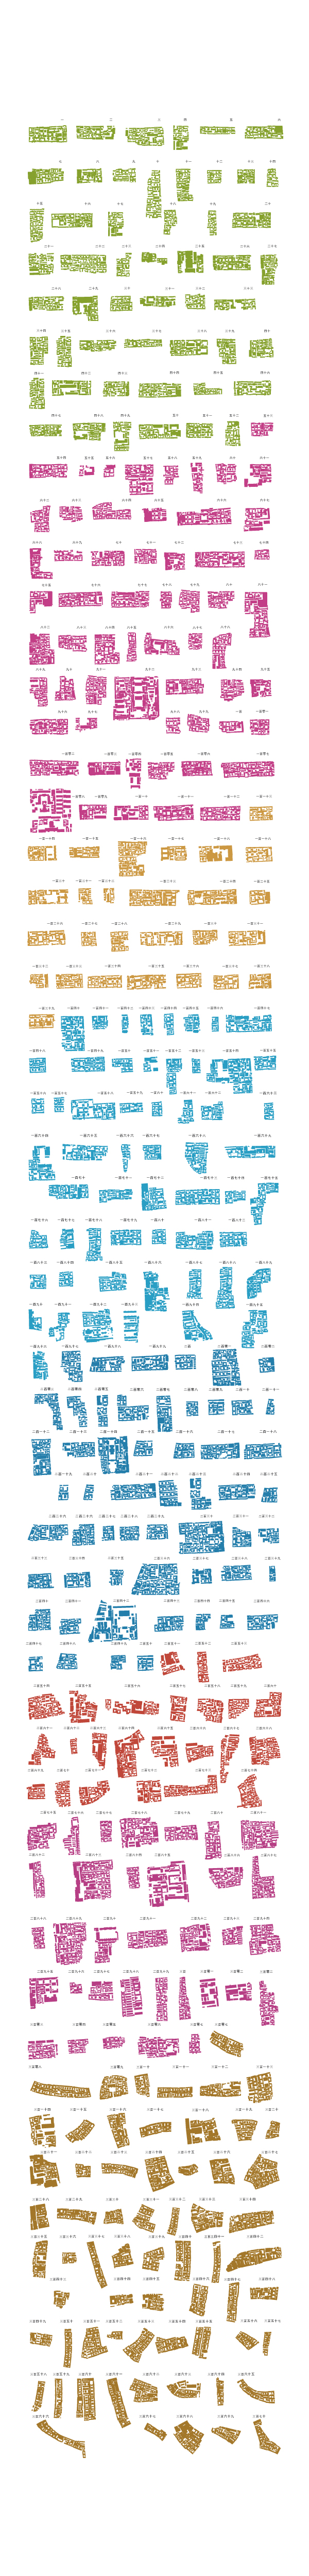
Barcelona Commercial Footprints
Xavi Gimenez
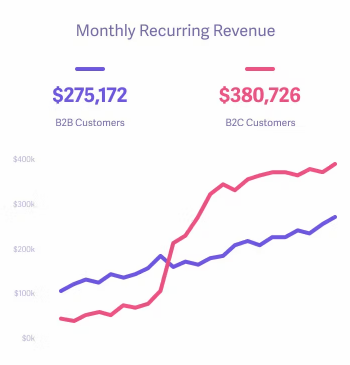
Baremetrics
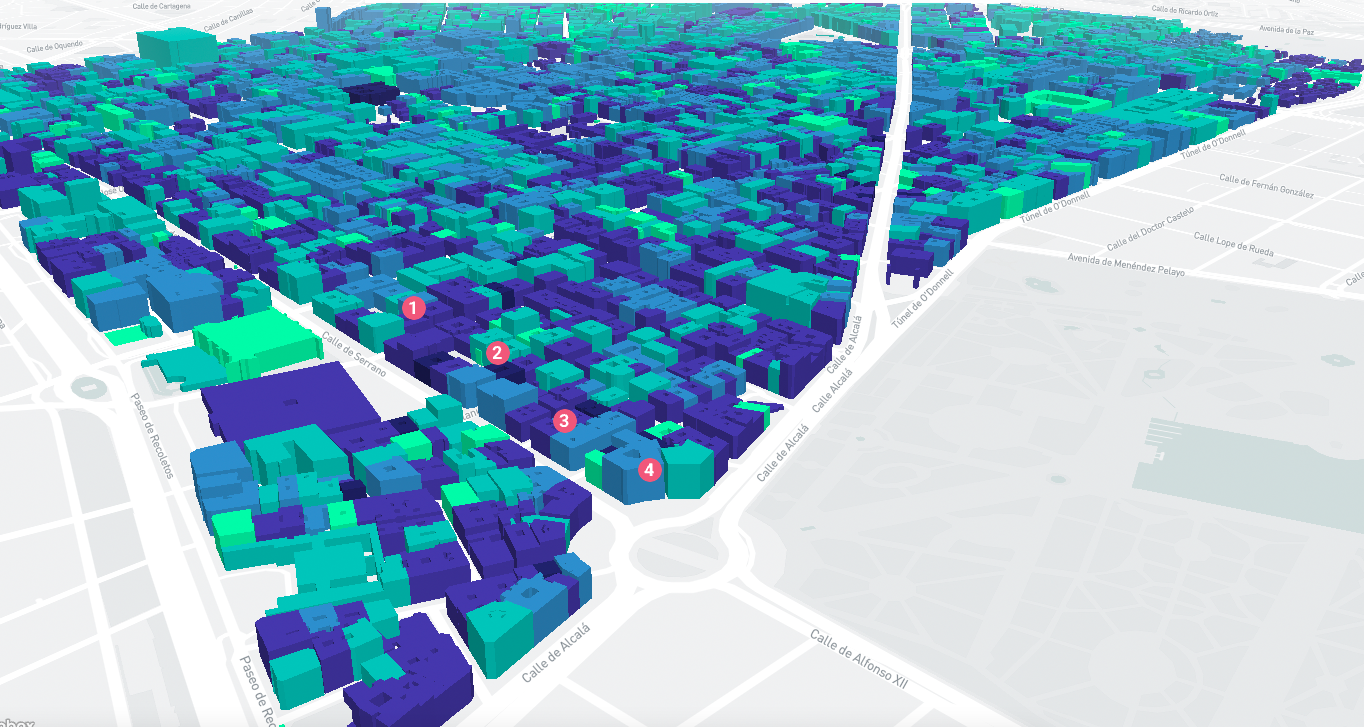
Barrio Salamanca
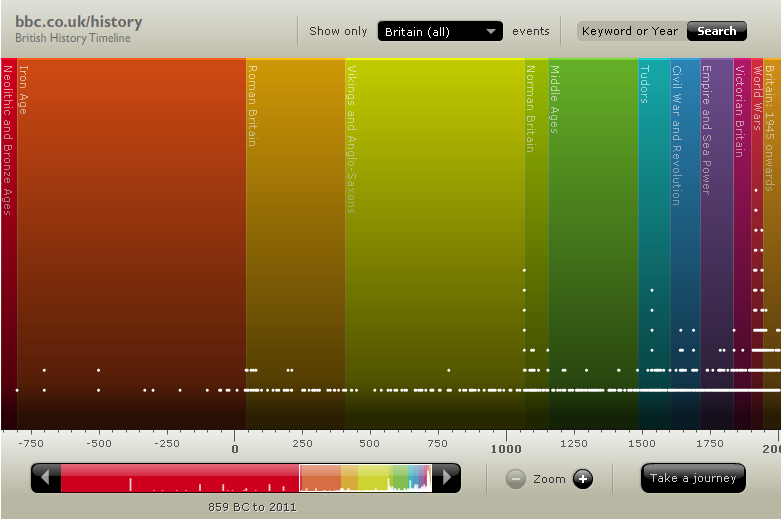
BBC History Timeline
BBC
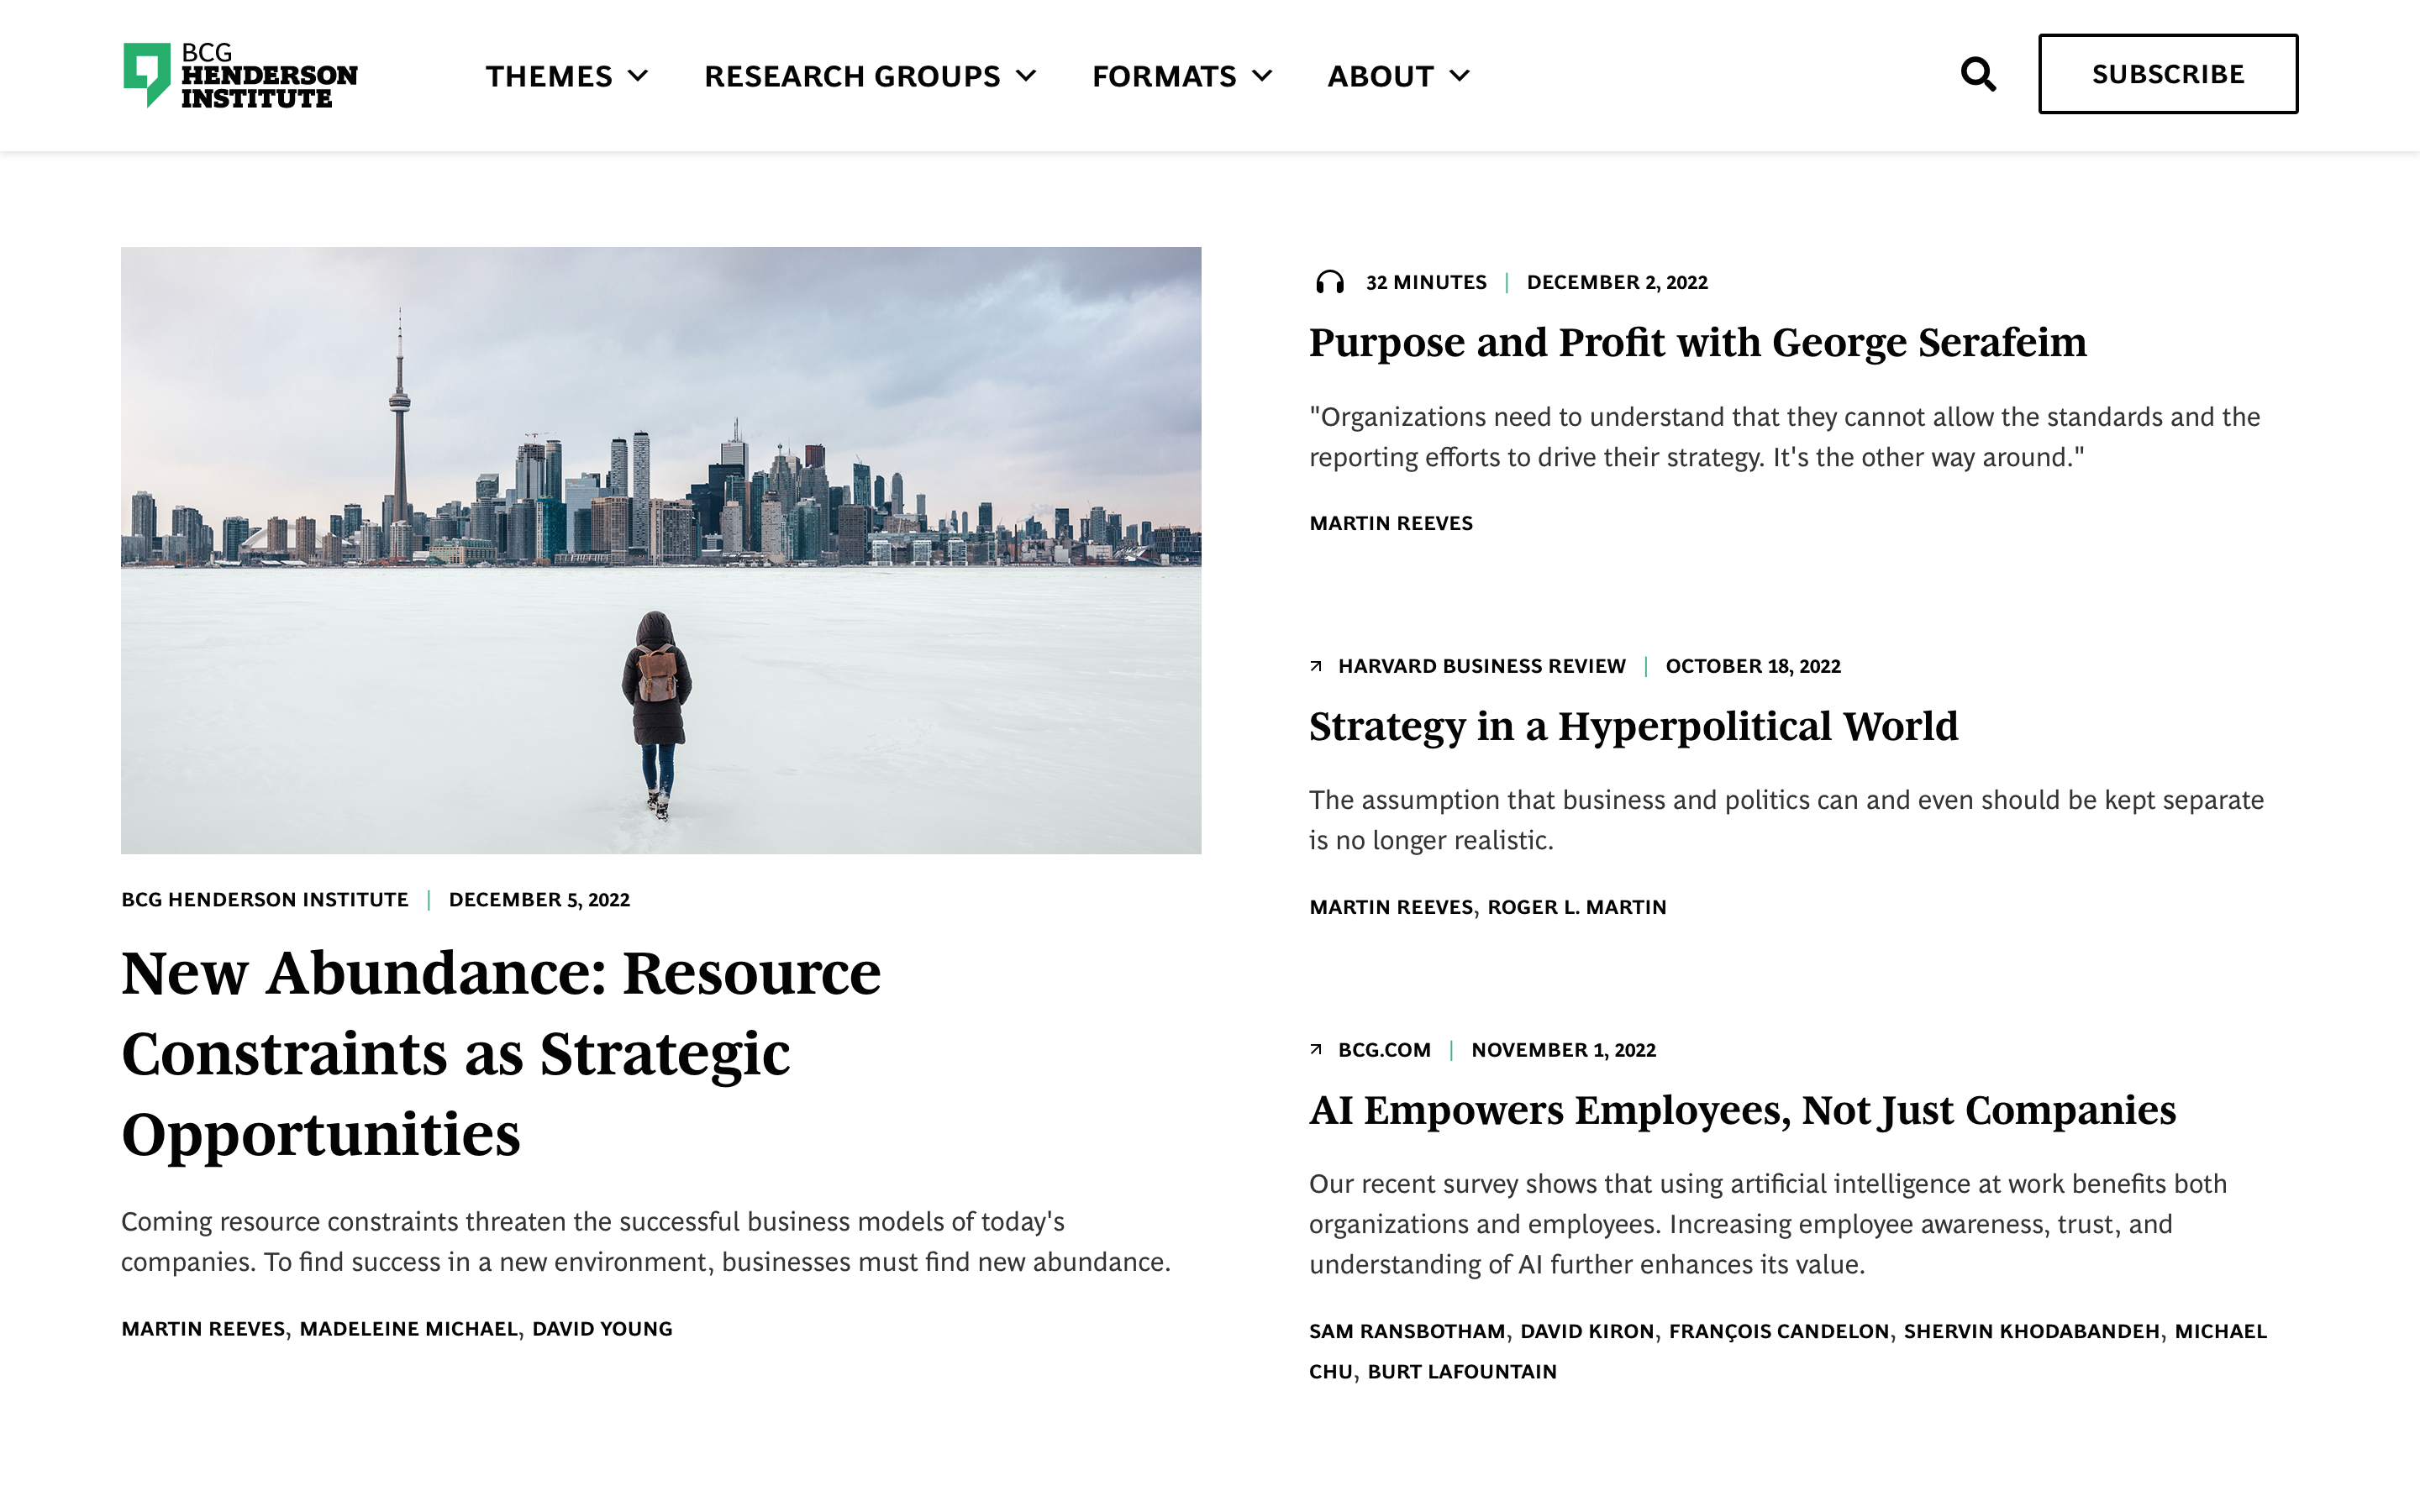
BCG Henderson Institute
Schema Design
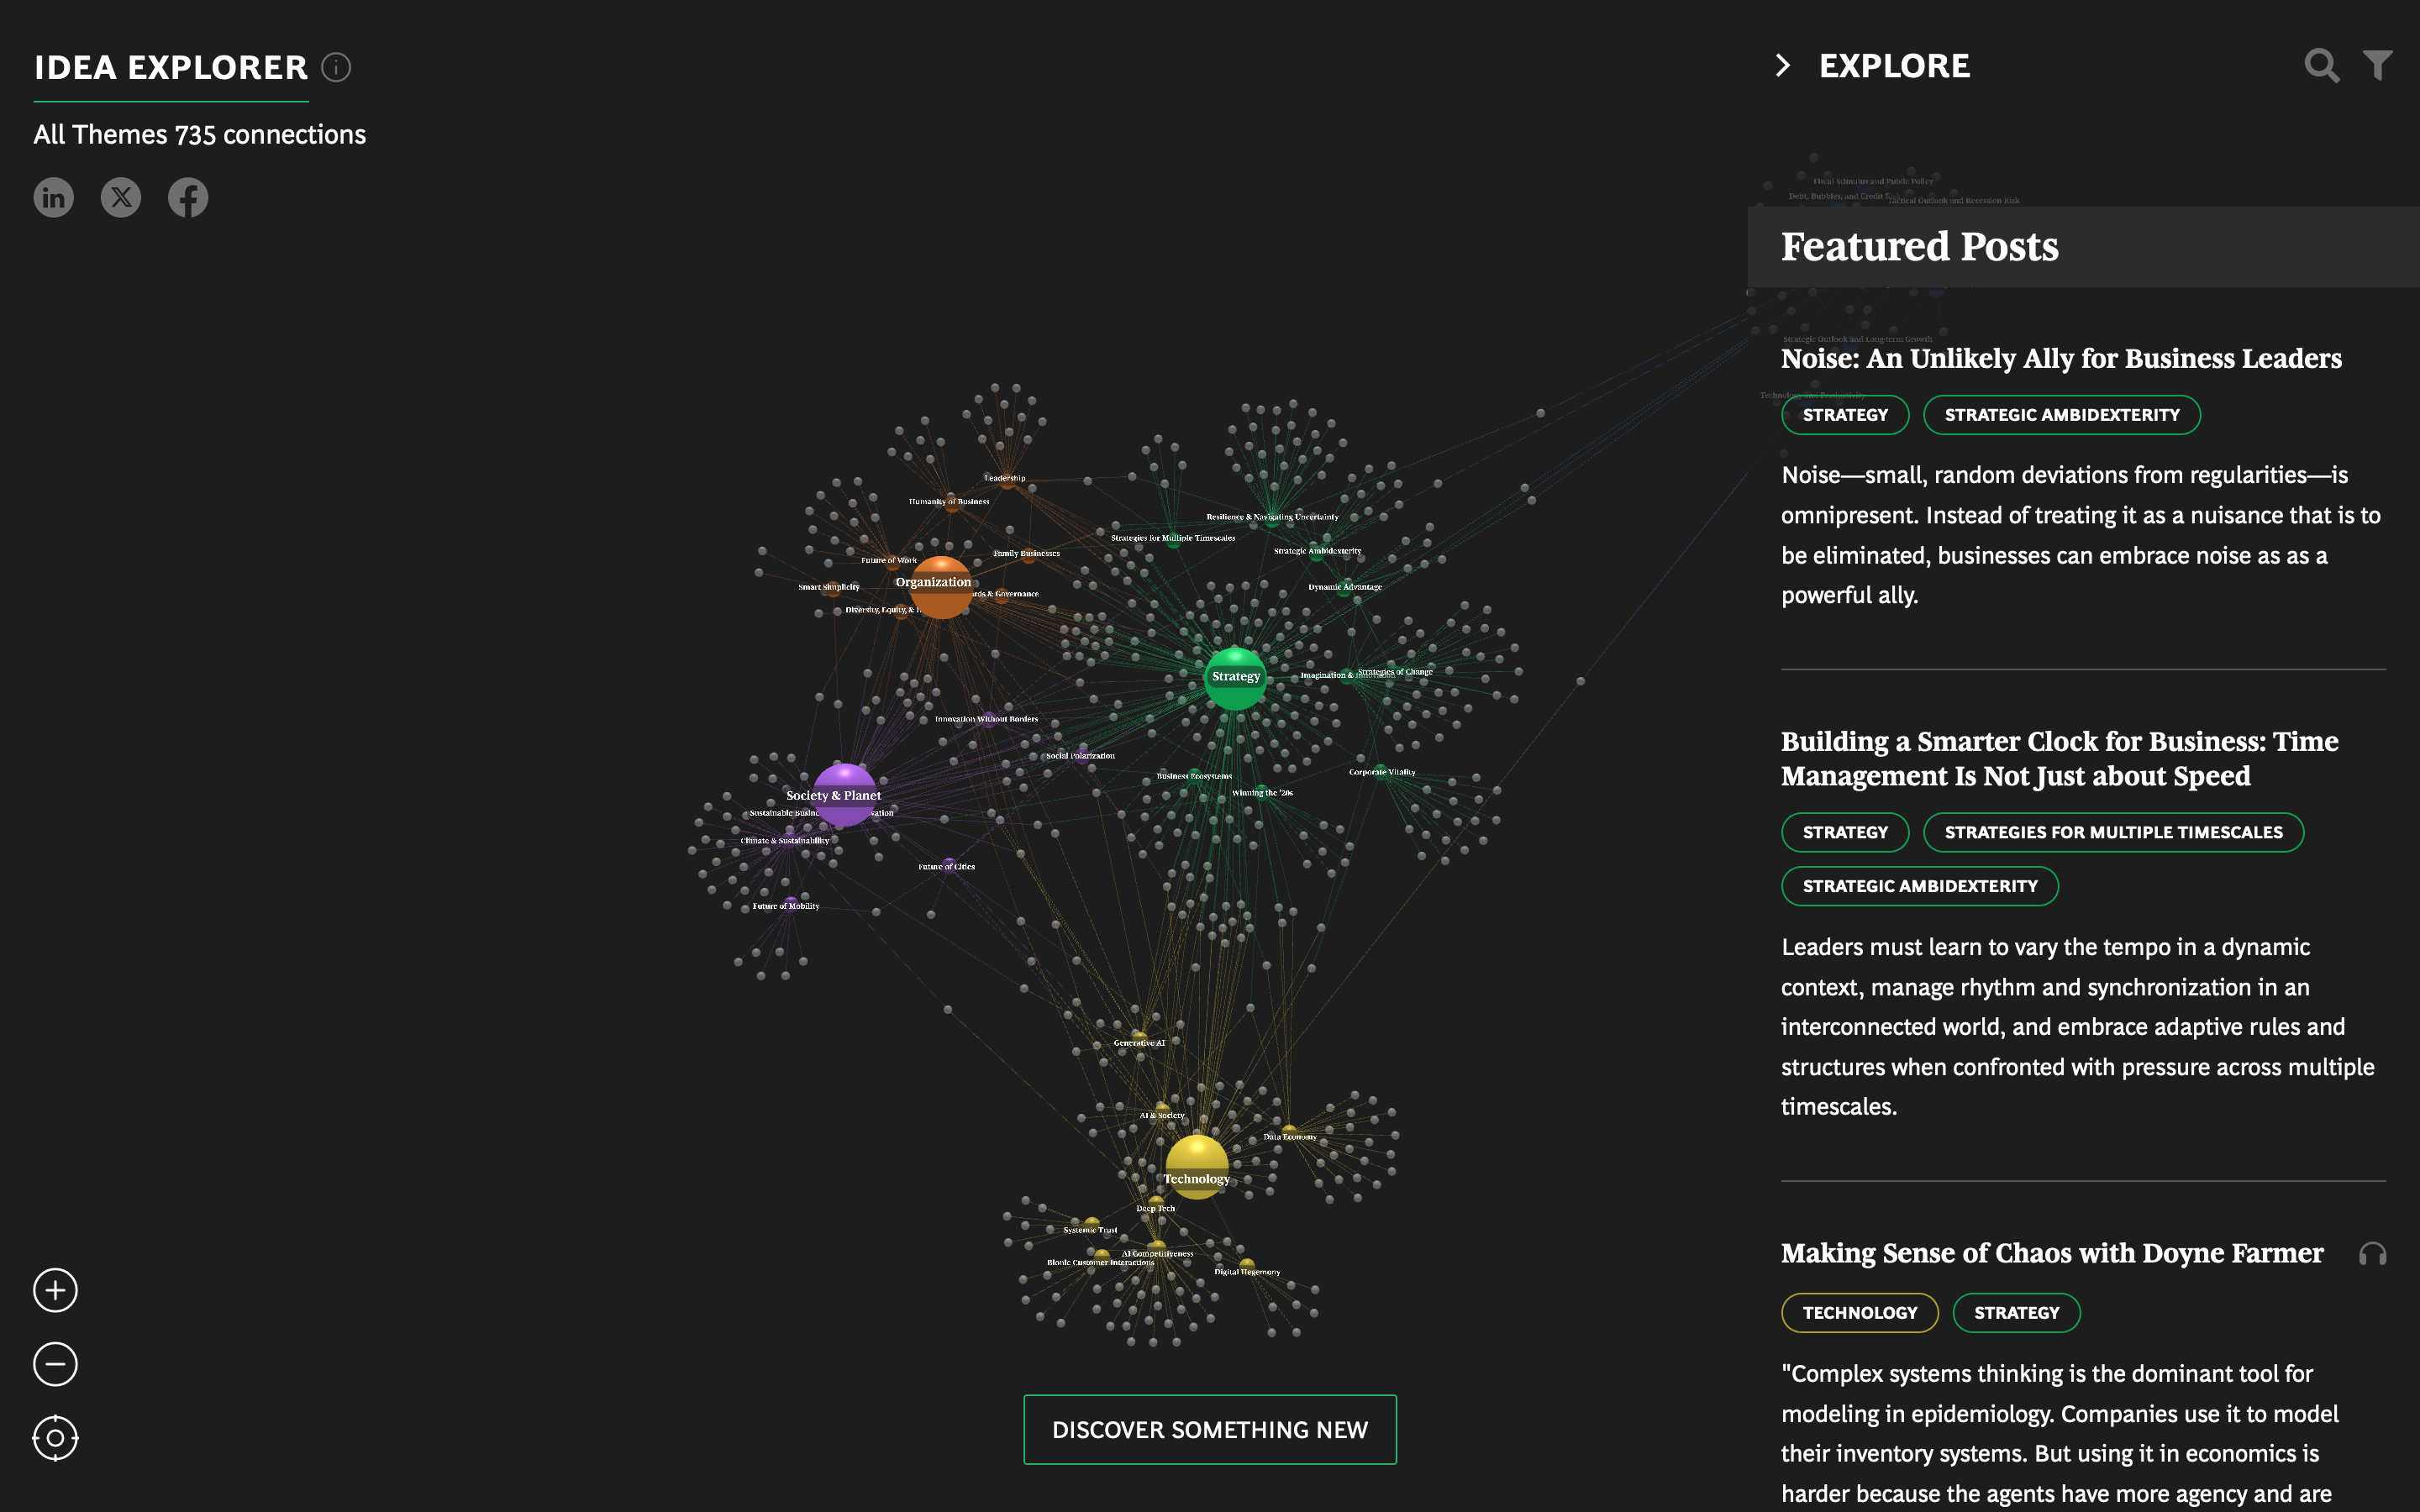
BCG Idea Explorer
Schema Design
Beck London Underground Map
Harry Beck
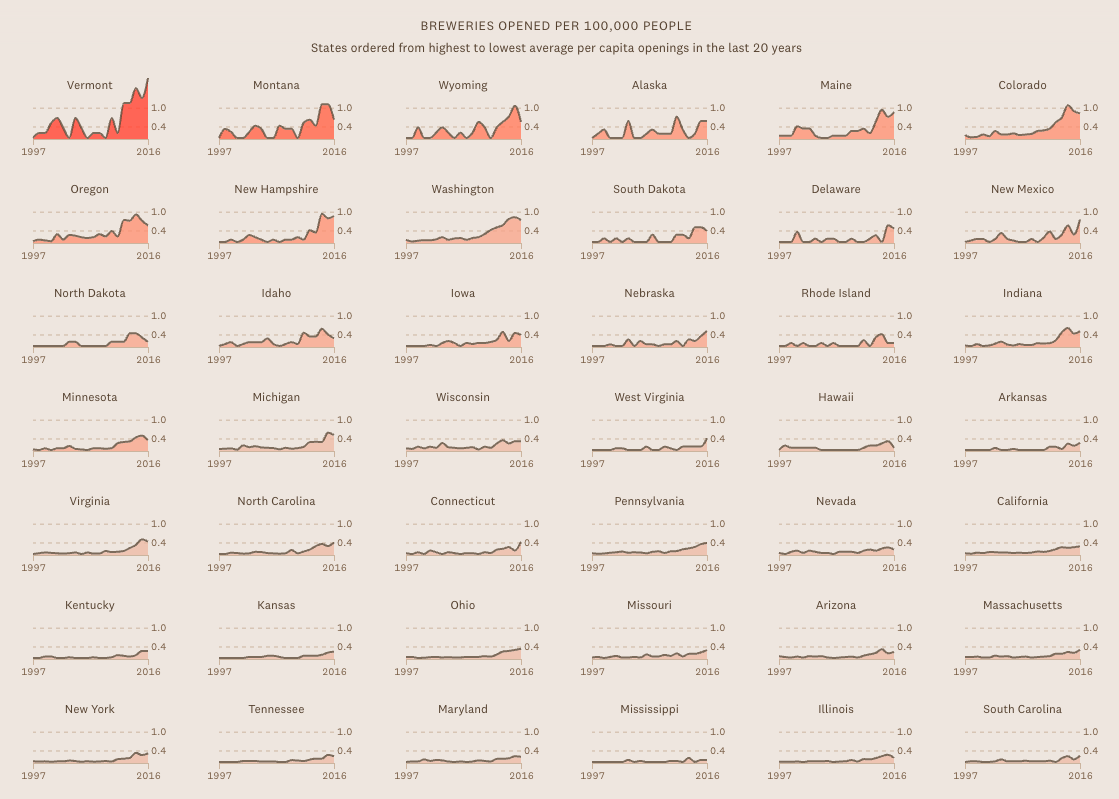
Beer Capitol
Pudding

Belmont CourageWall
Belmont
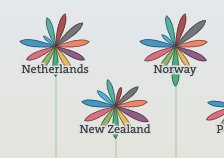
Better Life Index
OECD Better Life Index

Betting on a Winner
ABC News
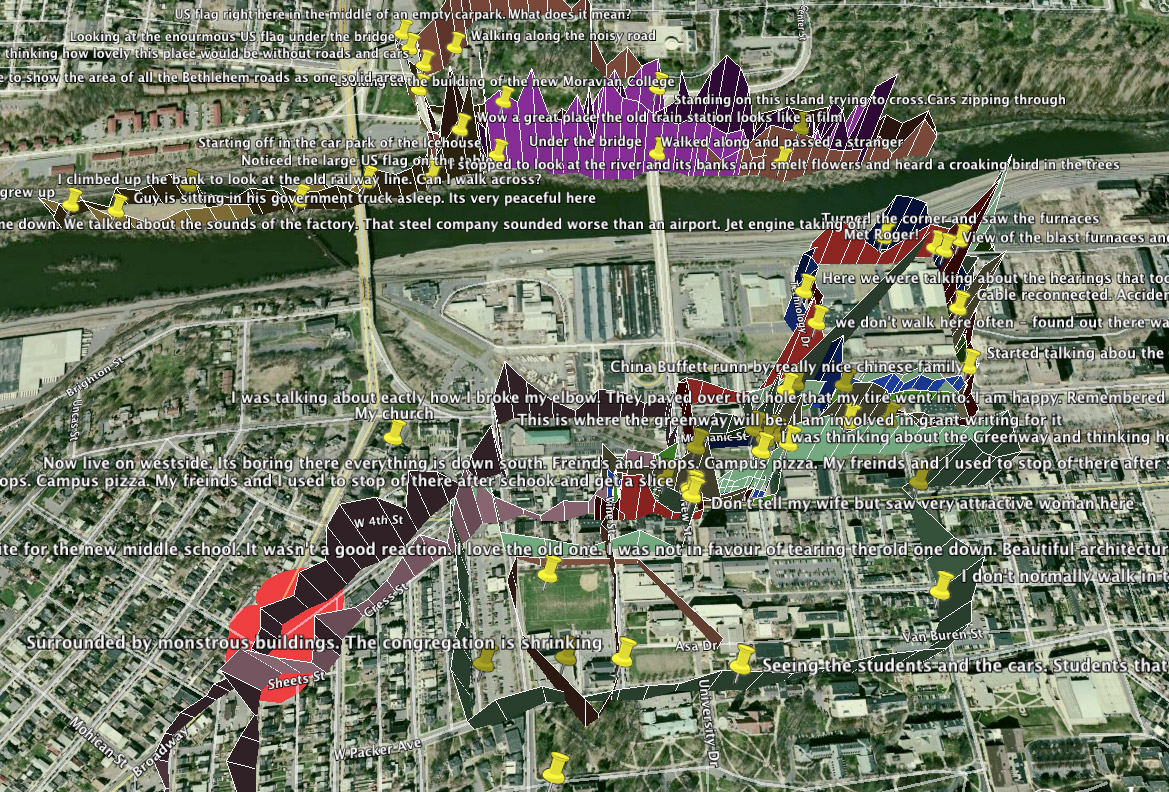
Bio Mapping
Christian Nold
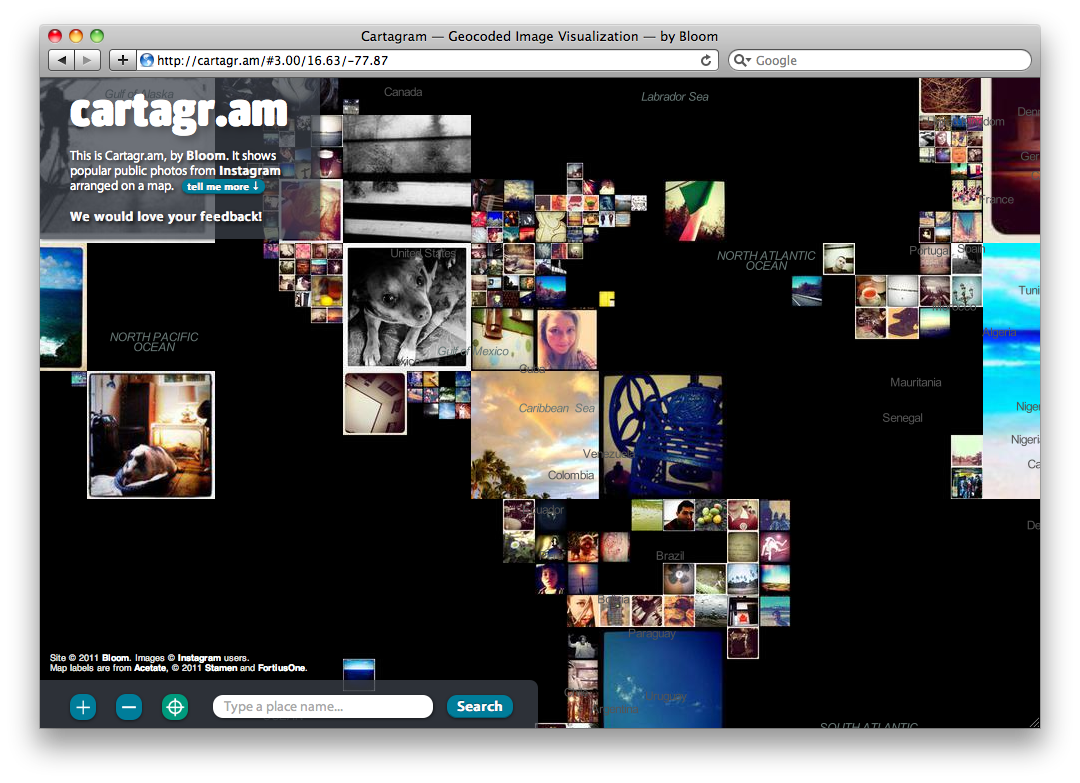
Bloom Cartagram
Bloom
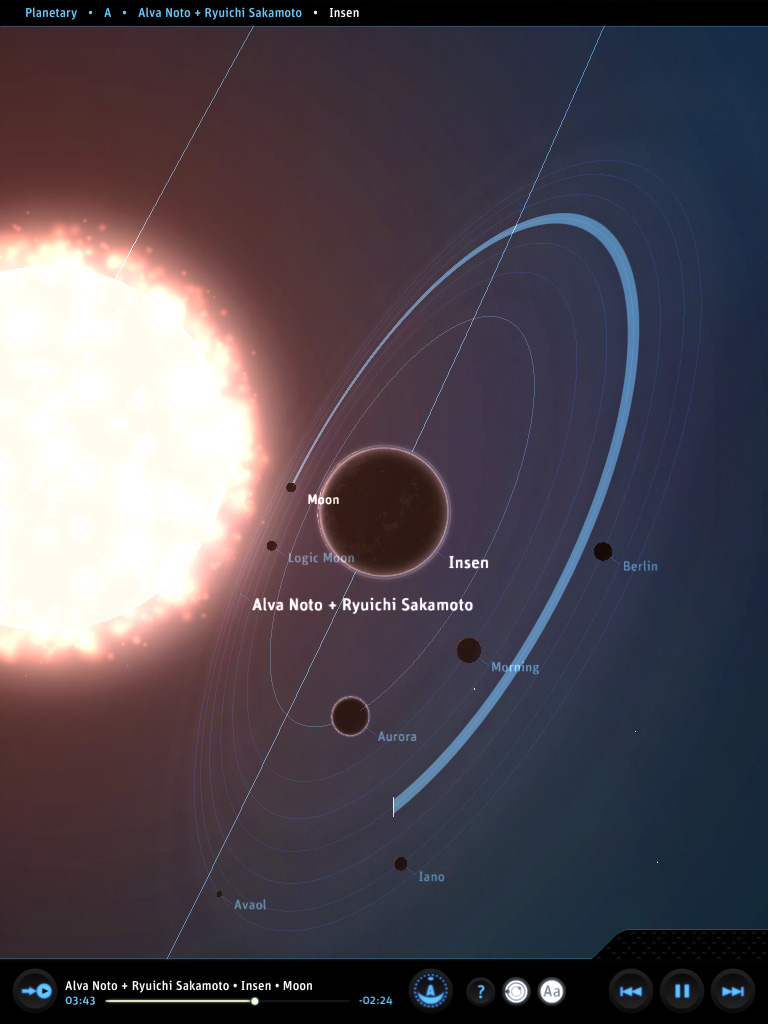
Bloom Planetary
Bloom
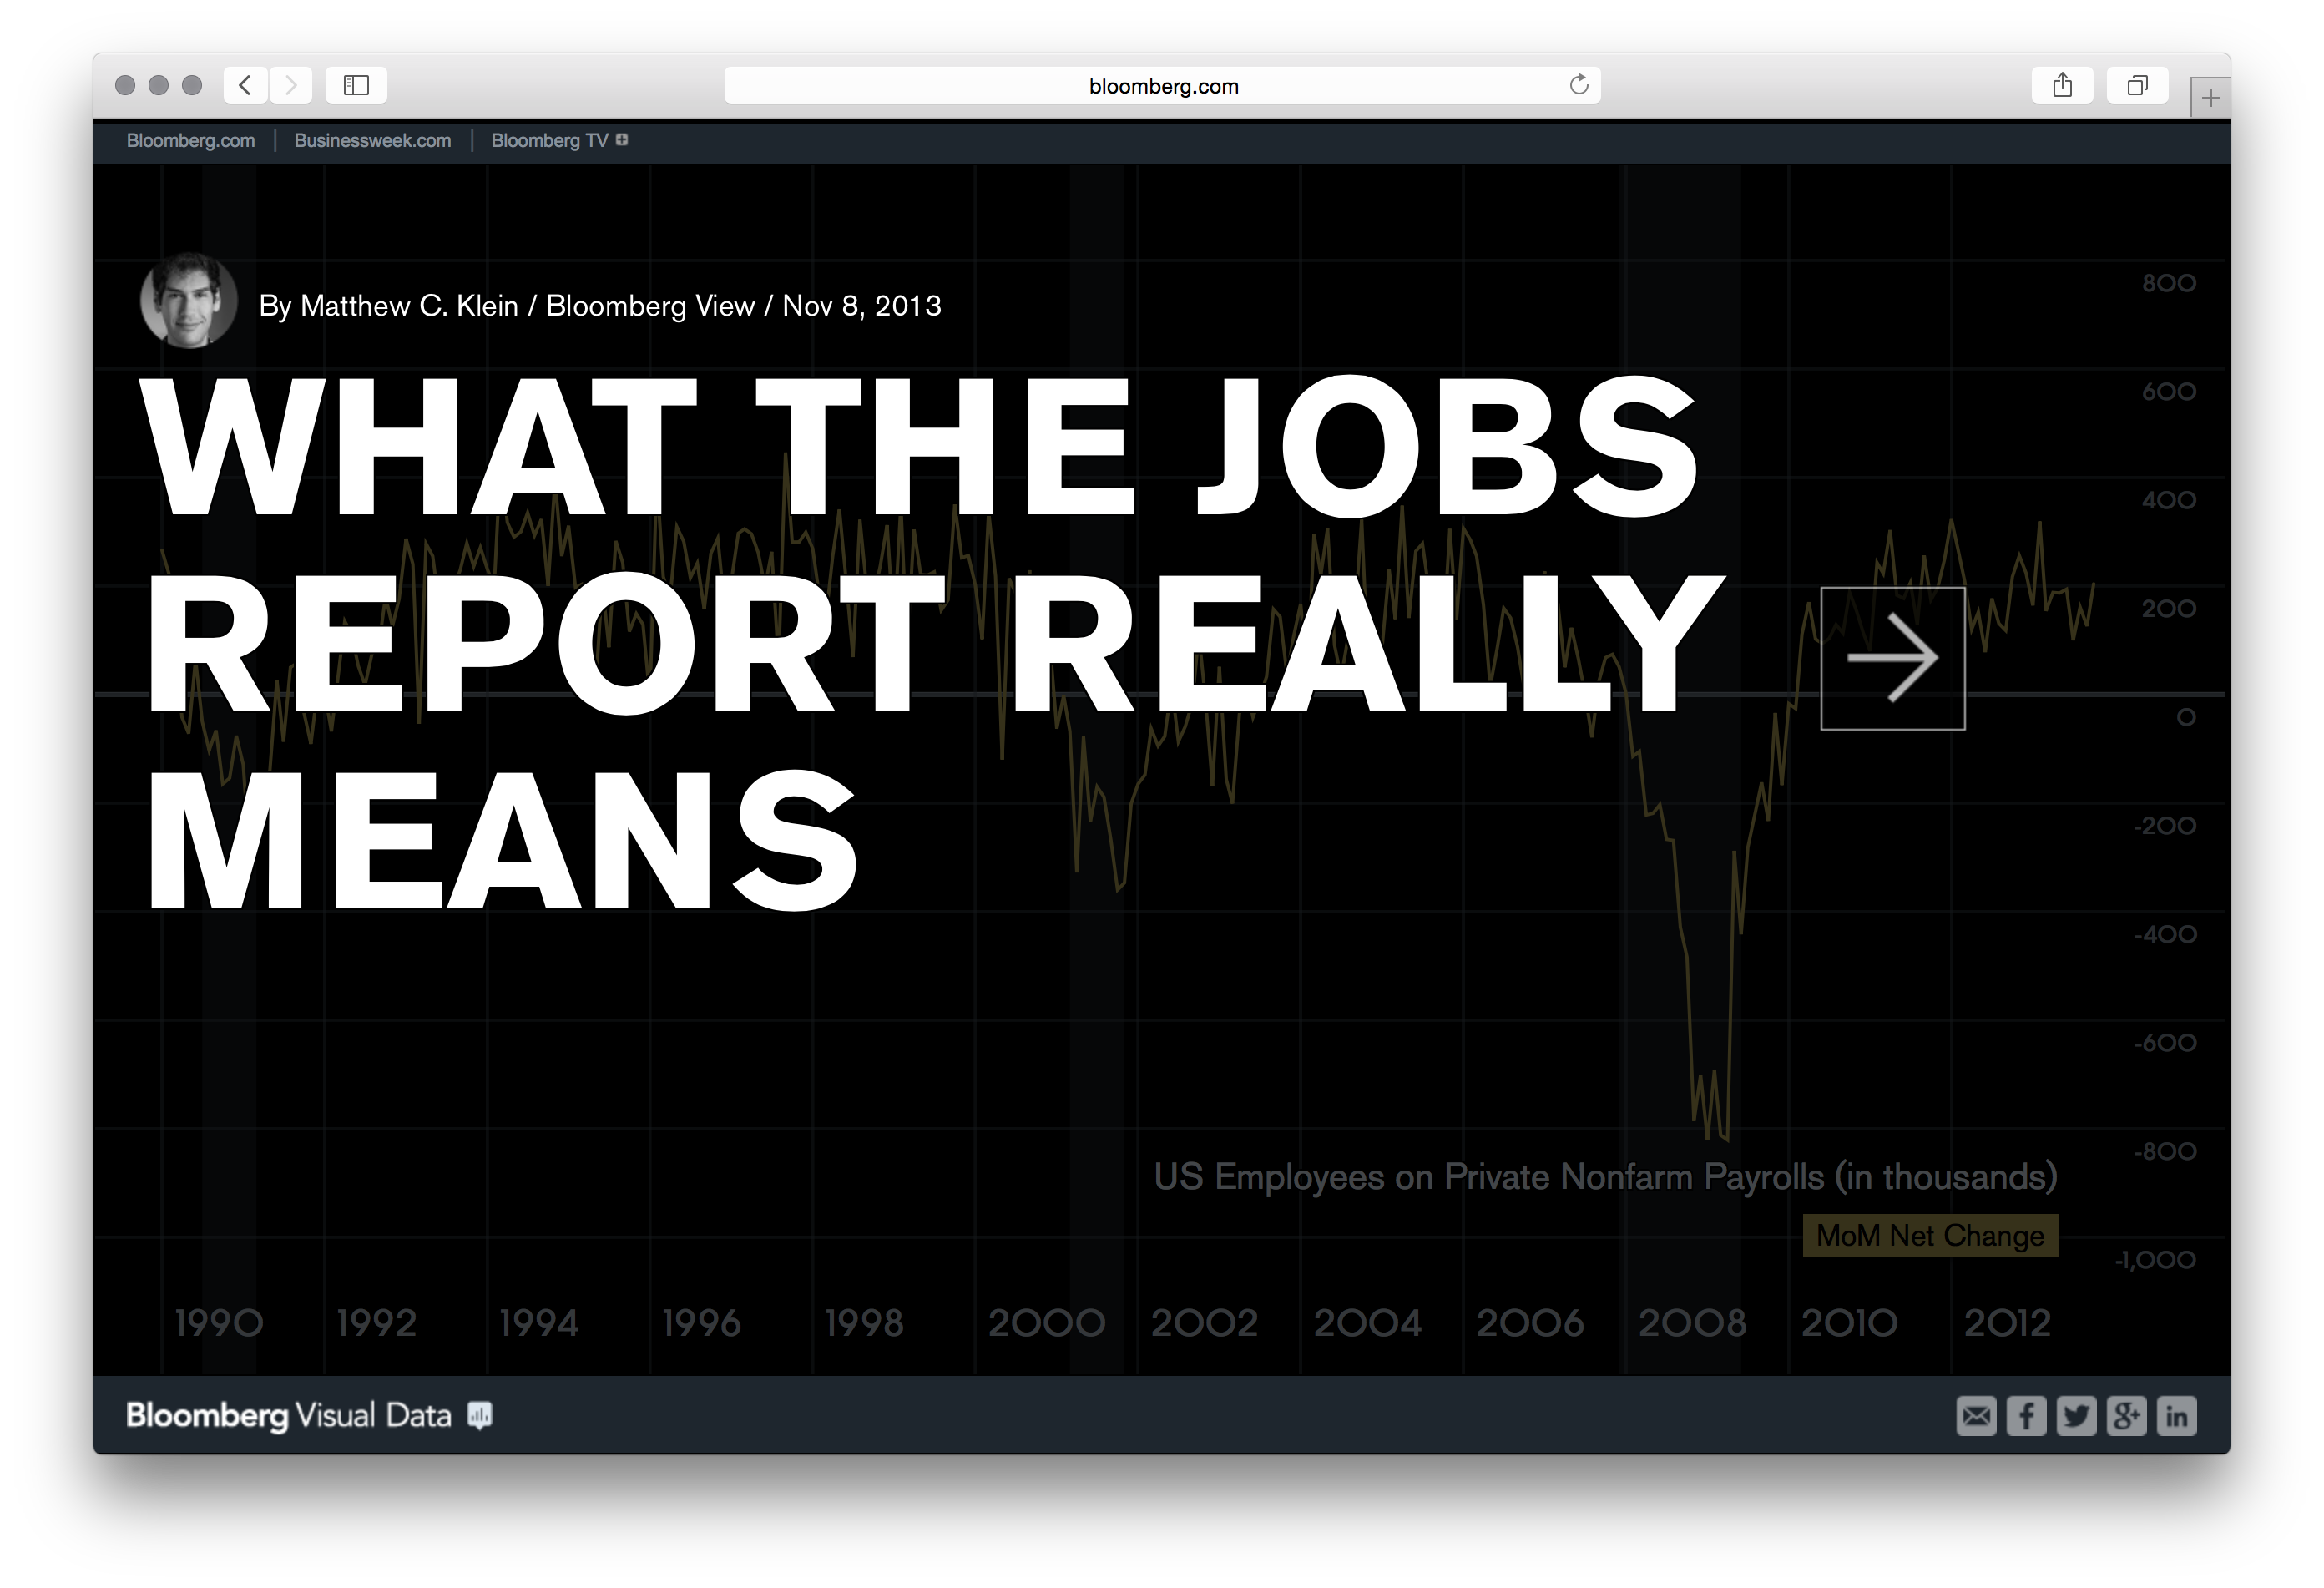
Bloomberg DataView
Bloomberg Visual Data
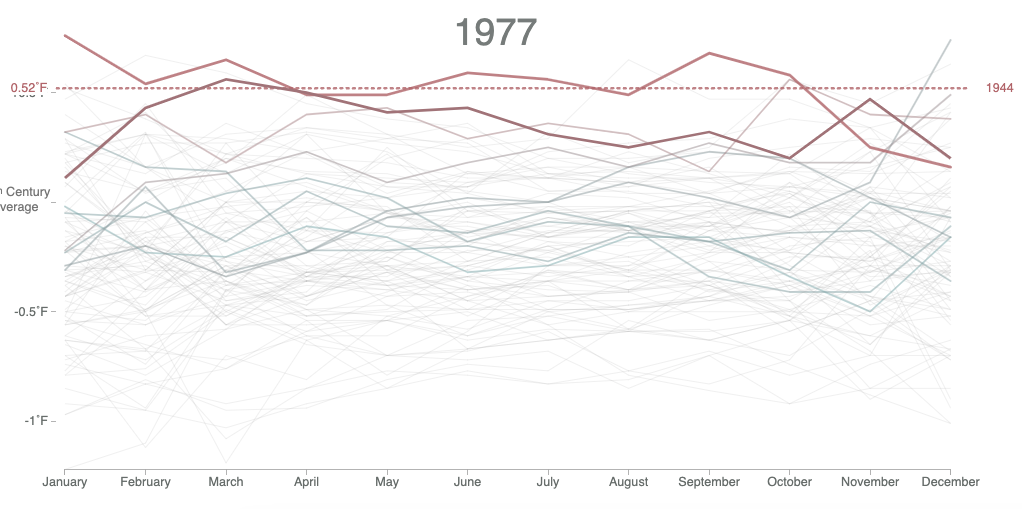
Bloomberg Hottest Year on Record
Bloomberg
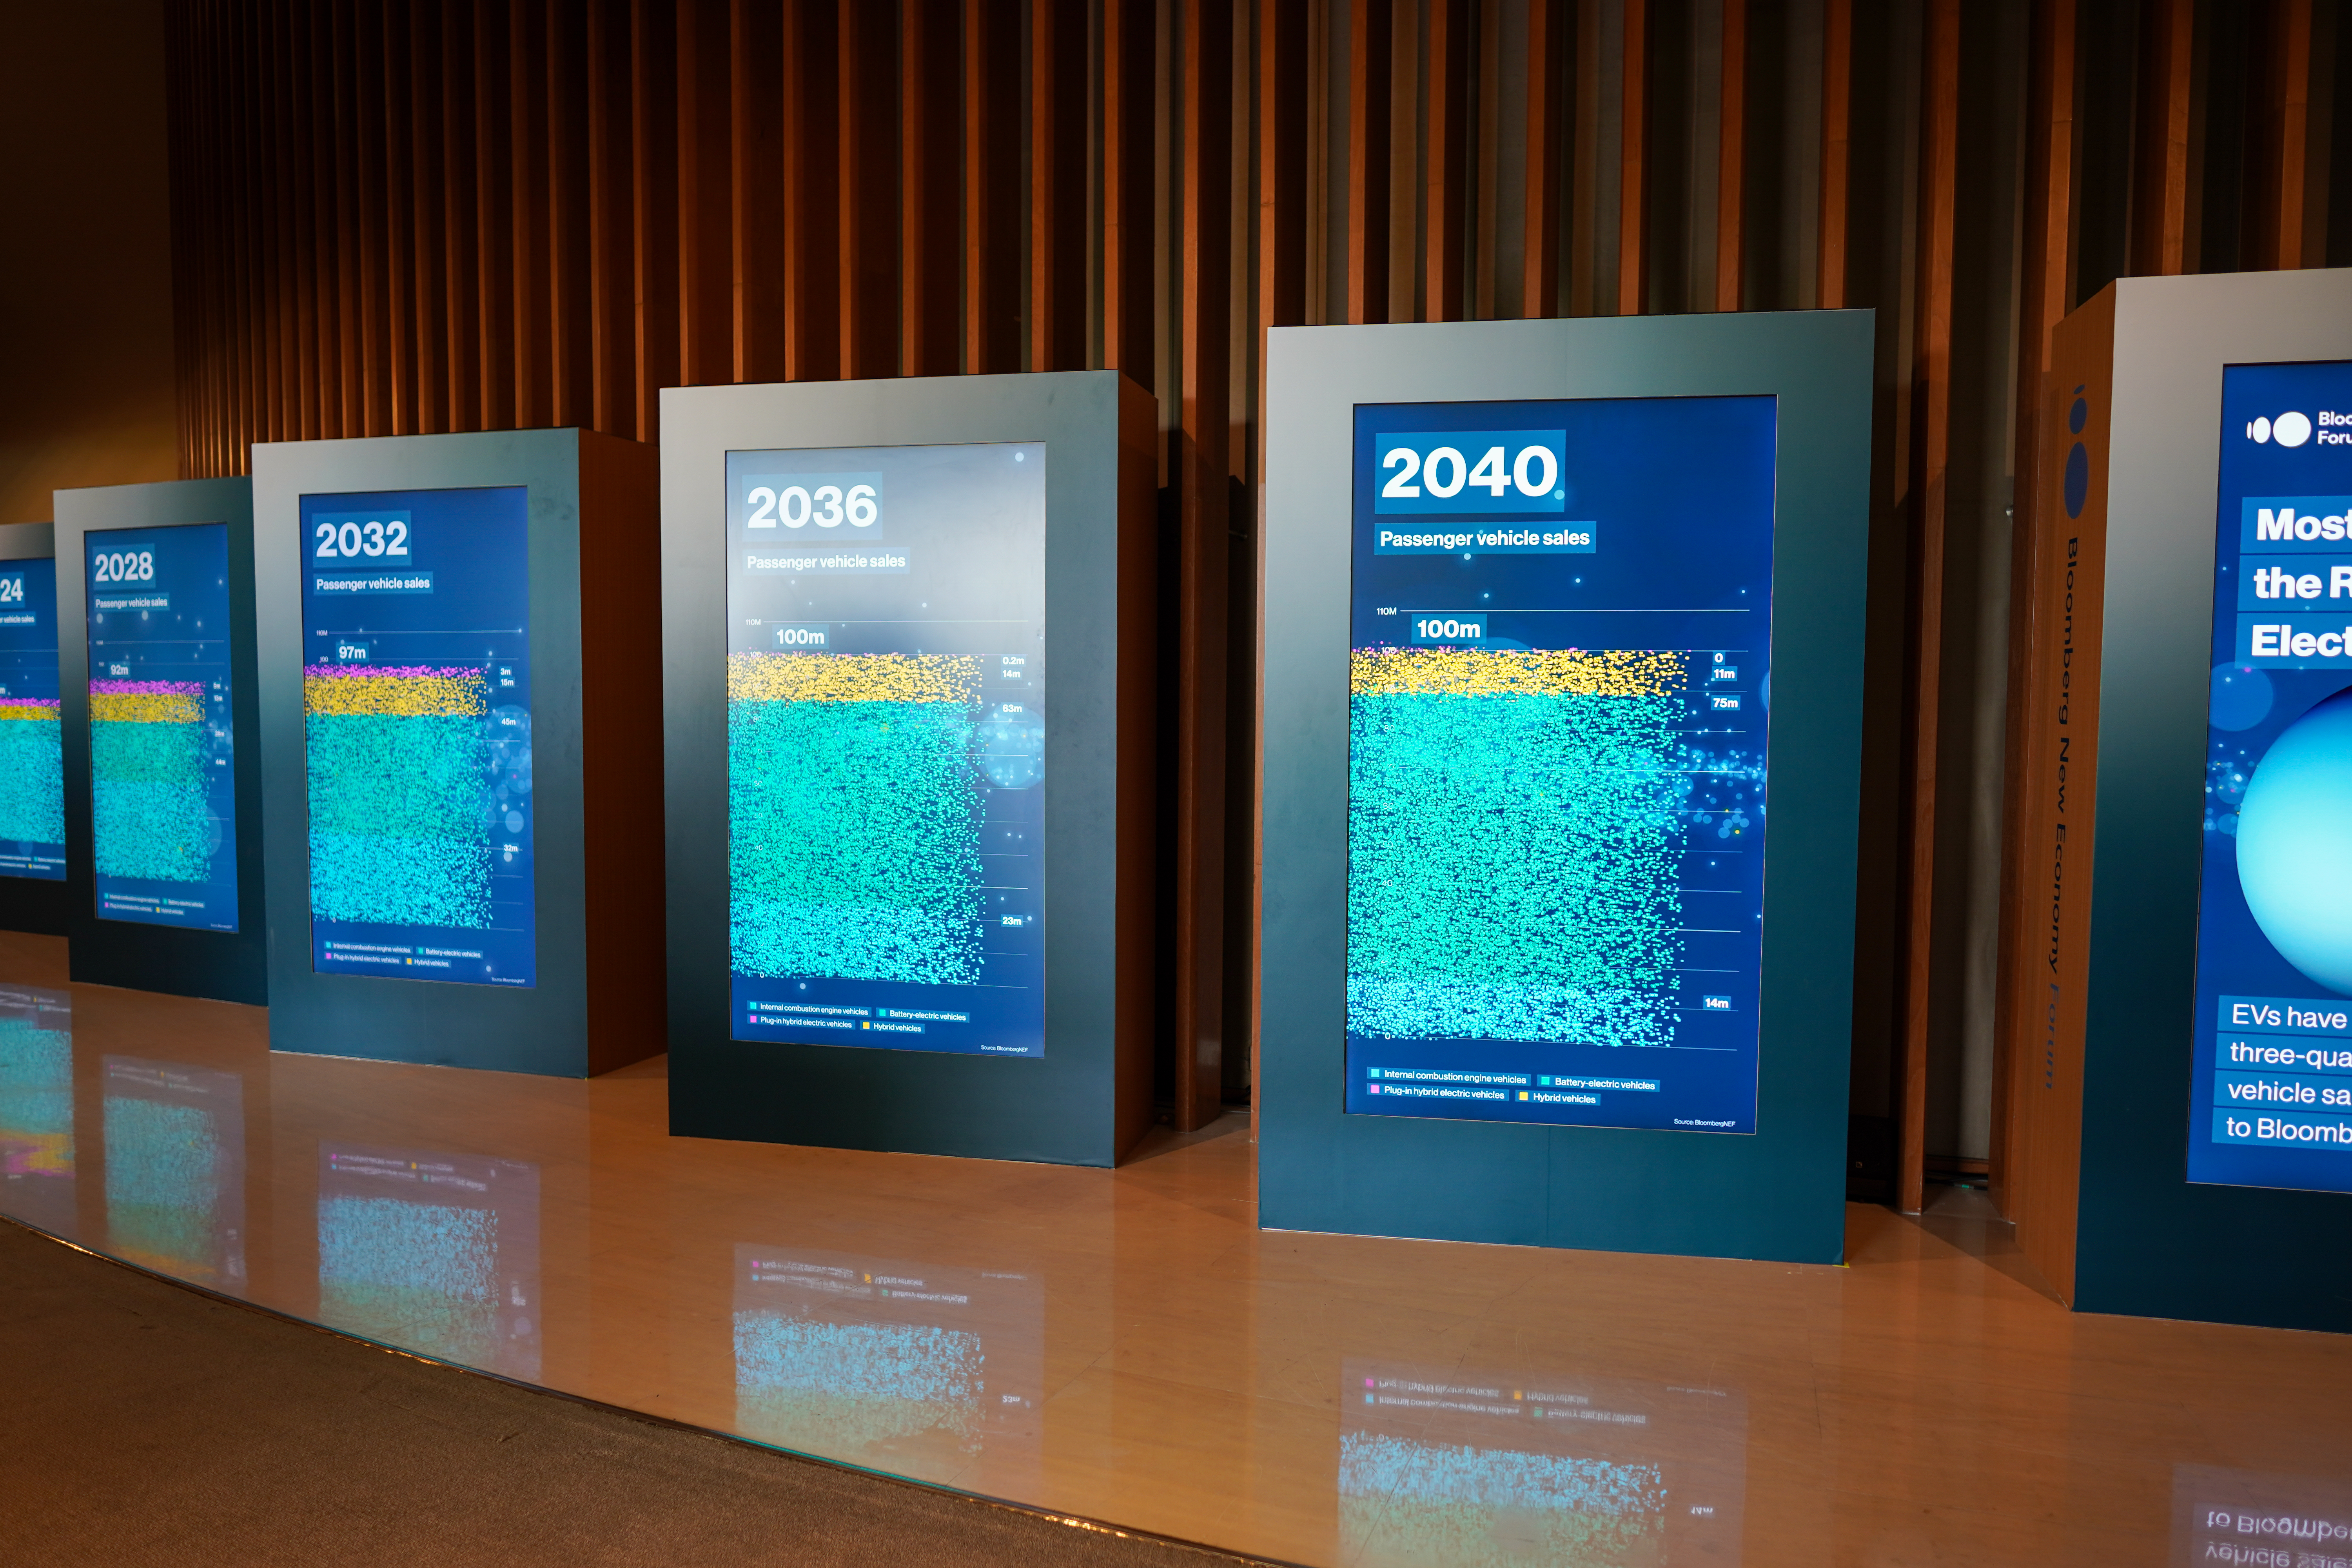
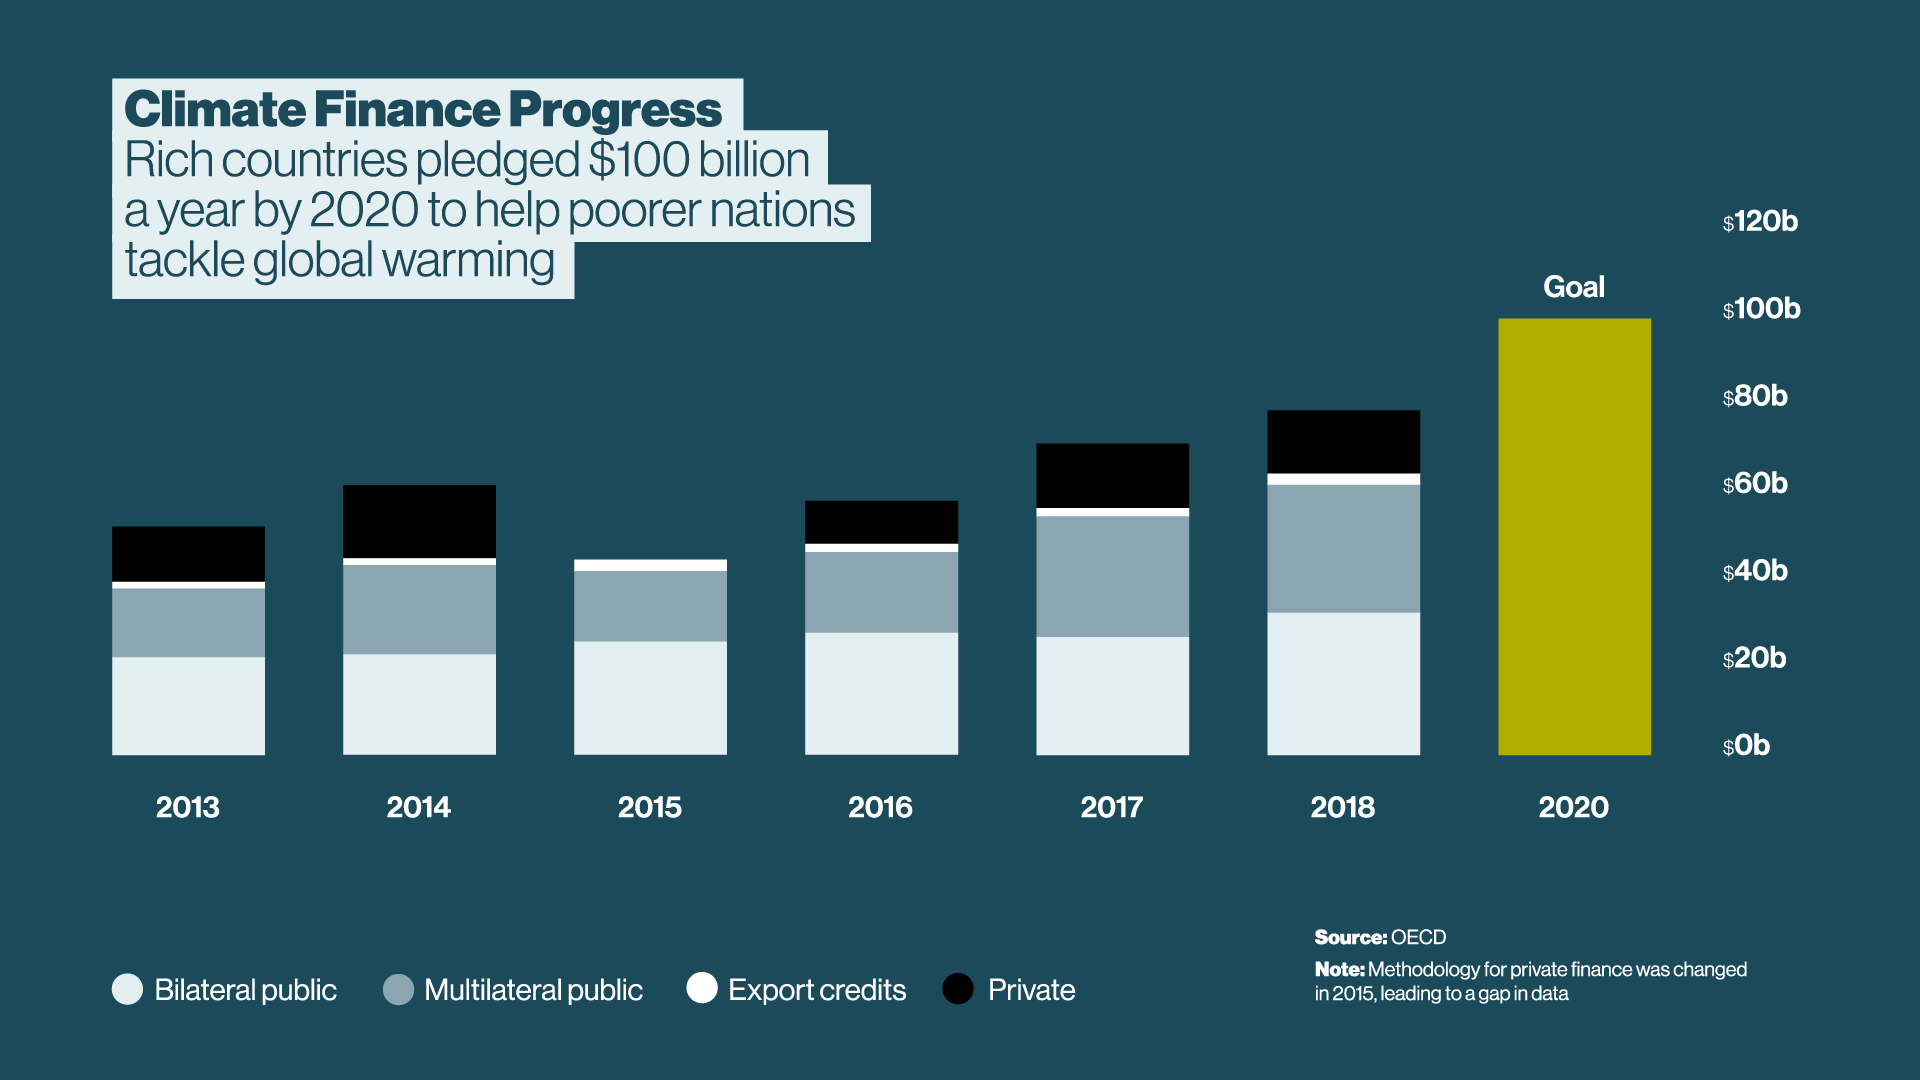
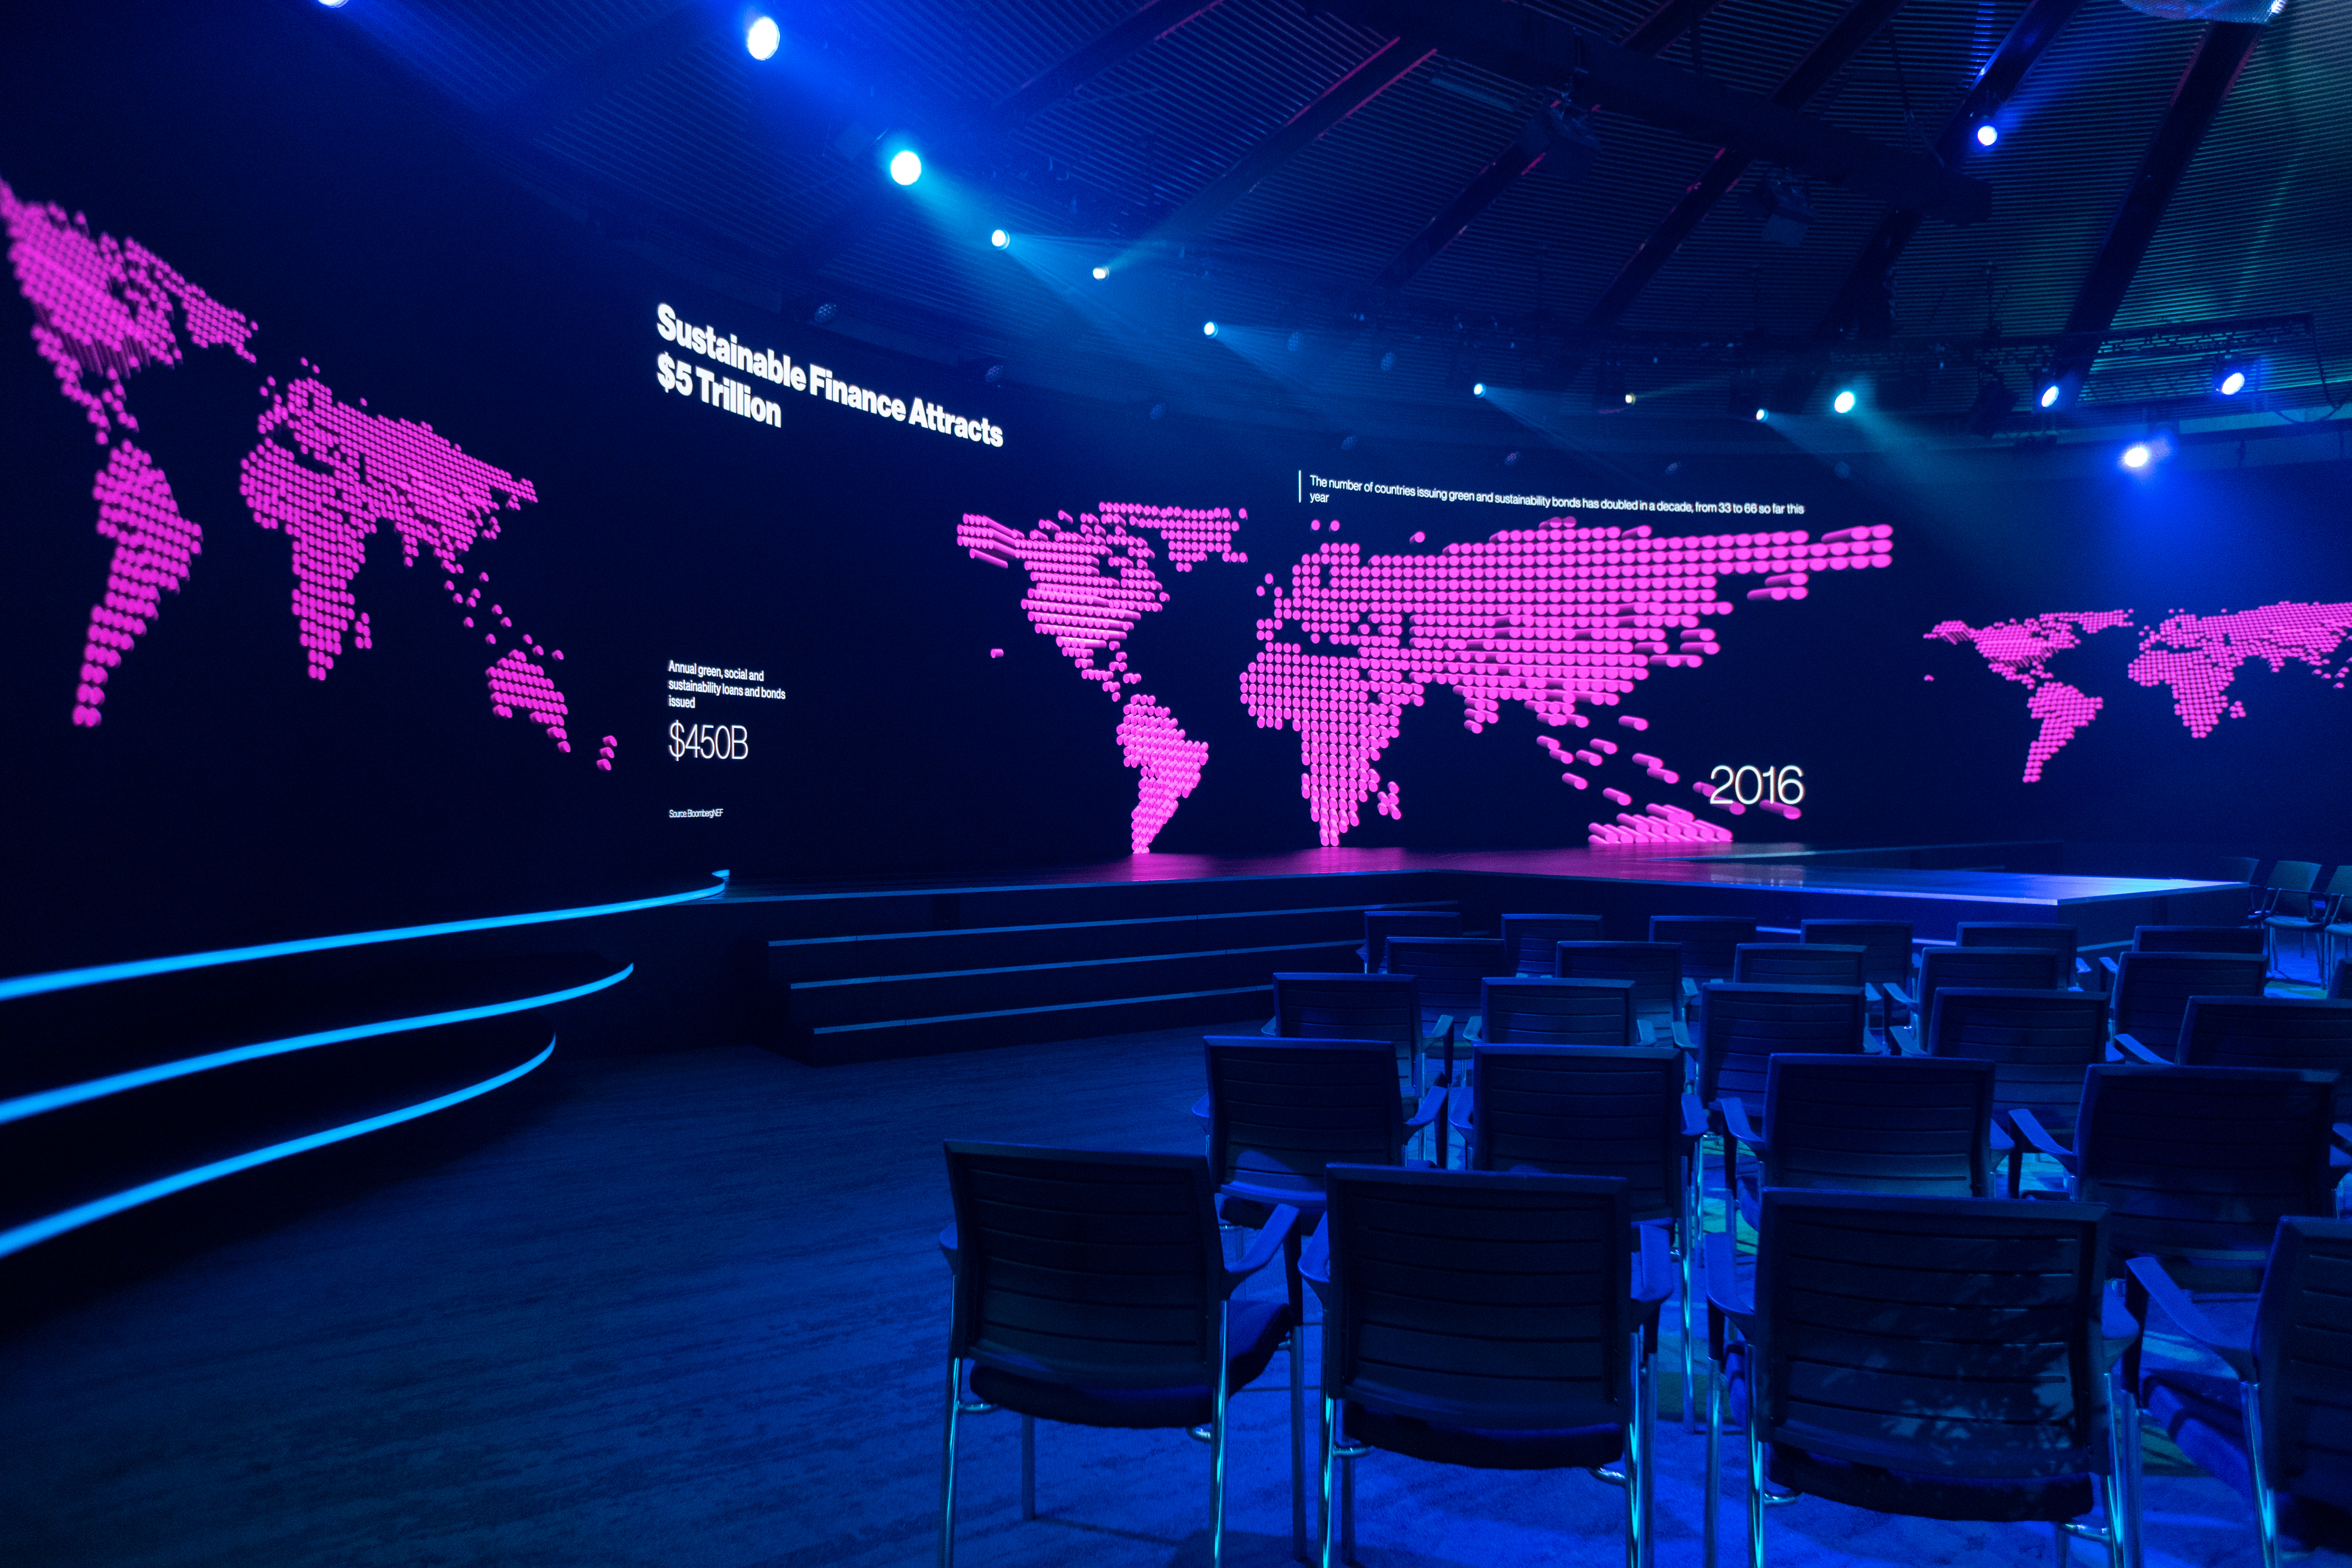
Bloomberg NEF 2023
Schema Design

Blue Forest
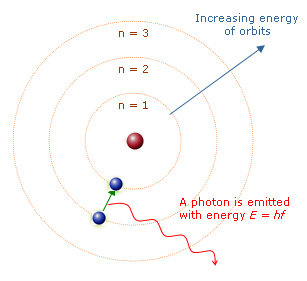
Bohr Atomic Model
Niels Bohr
Booth Poverty Map London
Charles Booth
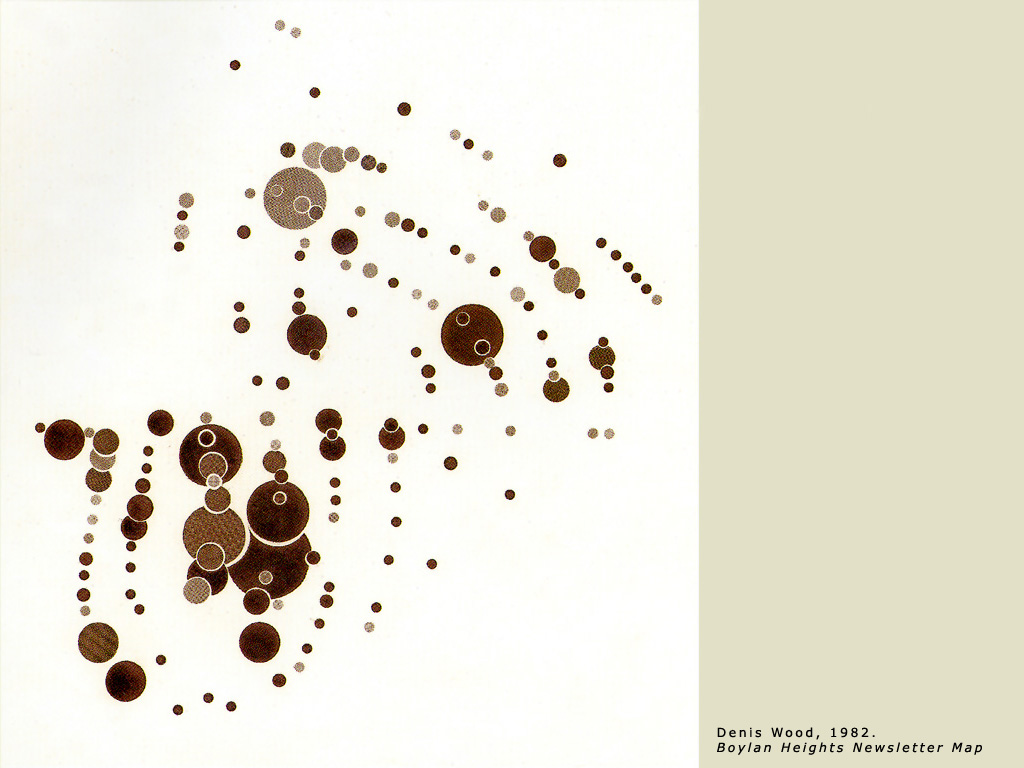
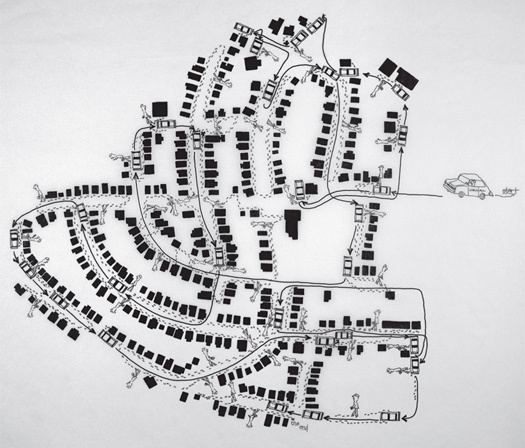
Boylan Heights Newsletter
Unknown
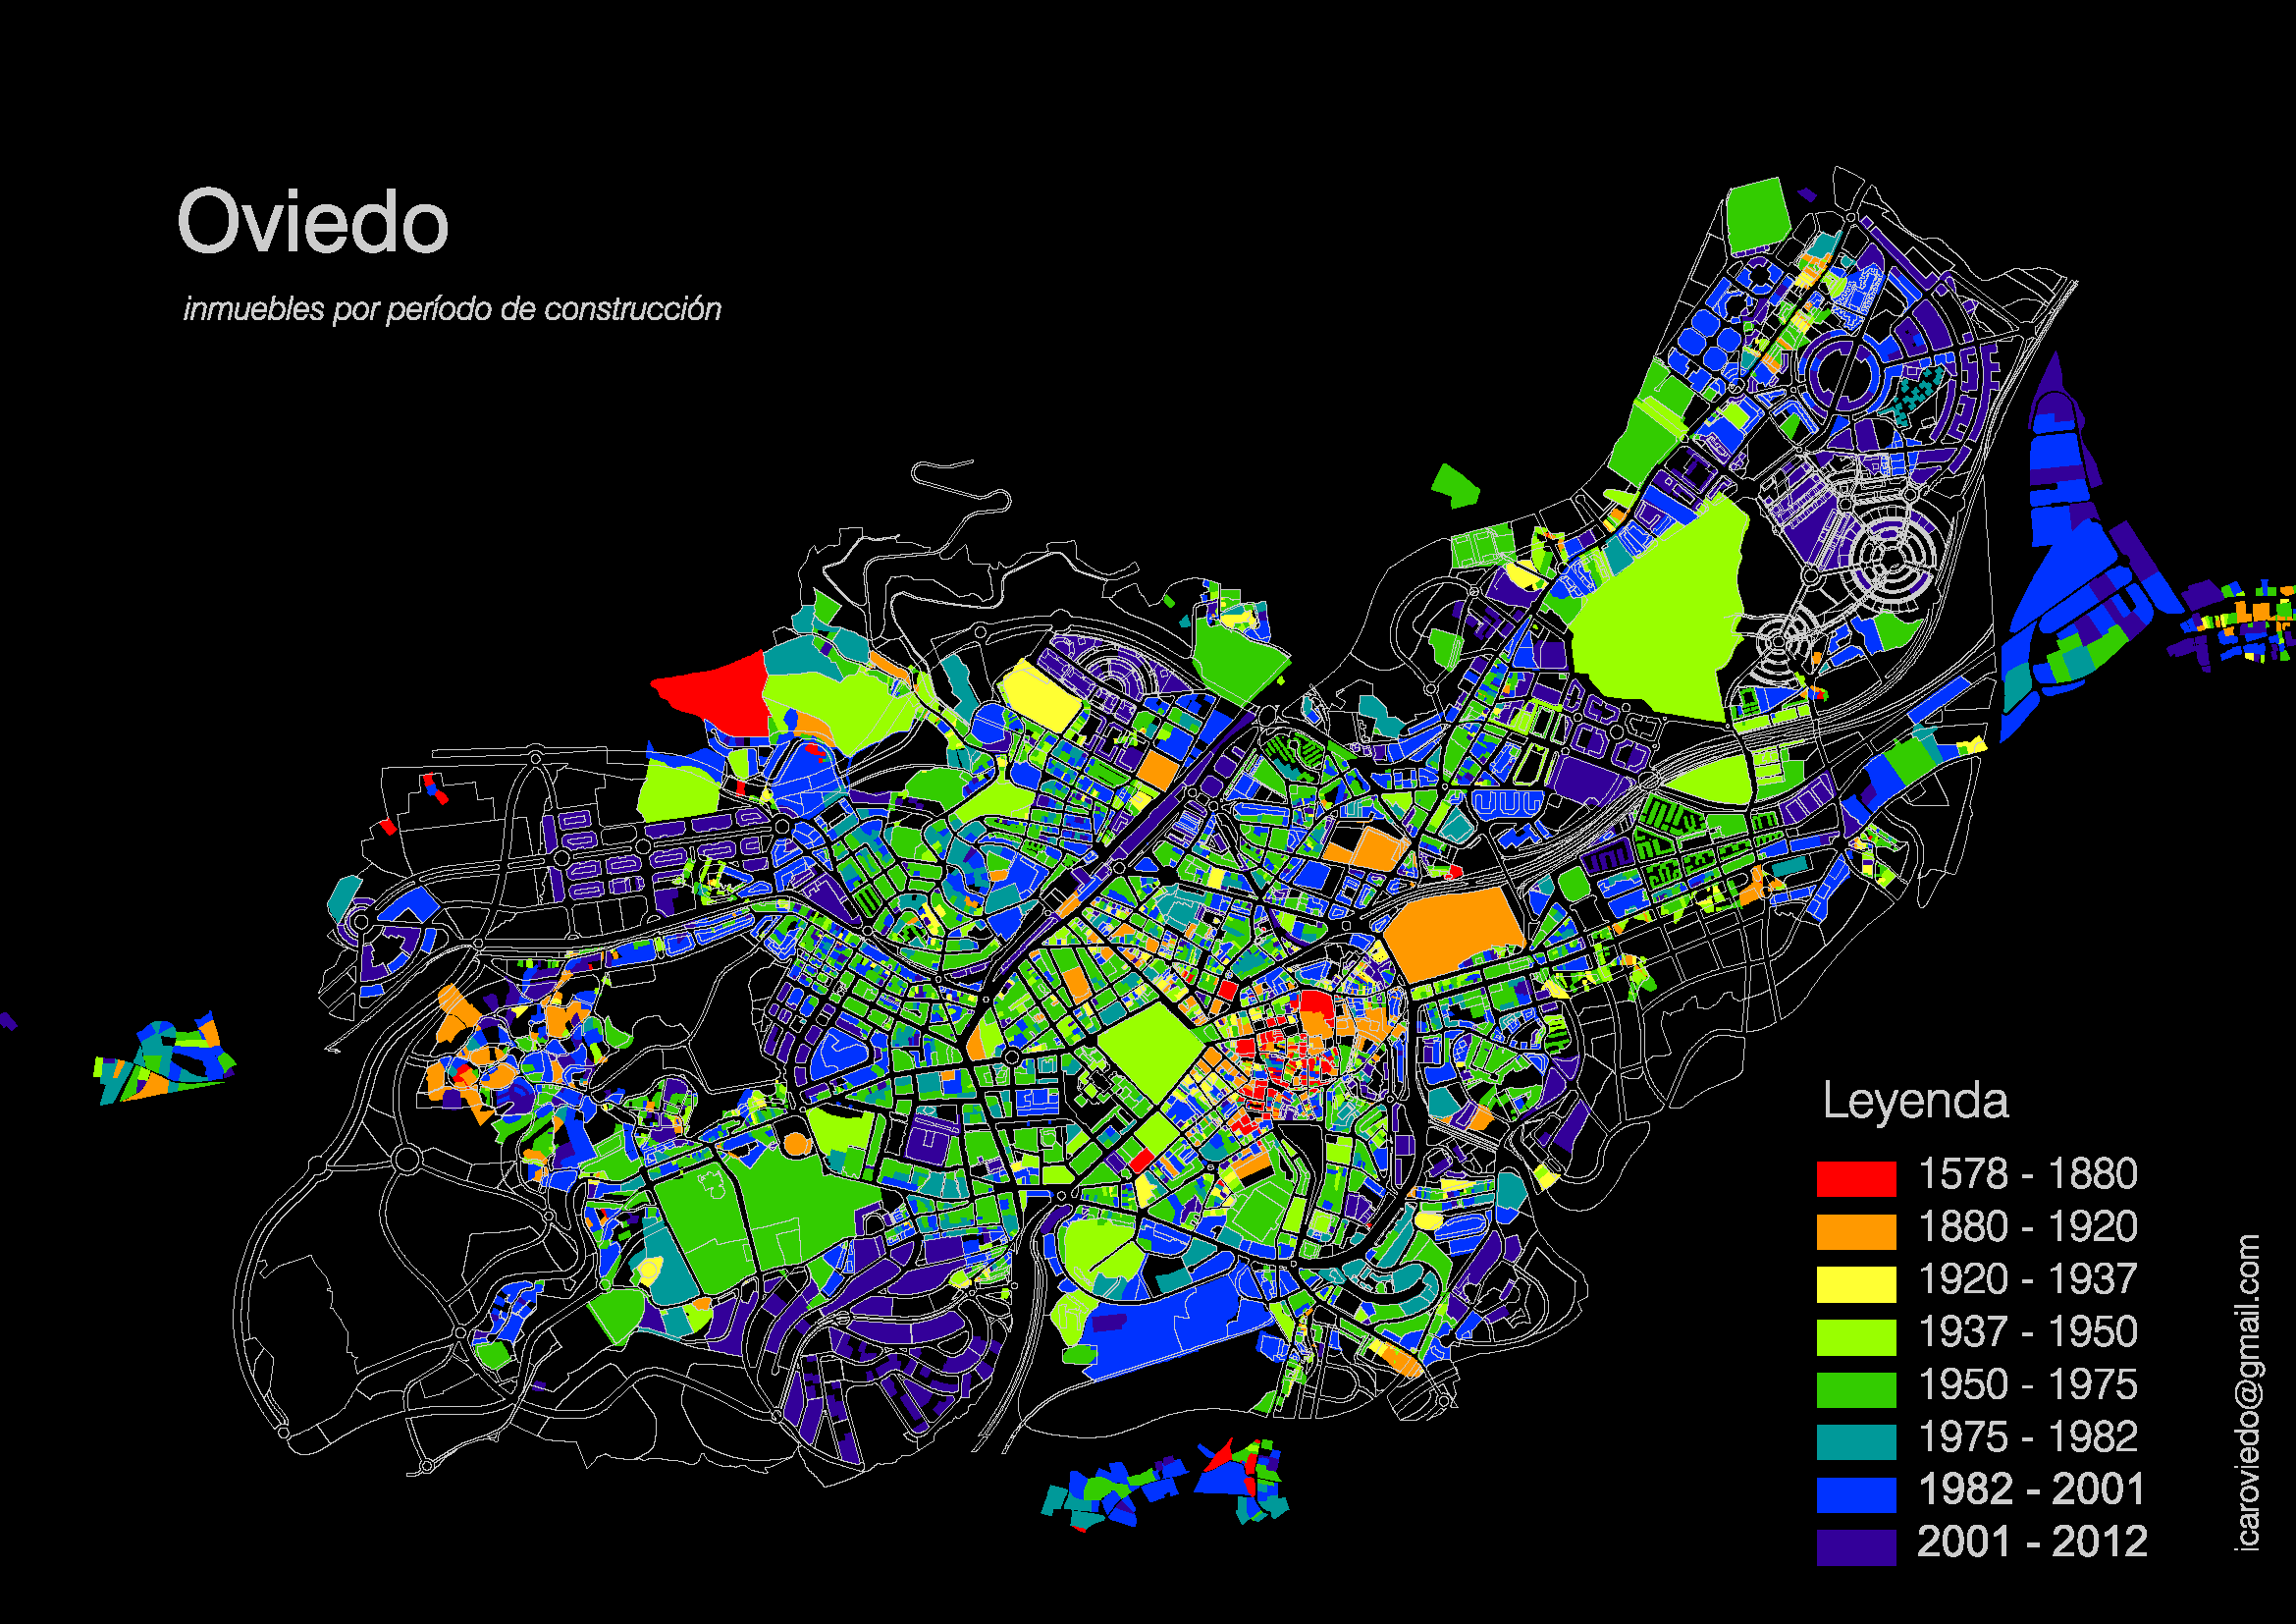
Building Age Maps
Raúl Obeso
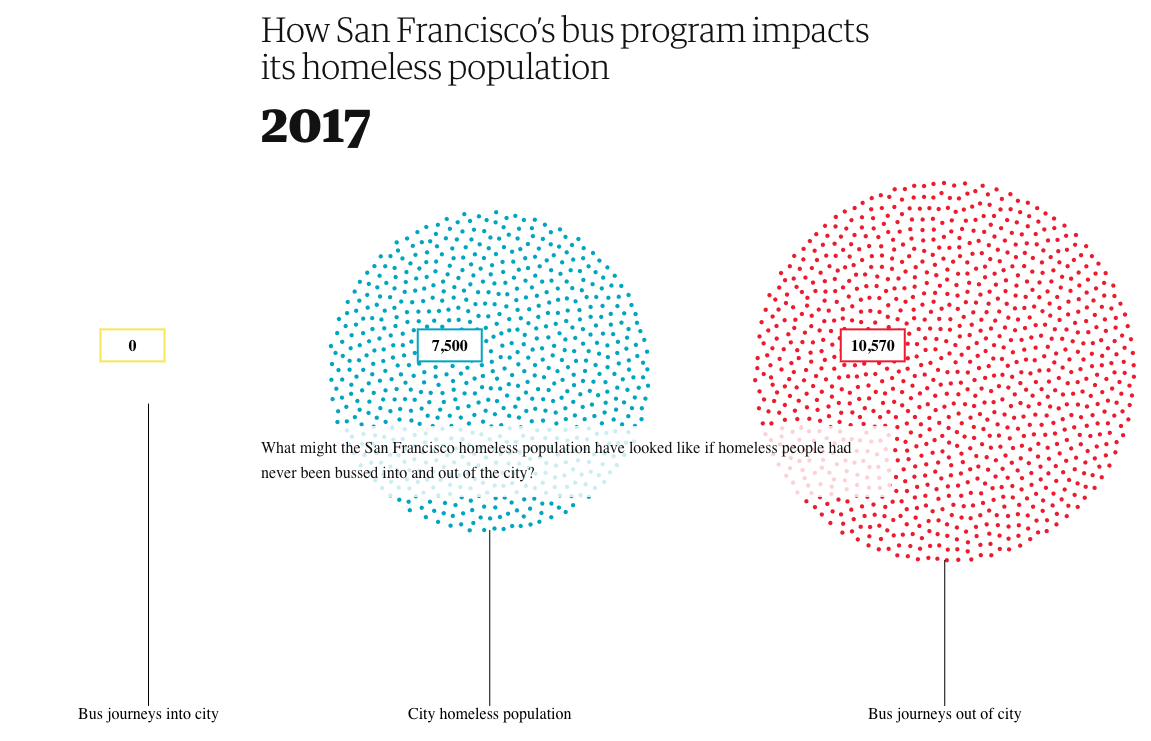
Bussed Out
The Guardian
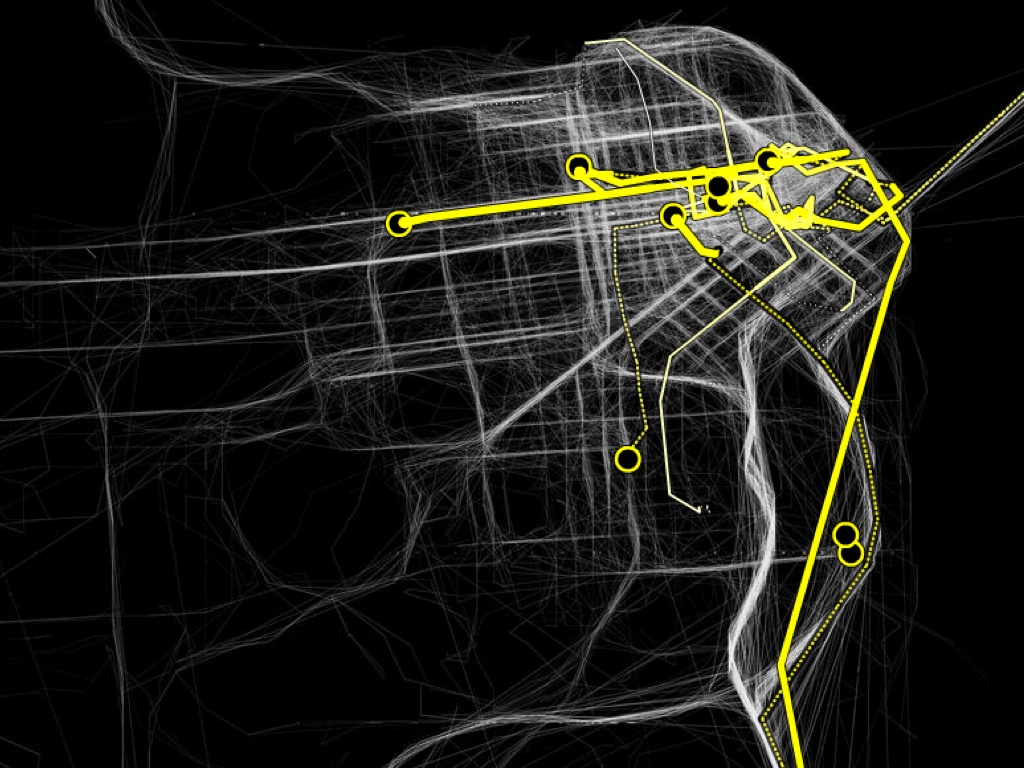
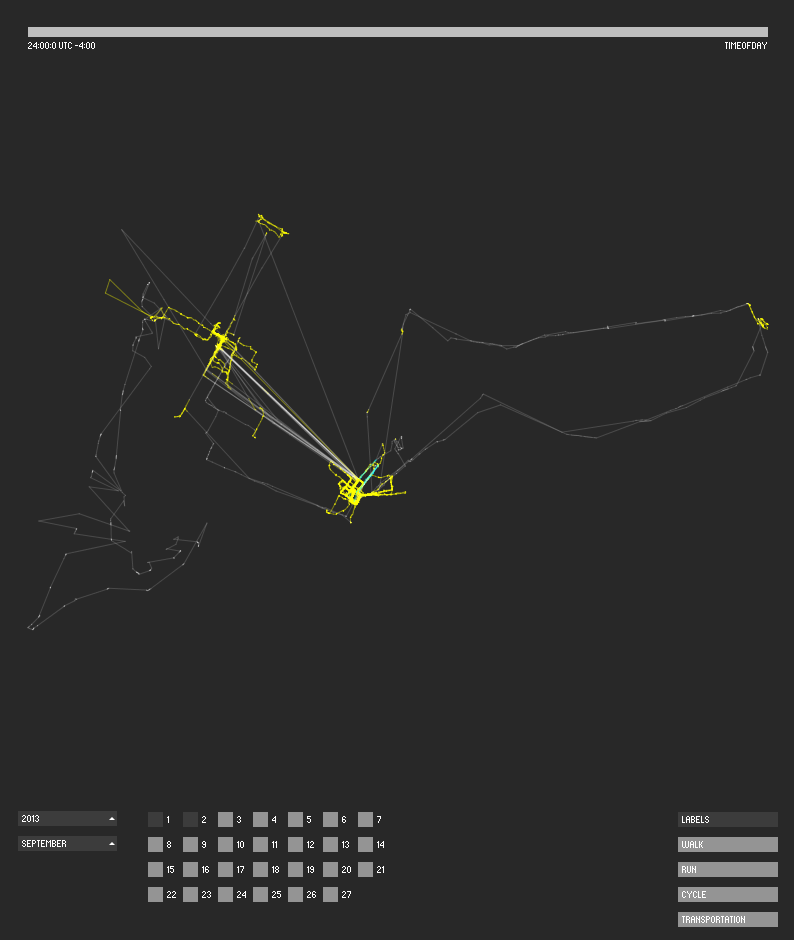
Cabspotting
Stamen Design

Caltech
Caltech
Can You Gerrymander Your Party to Power?
The New York Times
Can You Make Winter Less Dark?, 538
538
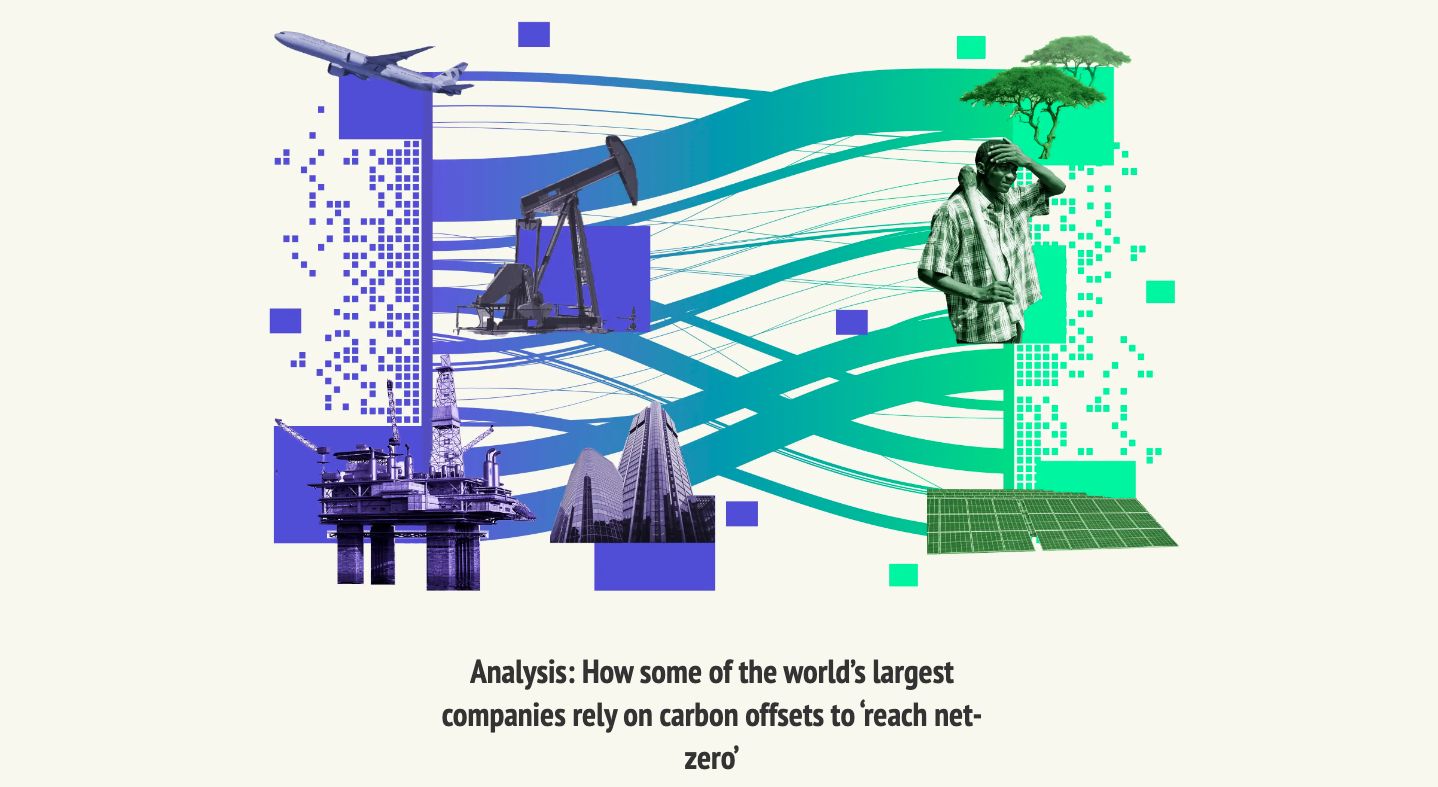
Carbon Offsets
Carbon Brief
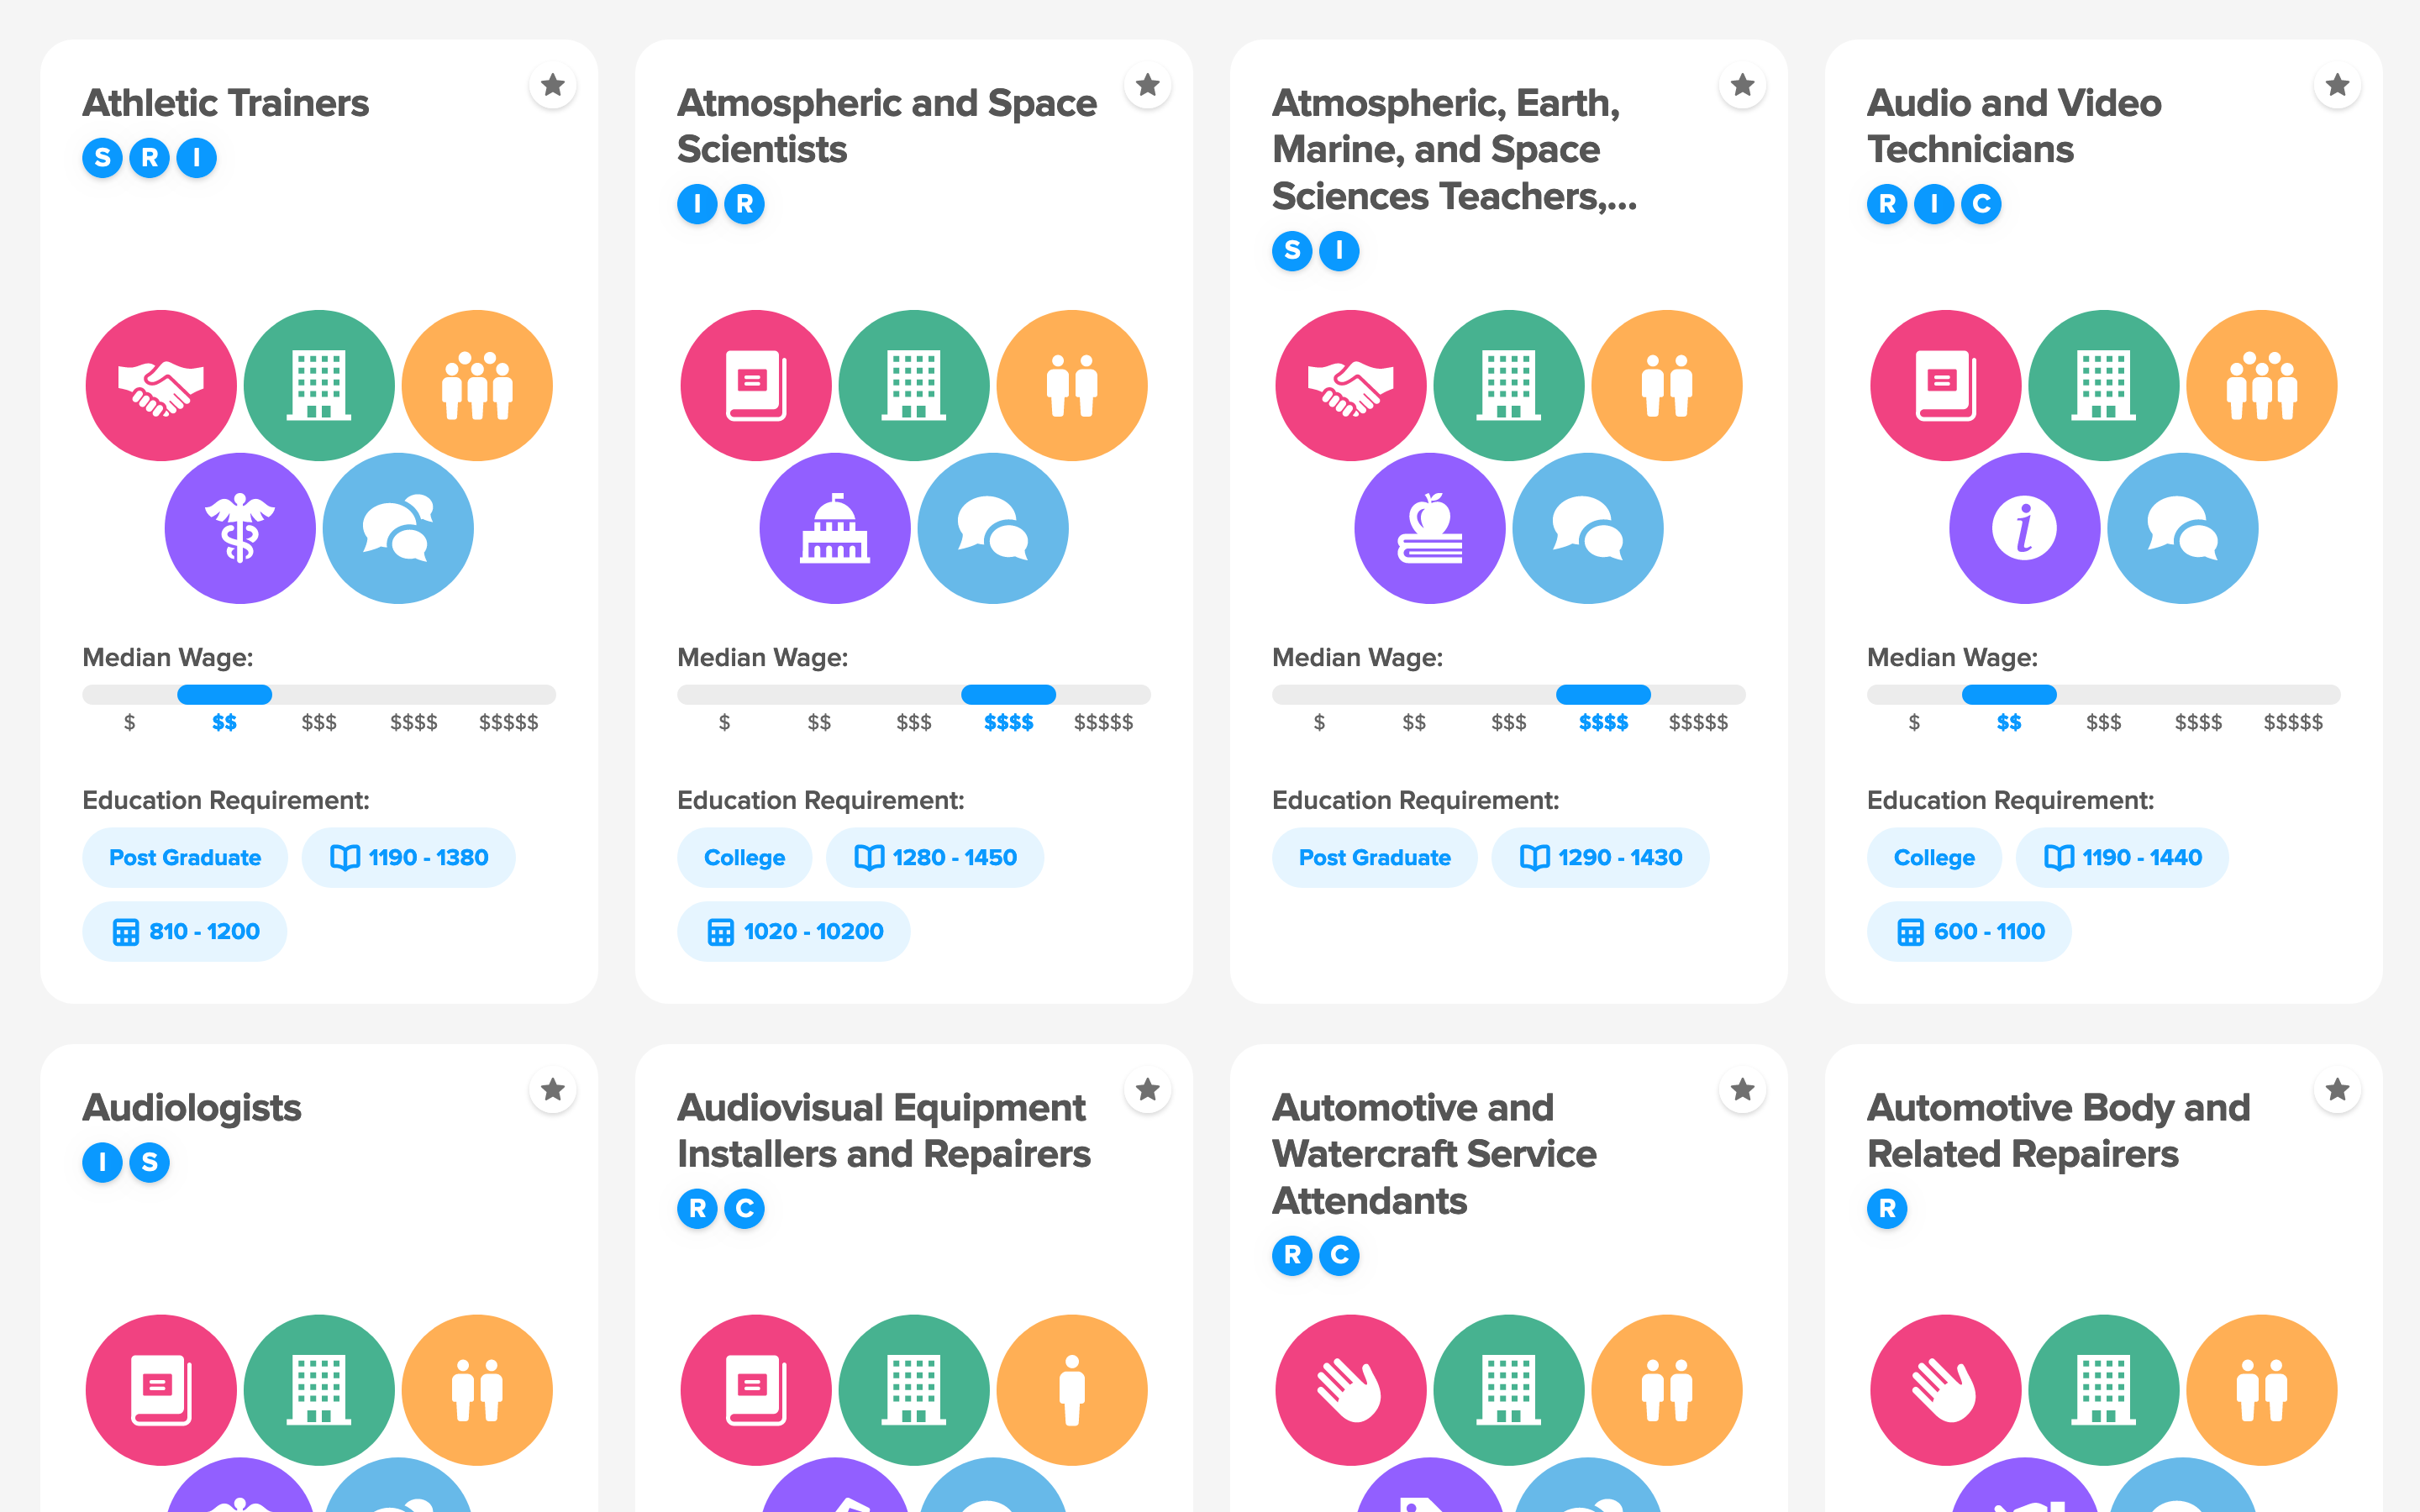
Career Center
Schema Design
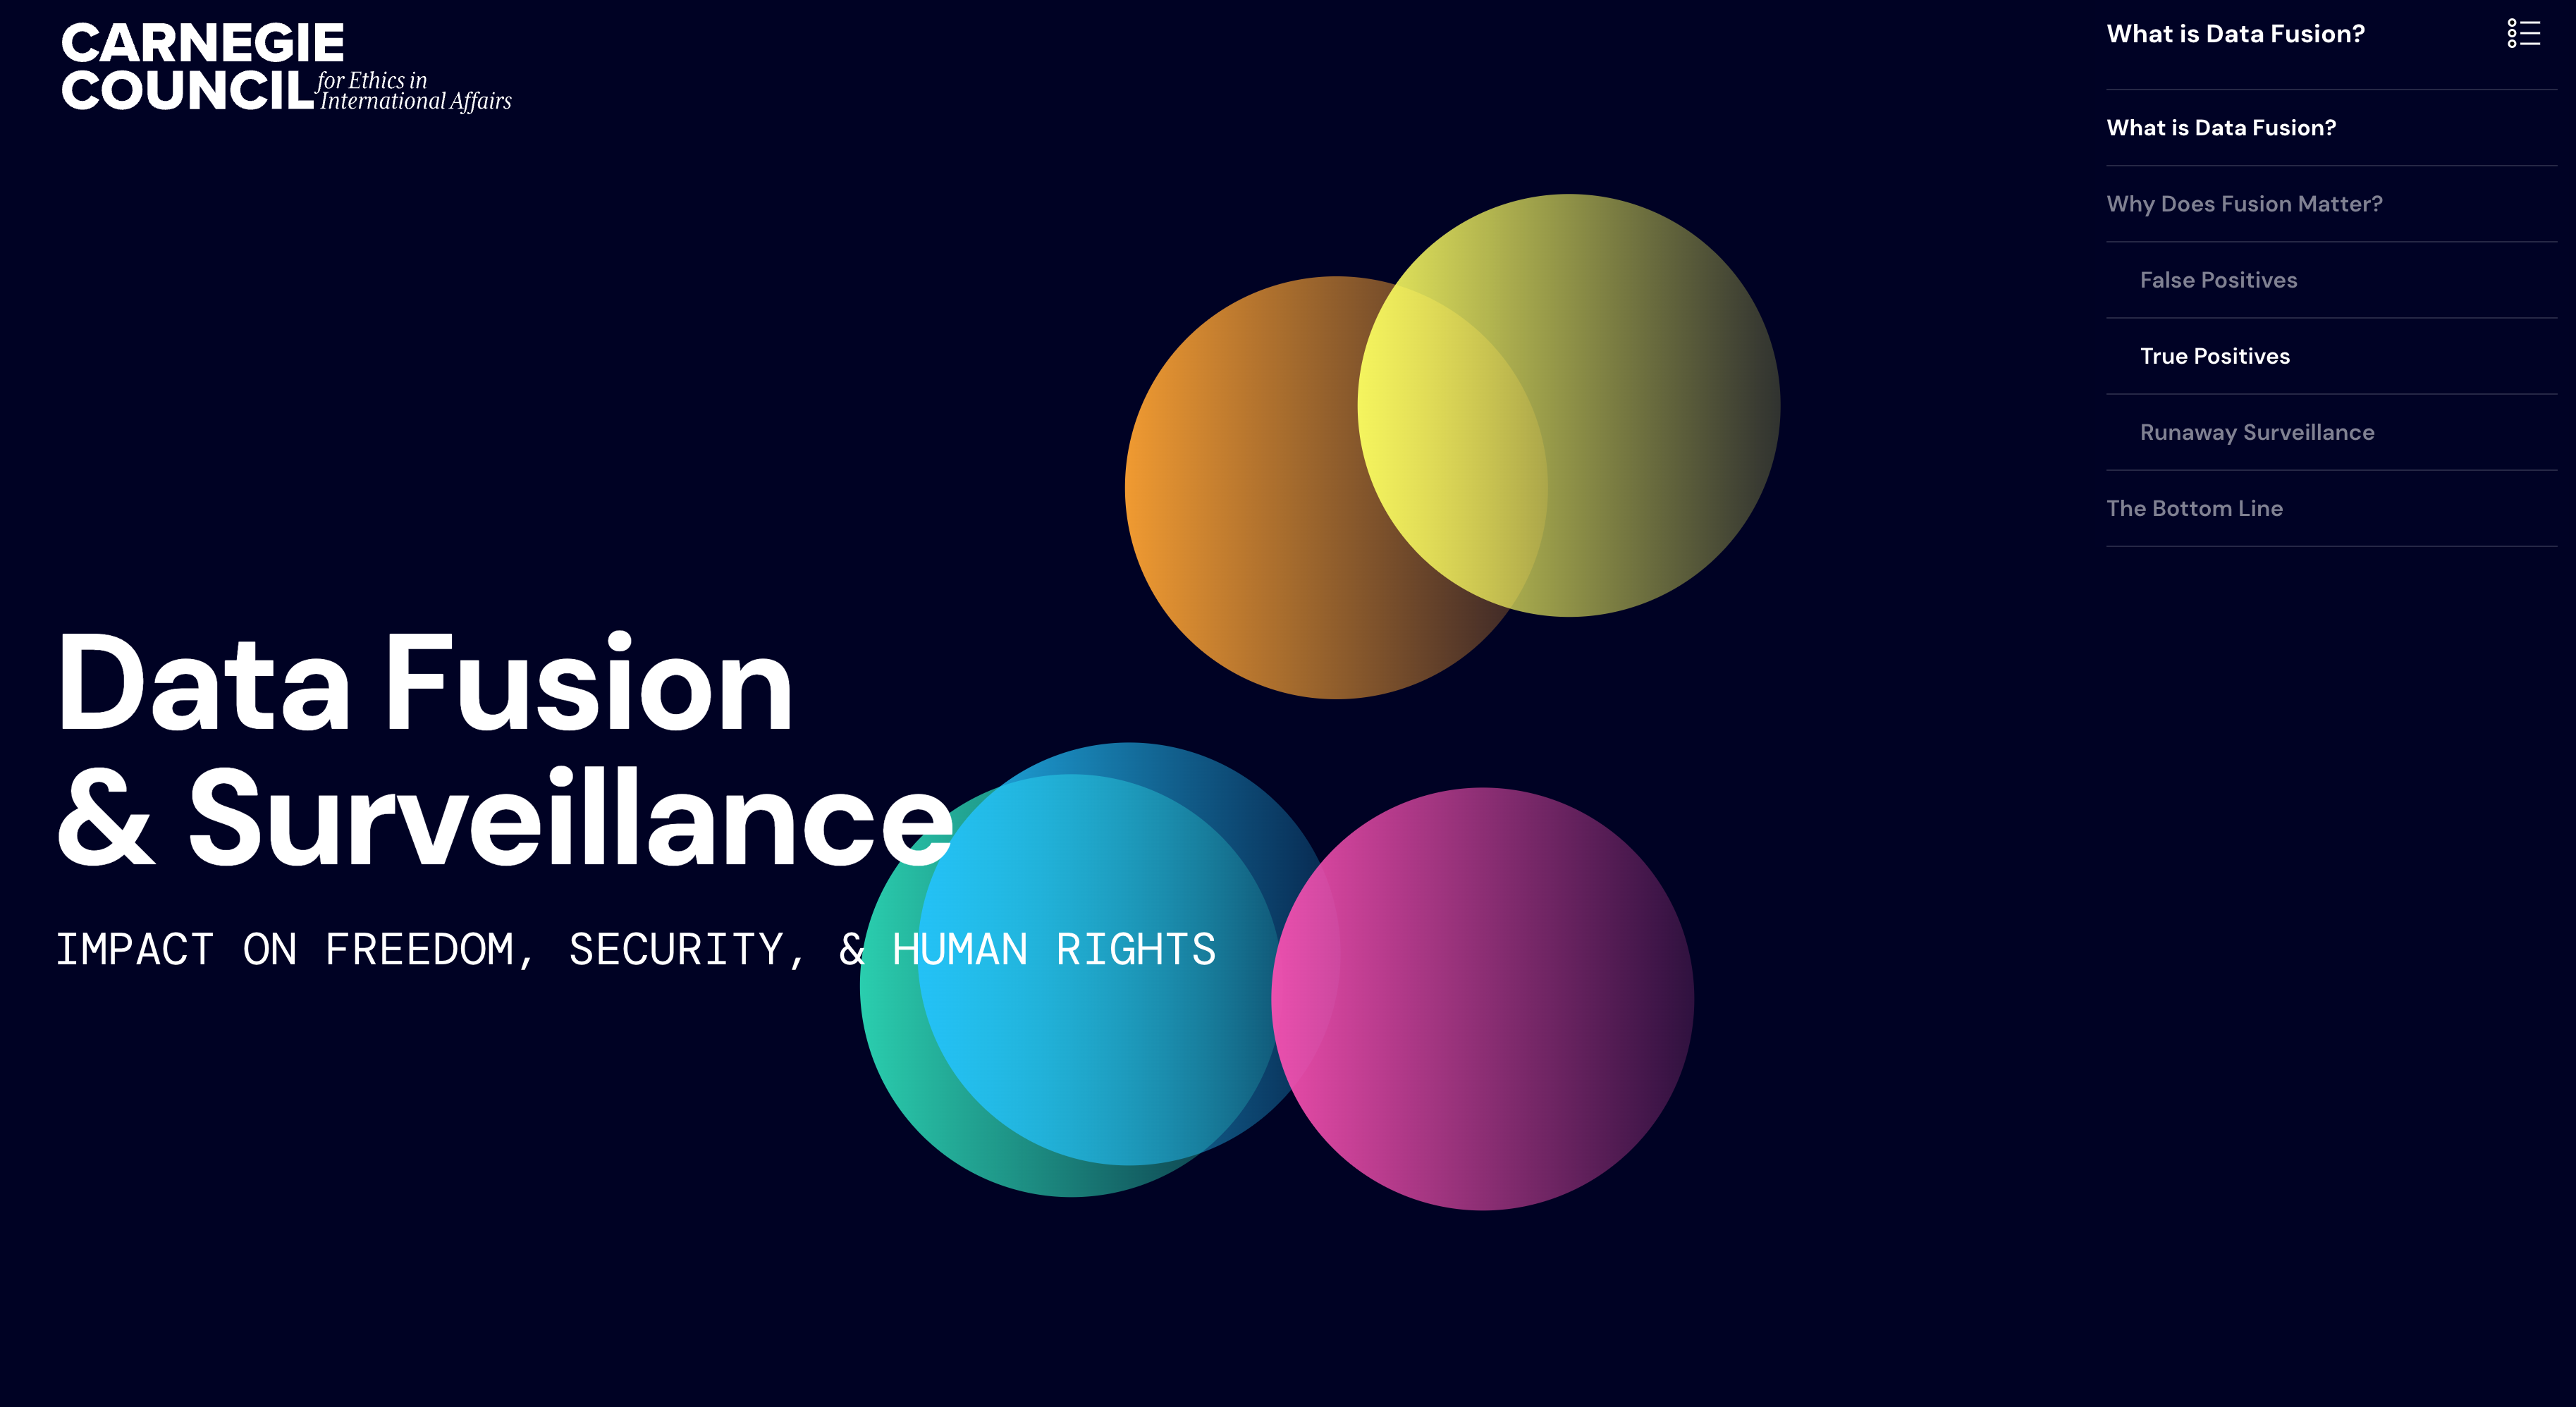
Carnegie Council Ethics Accelerator Data Storytelling
Schema Design
Carnivore
Alexander Galloway

Carrot
Cascade
NYT R&D Lab
Cascade - Beyond Words Studio
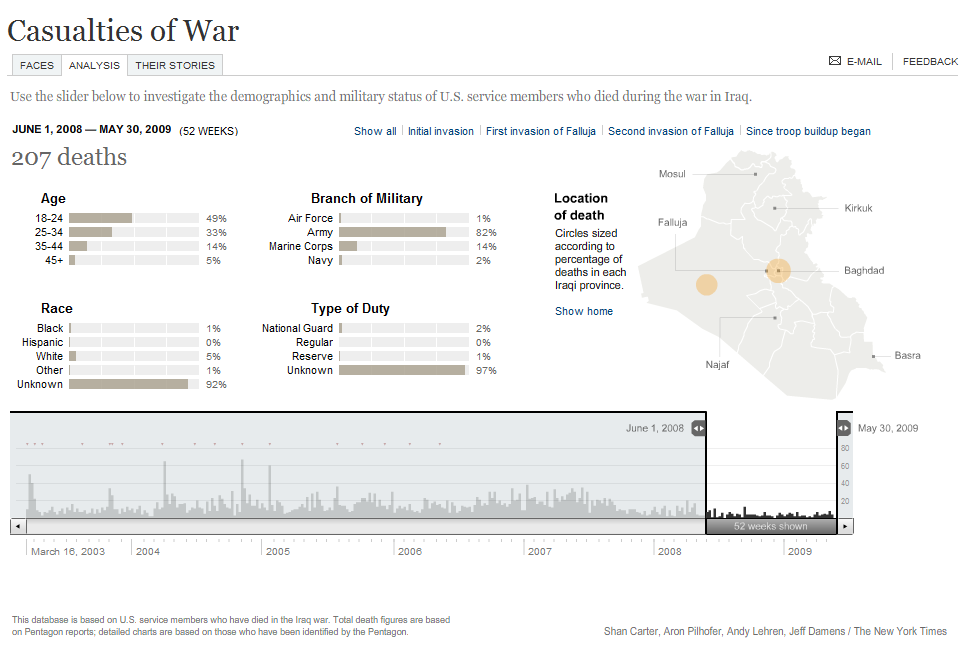
Casualties of War
New York Times Graphics
Caswell Mindmap
Caswell
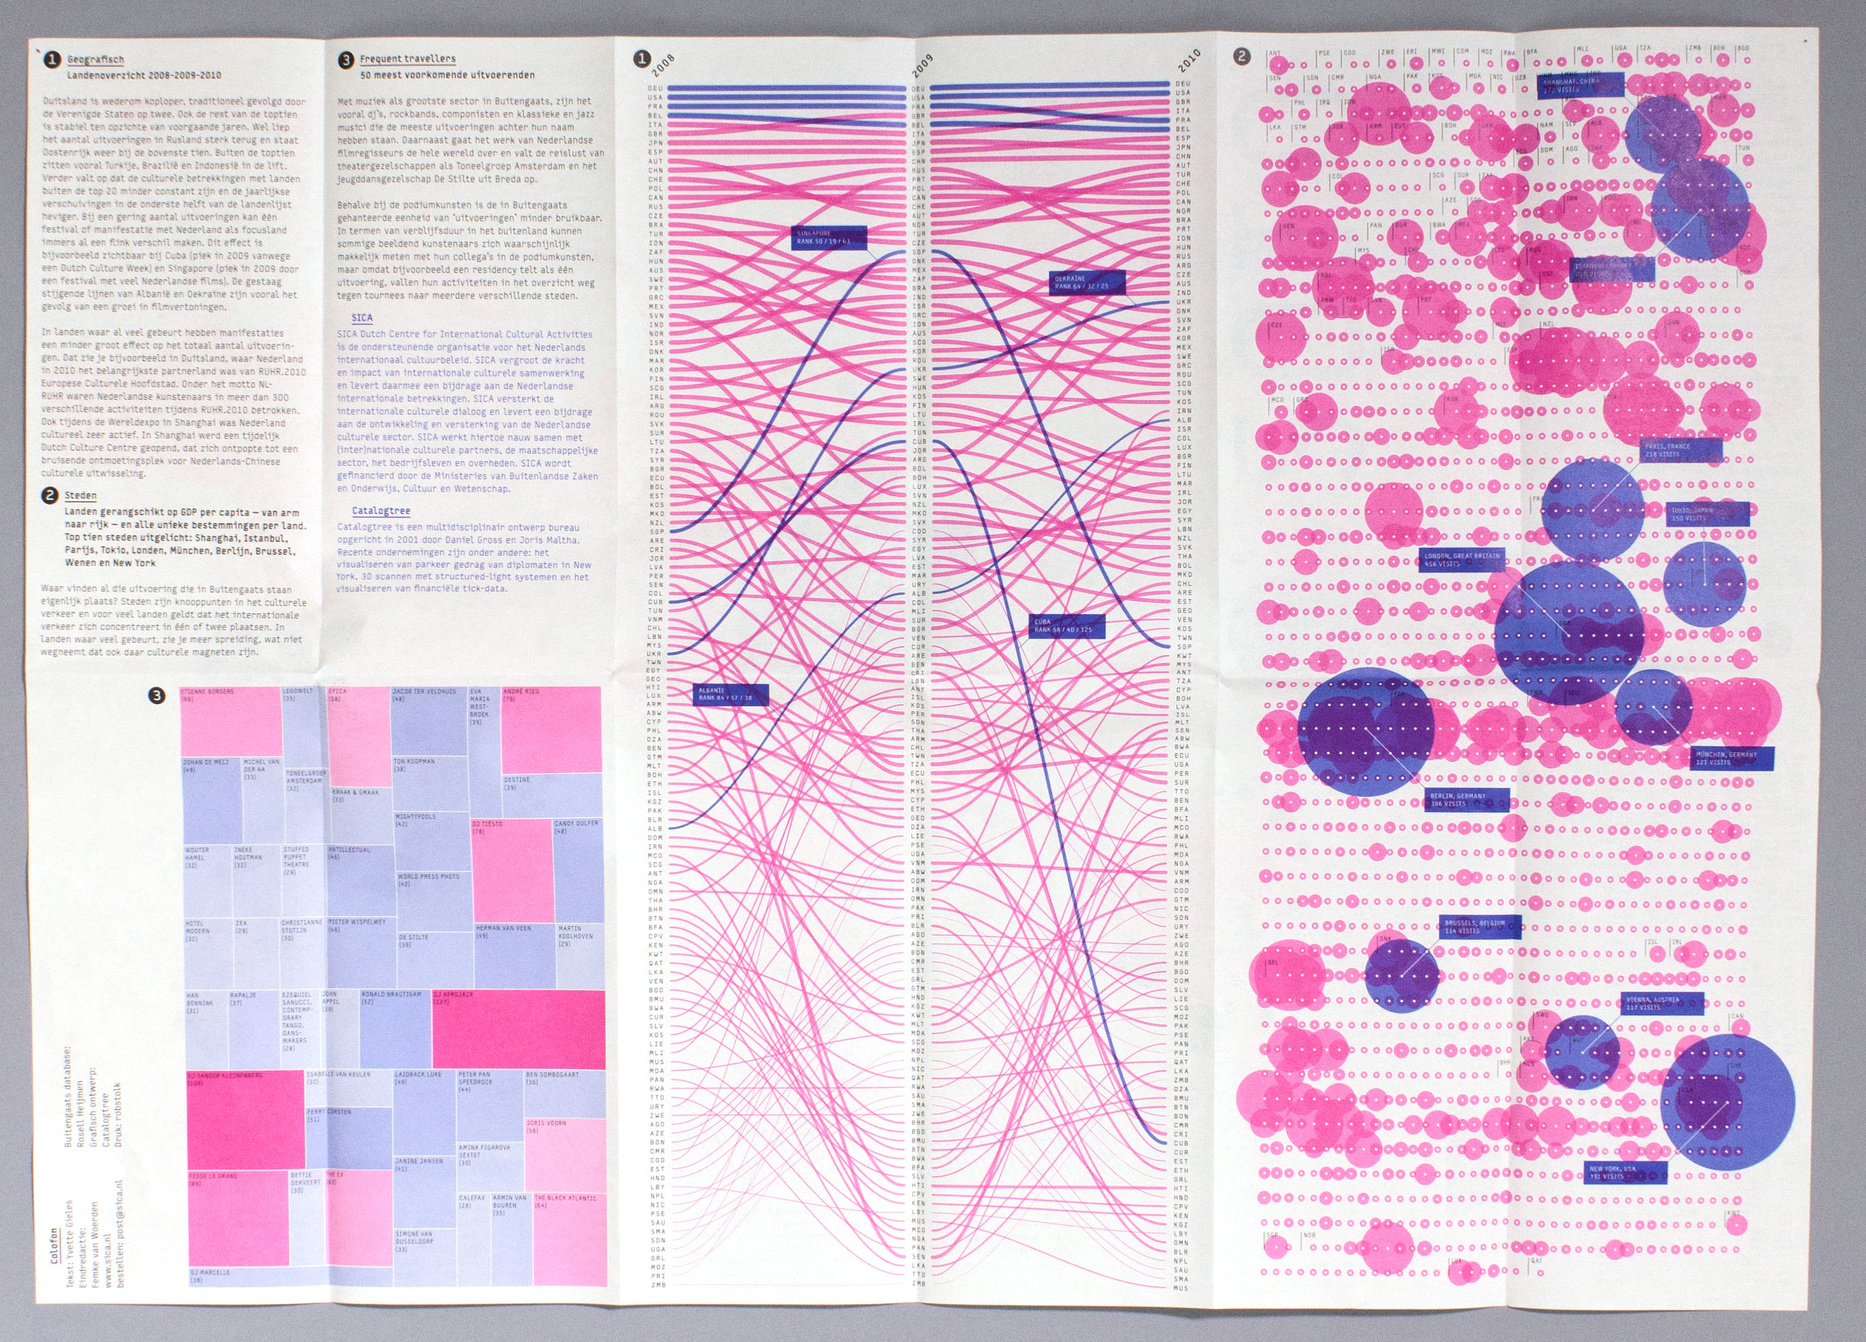
Catalogtree
Catalogtree
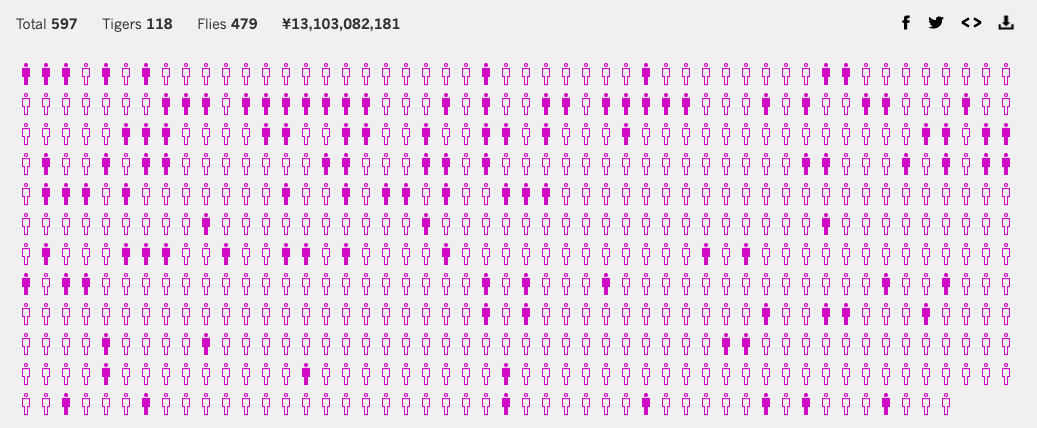
Catching Tigers and Flies Visualization
Schema Design
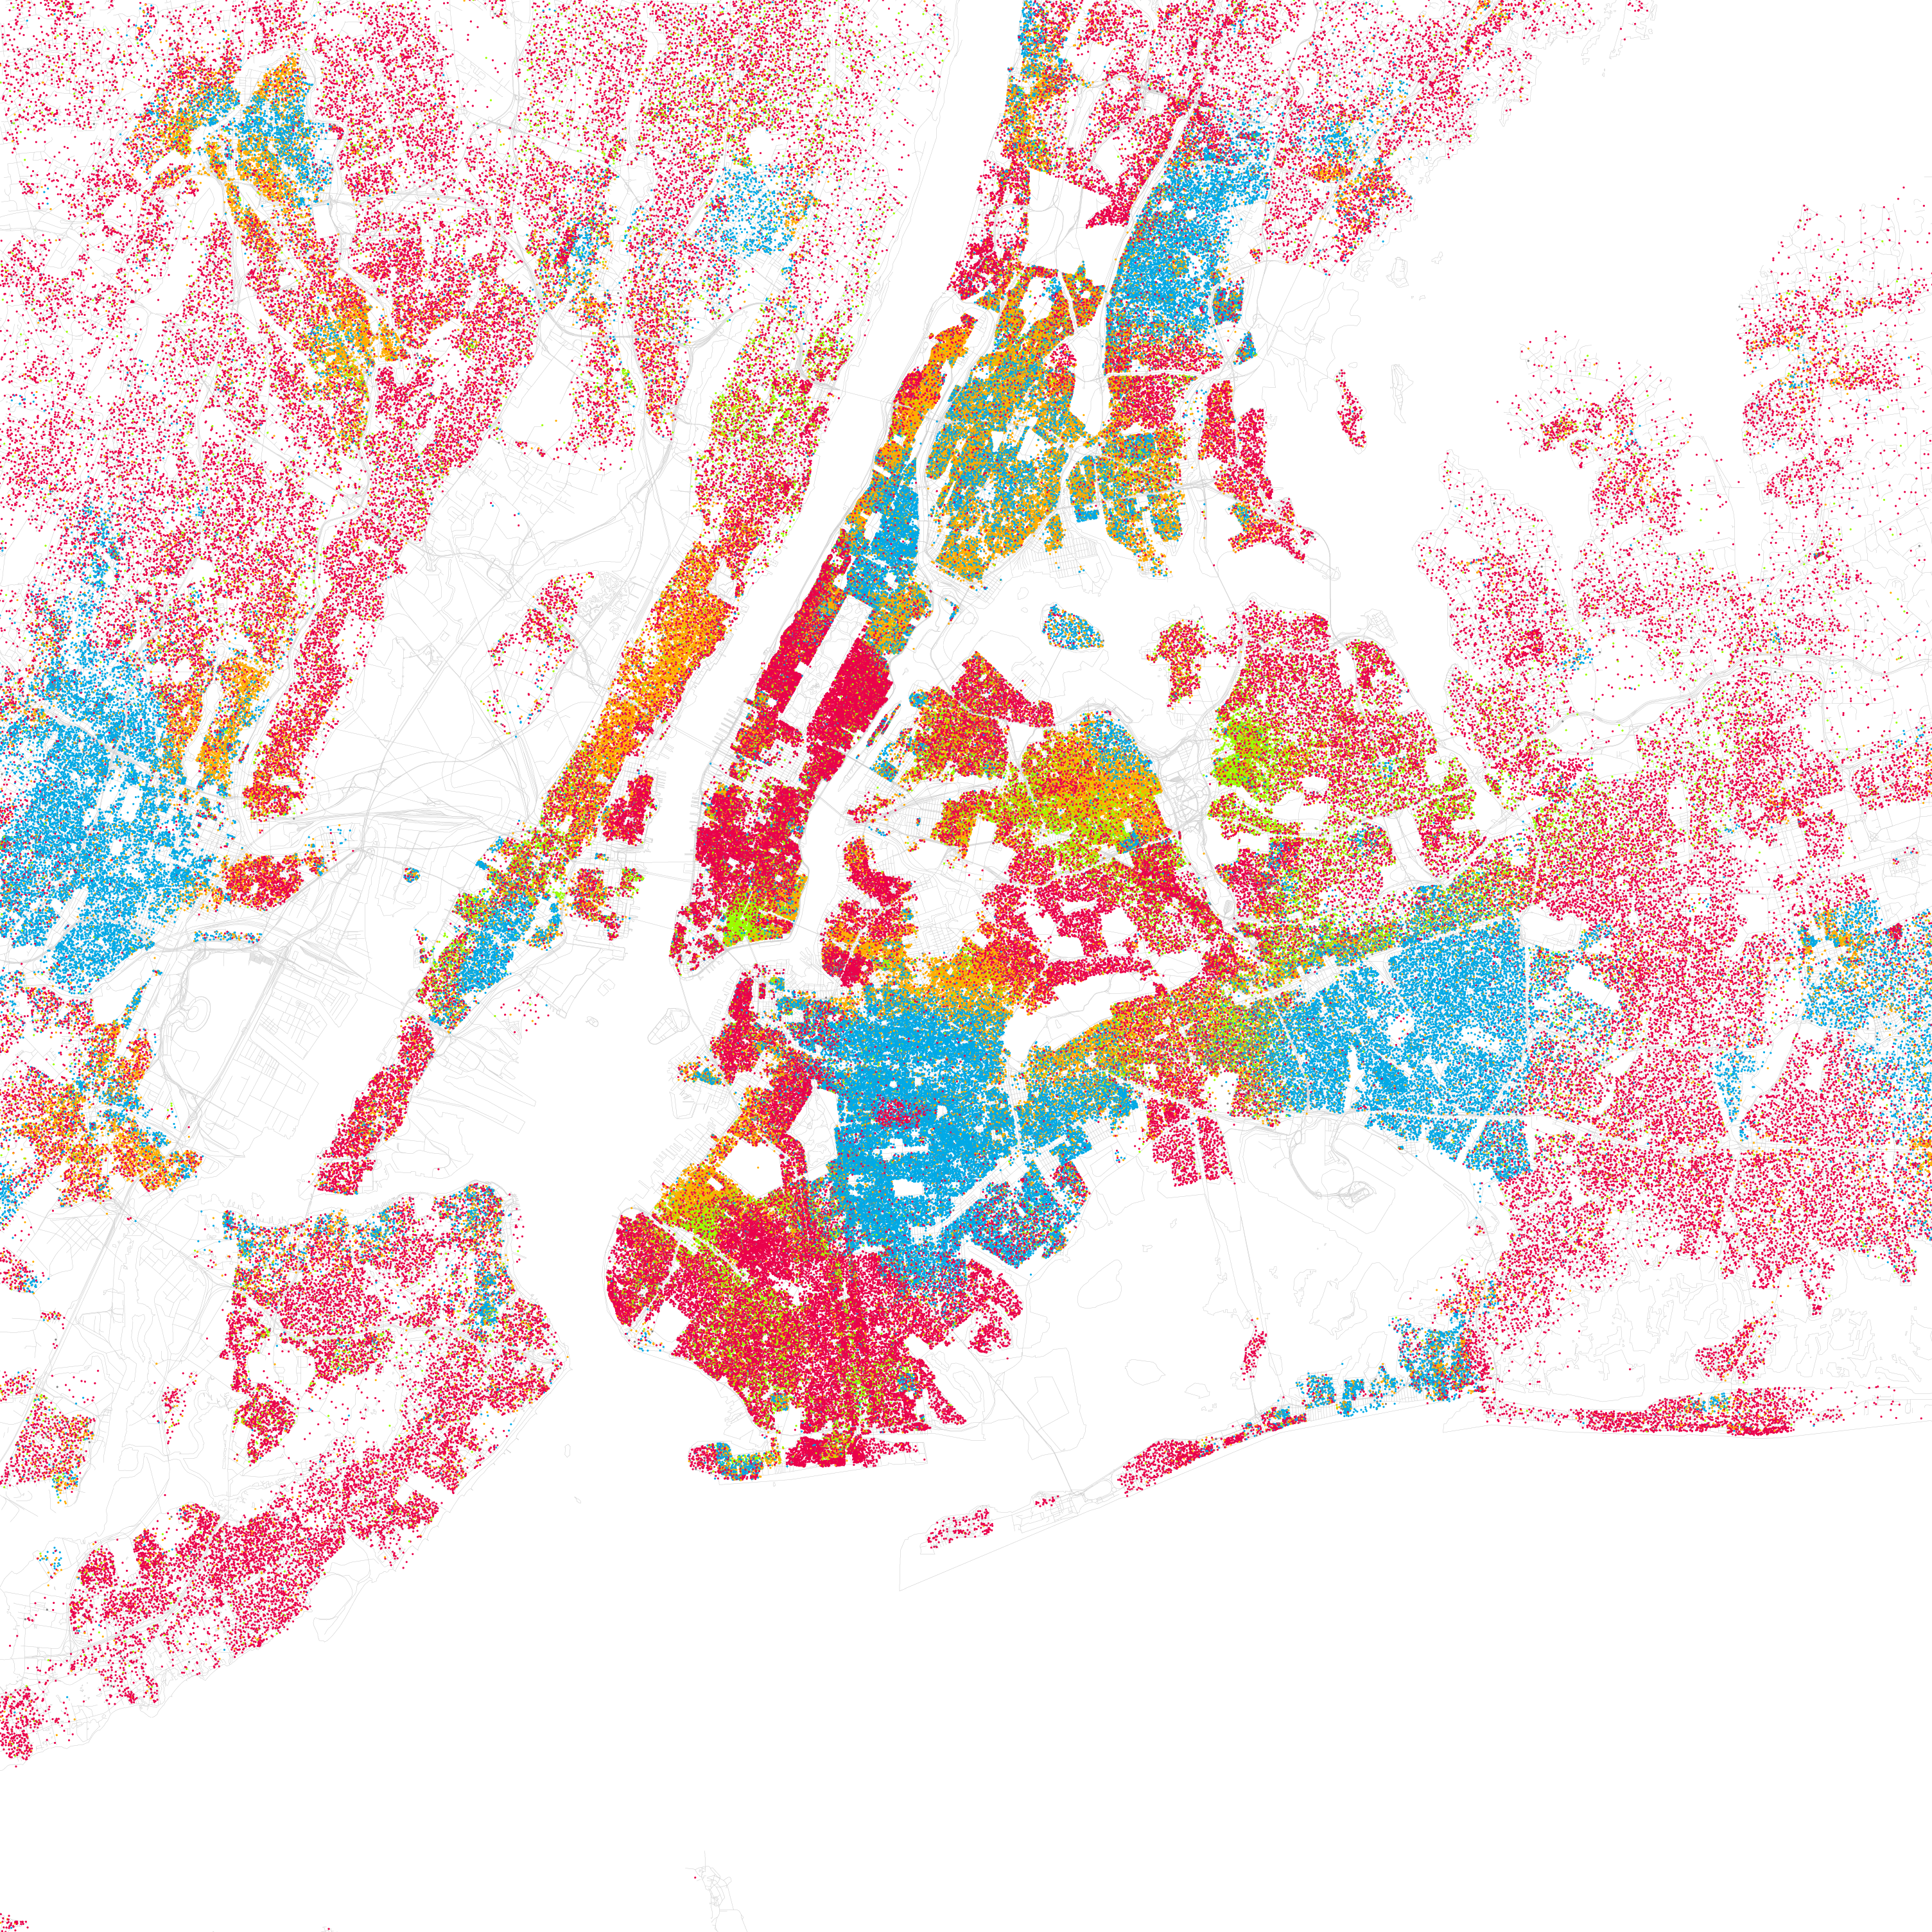
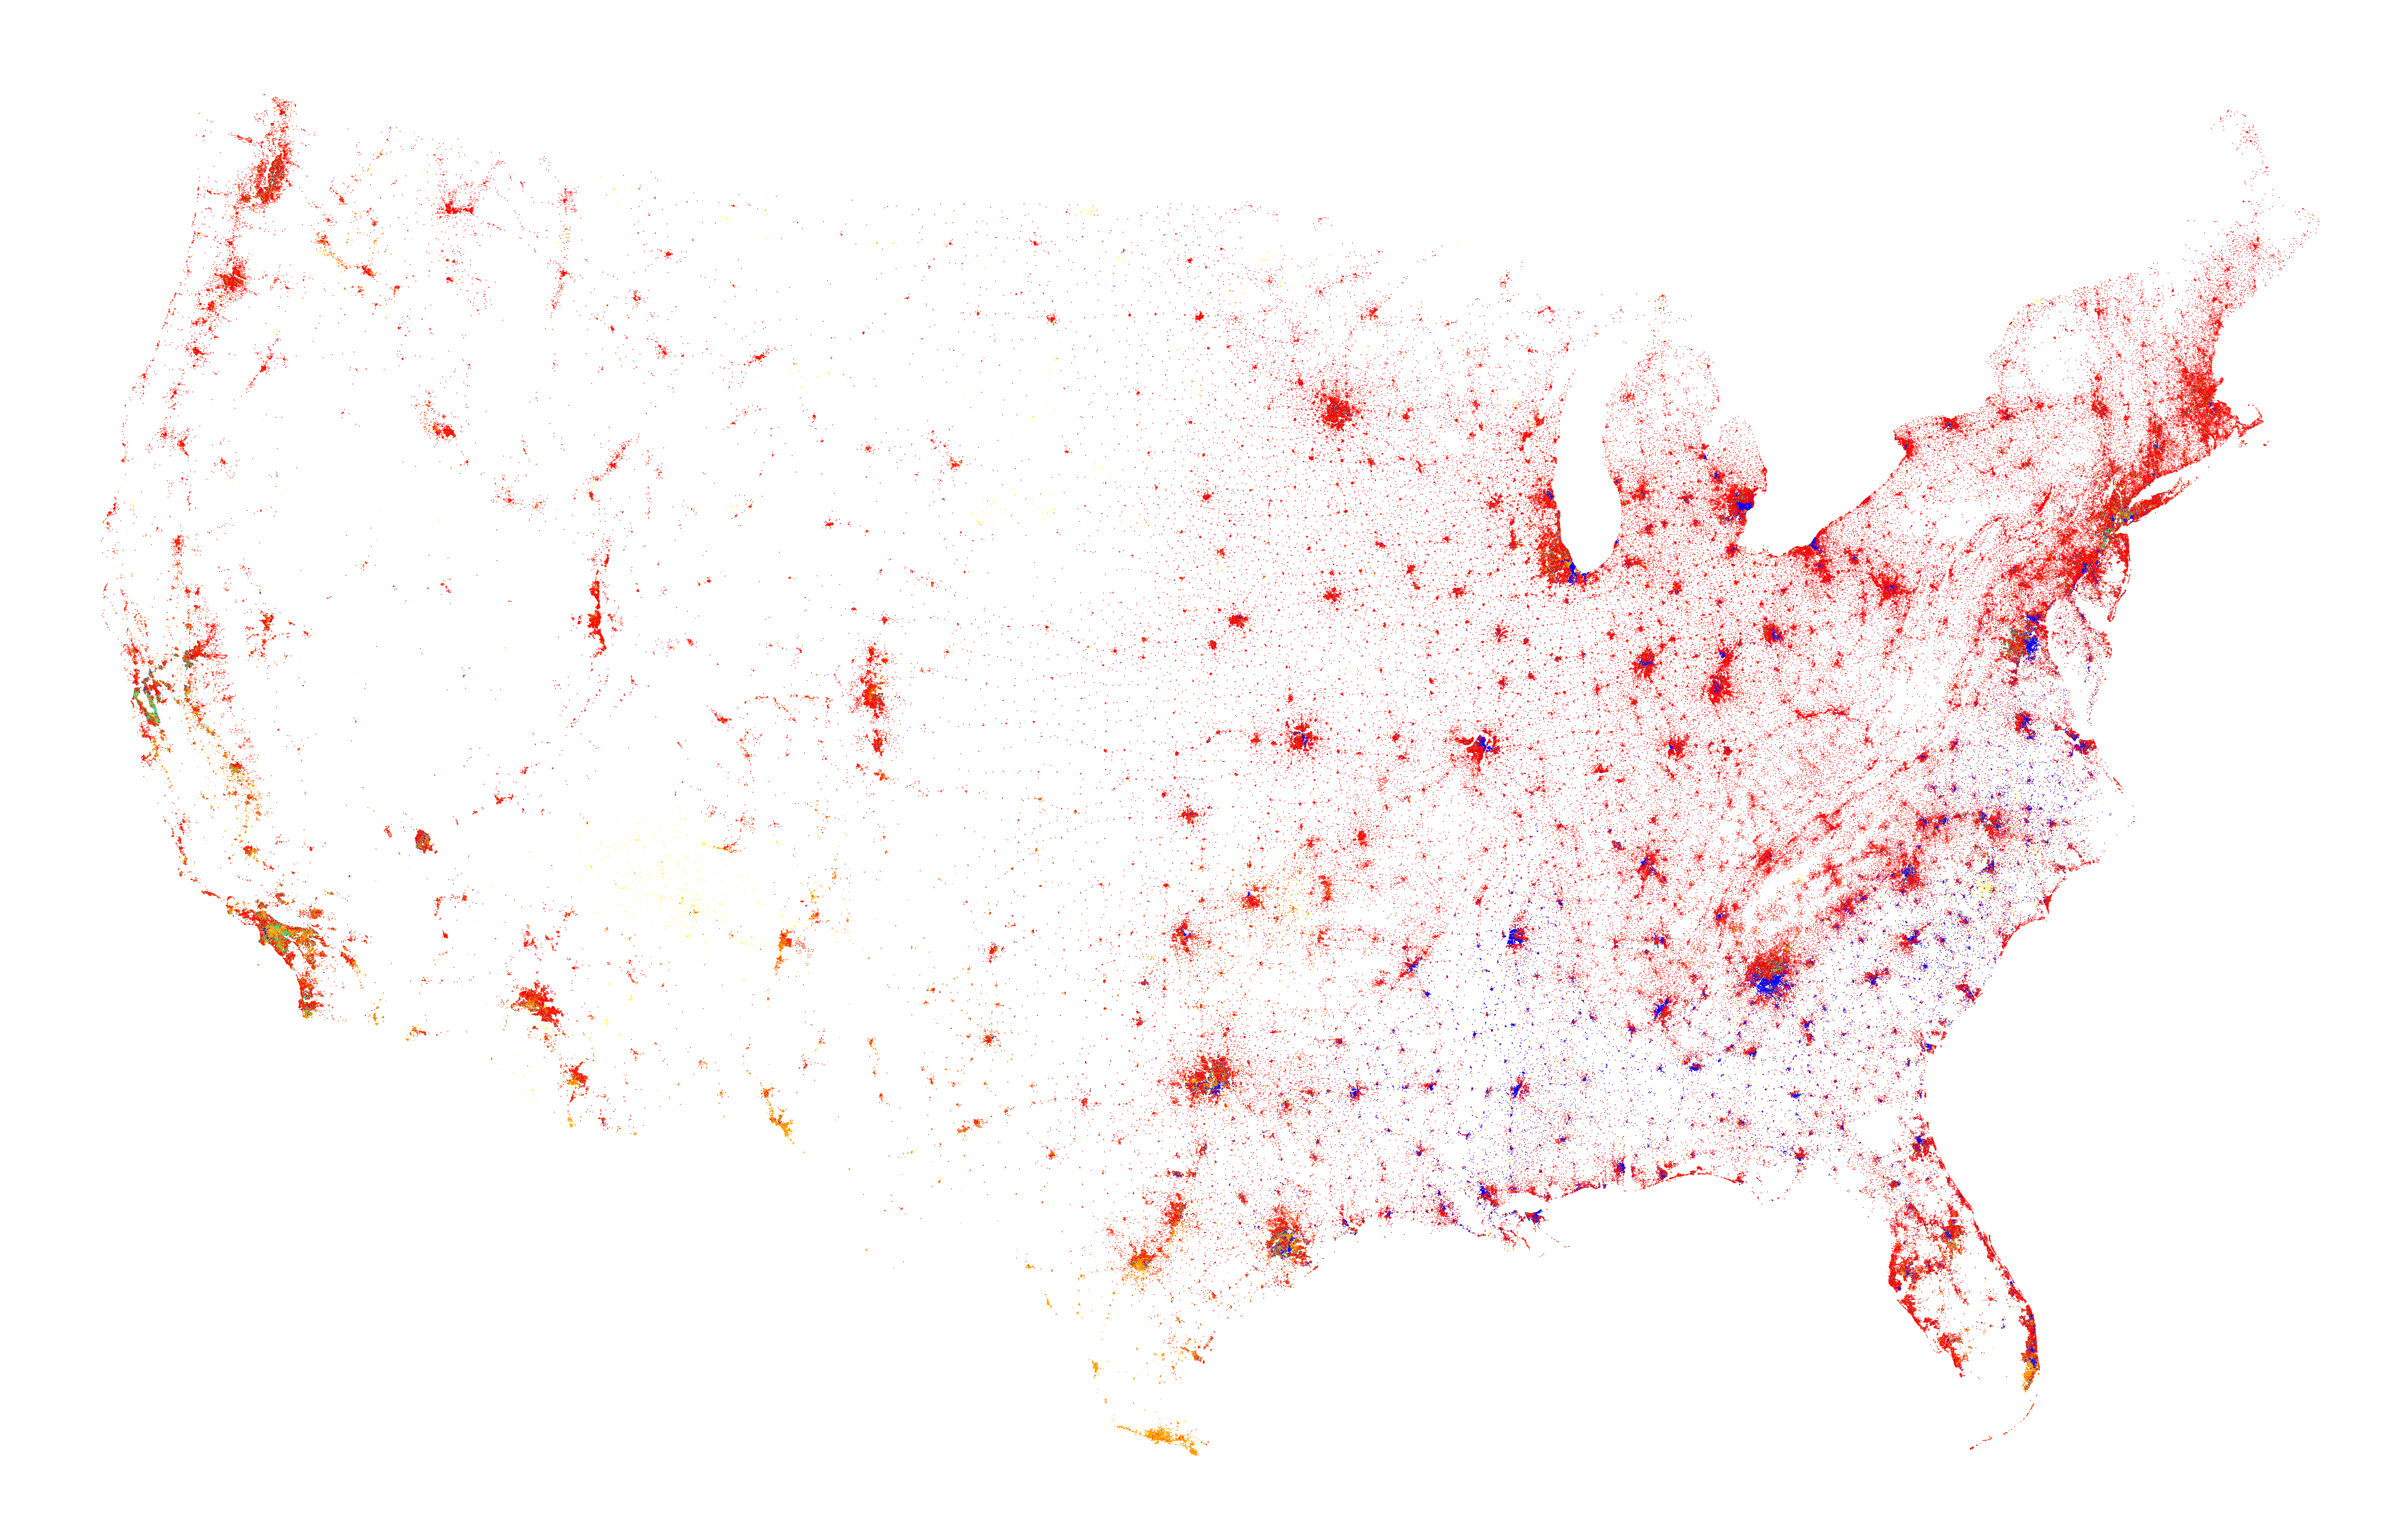
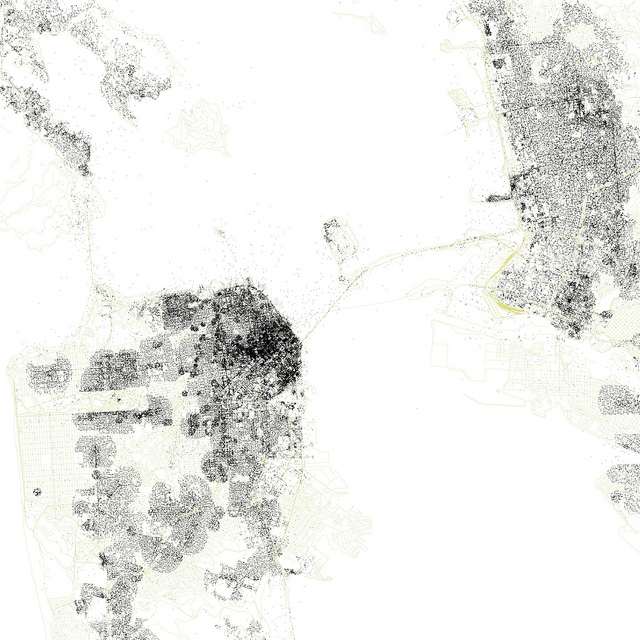
Census Dot Map
Eric Fischer
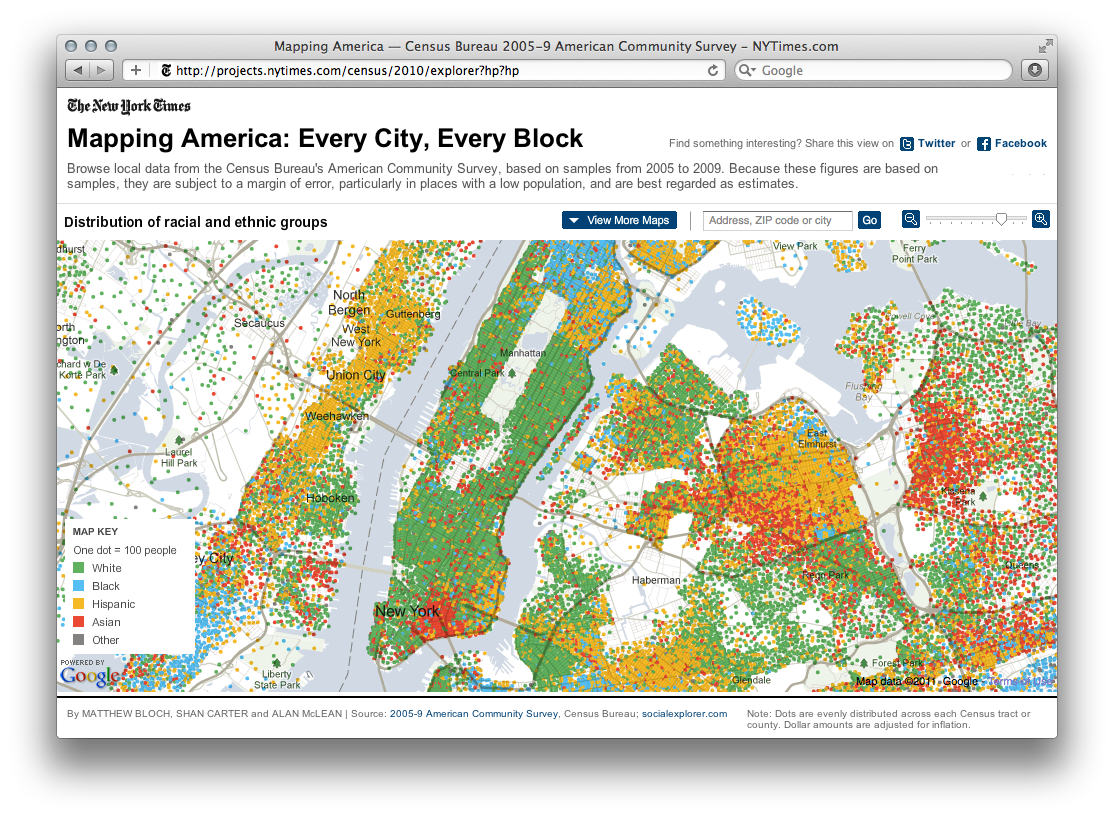
Census Explorer
New York Times Graphics
Cheng Iraq Casualties
Mike Cheng
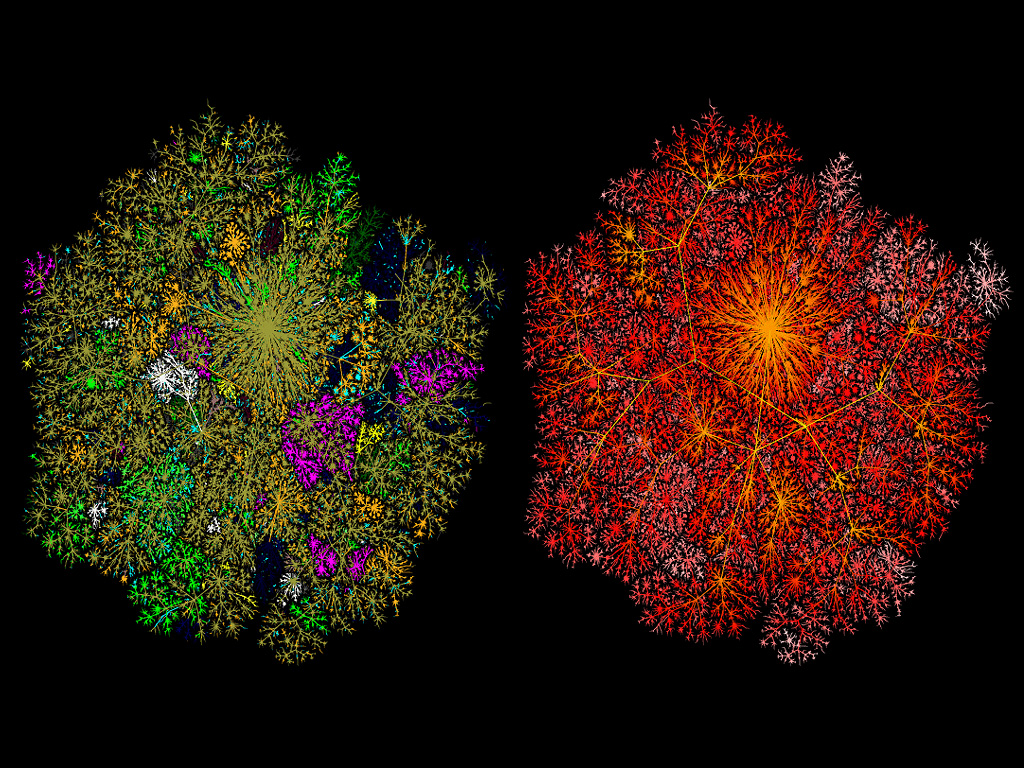
Cheswick Internet Map
Bill Cheswick

Chicago Loop
Jason Salavon
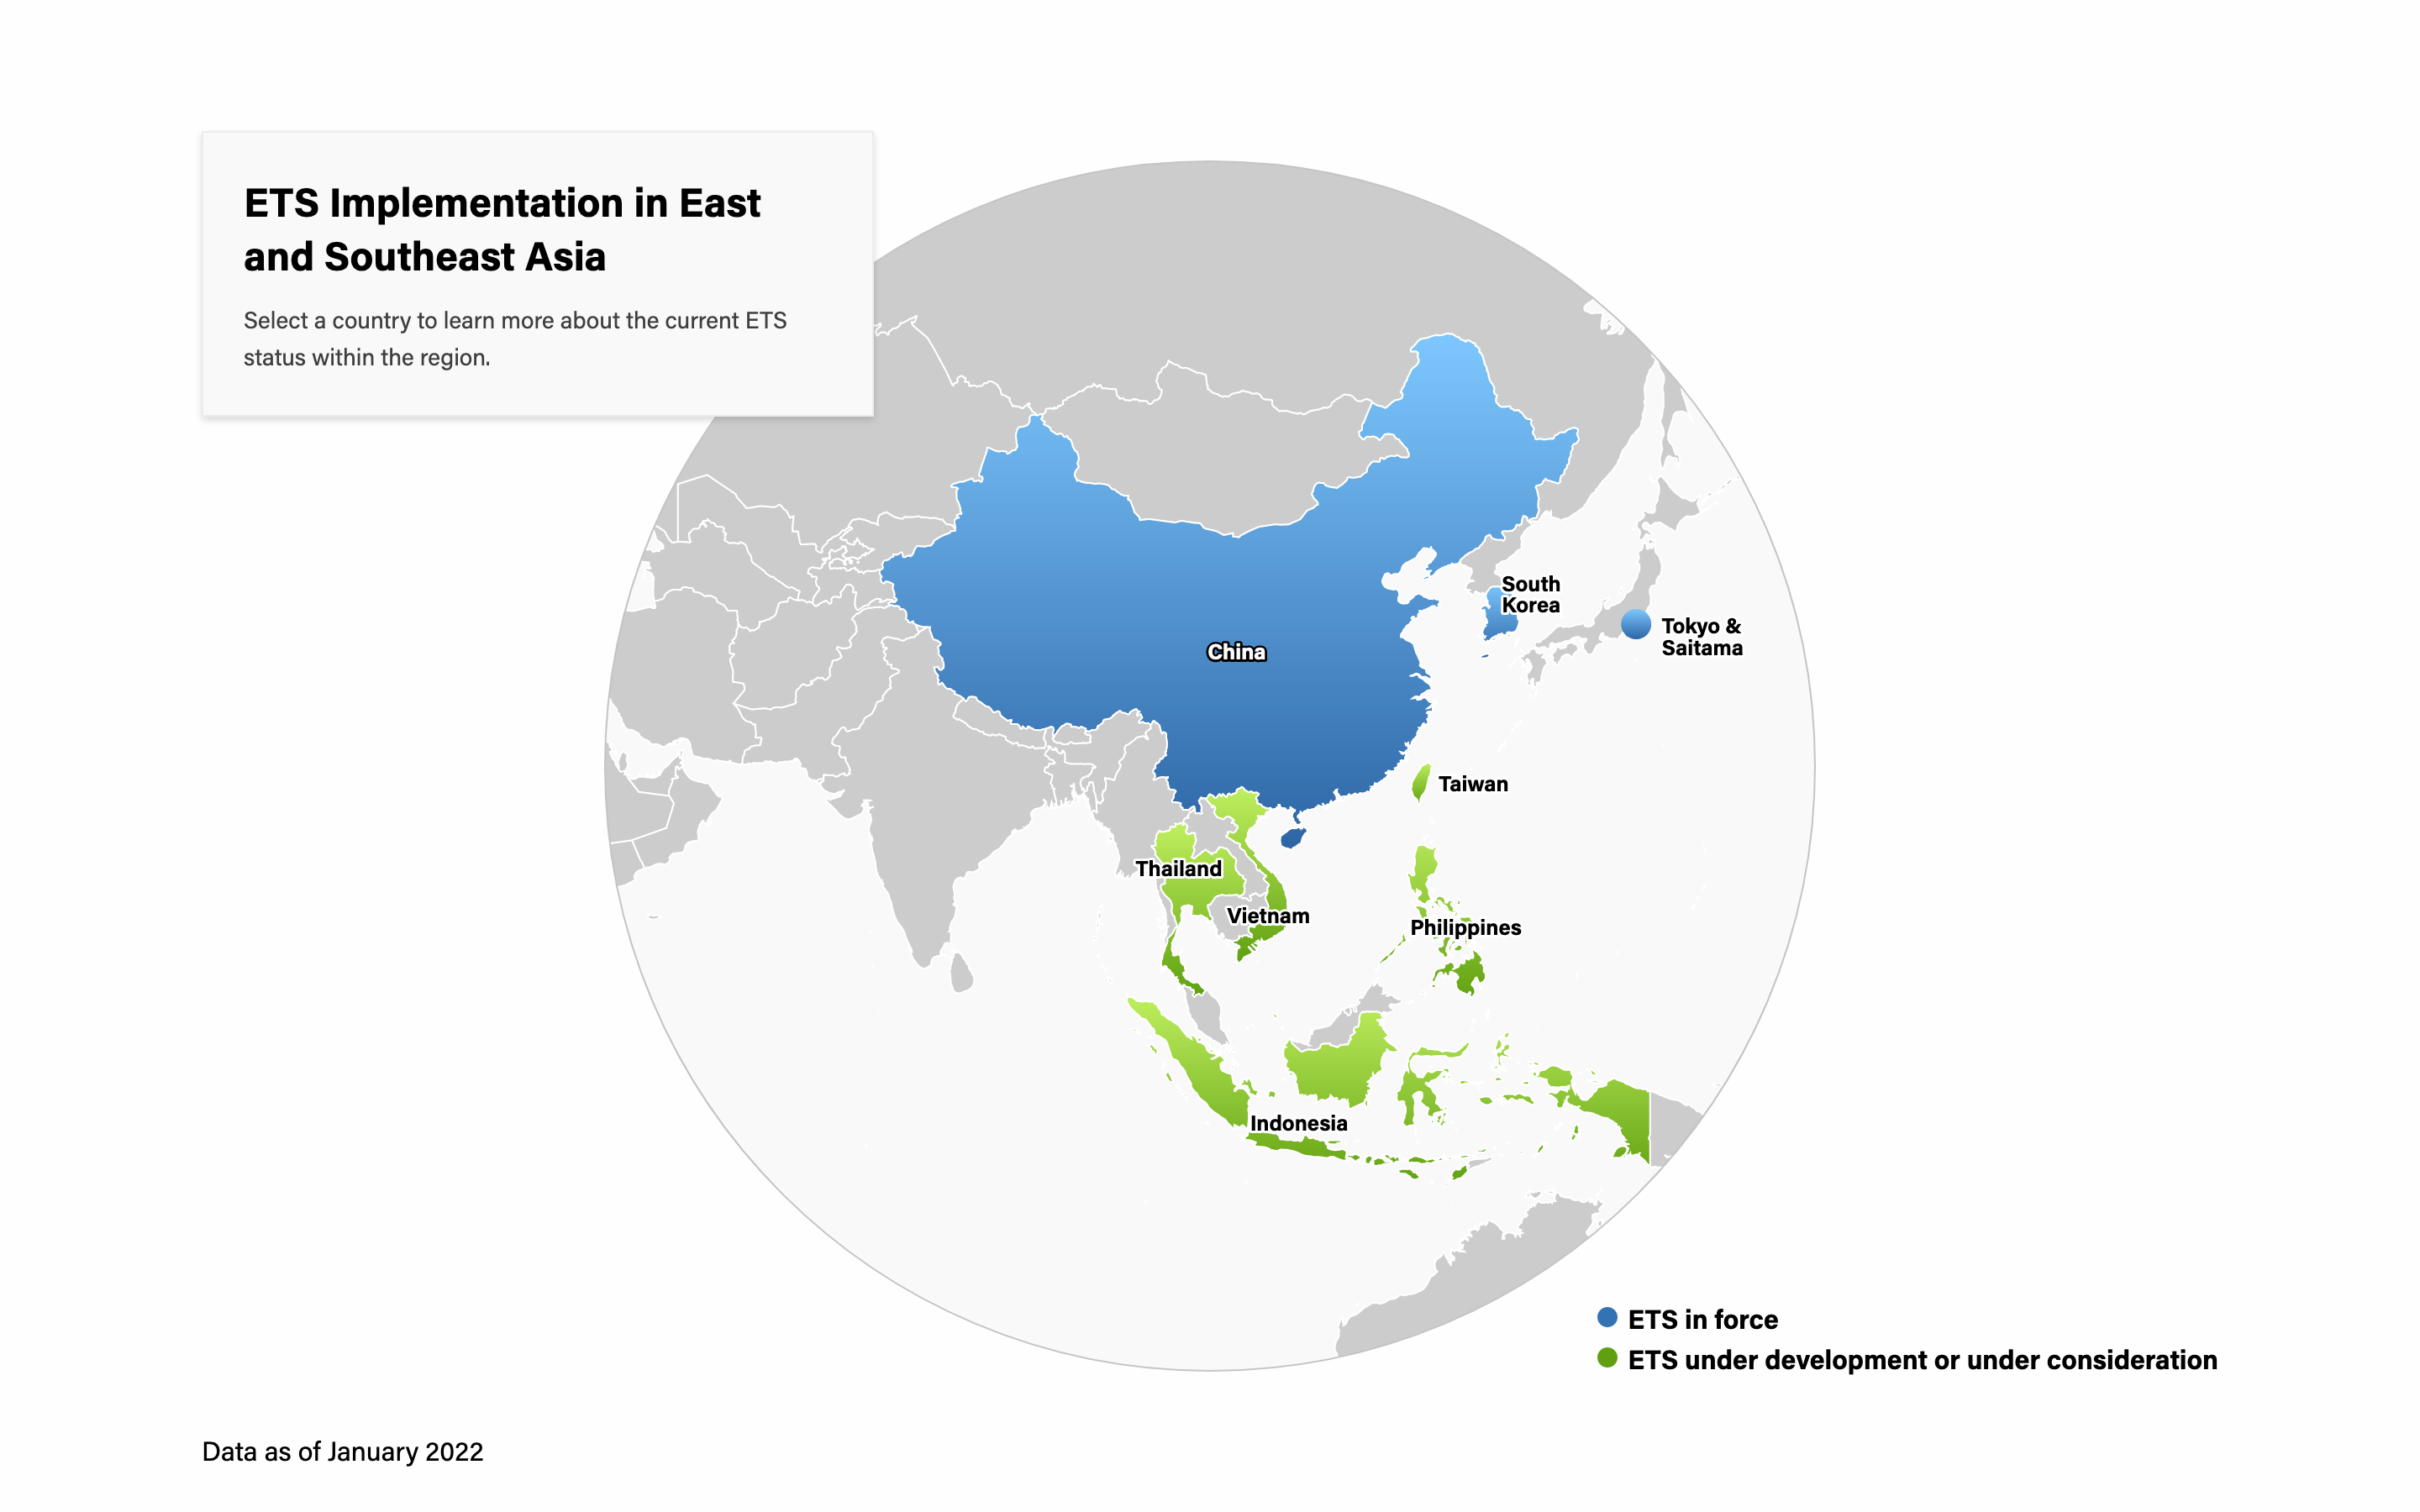
Chinese Emissions Trading System Interactive Map (Building the Chinese Carbon Market and Its Regional Connections)
Asia Society
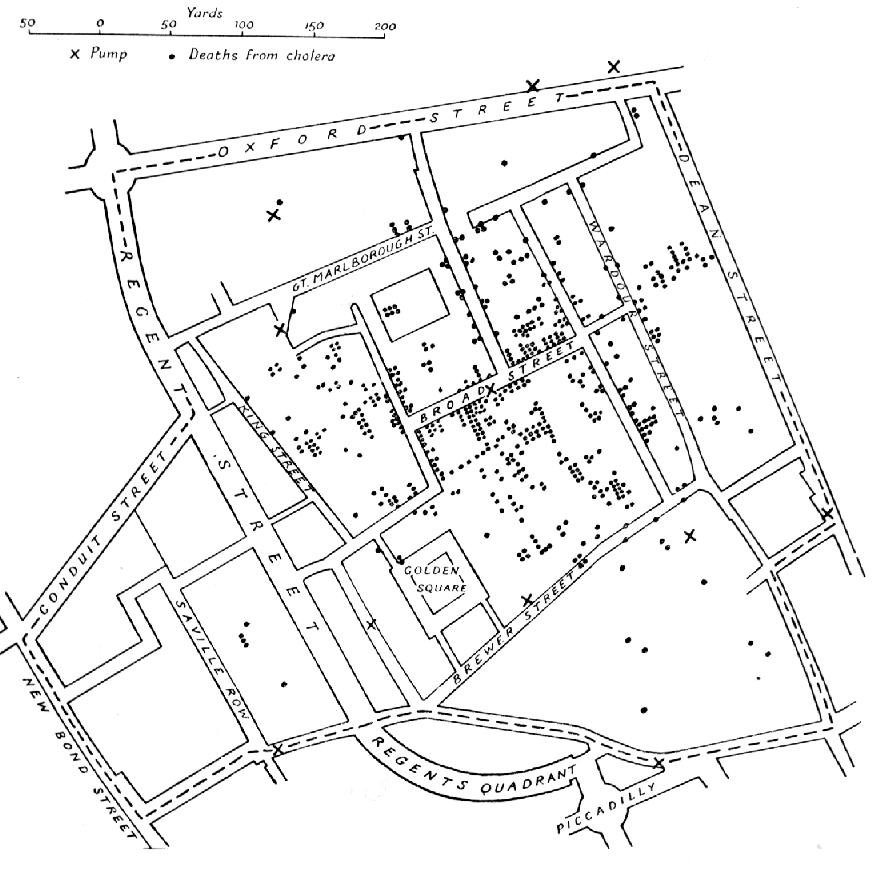
Cholera Map
John Snow
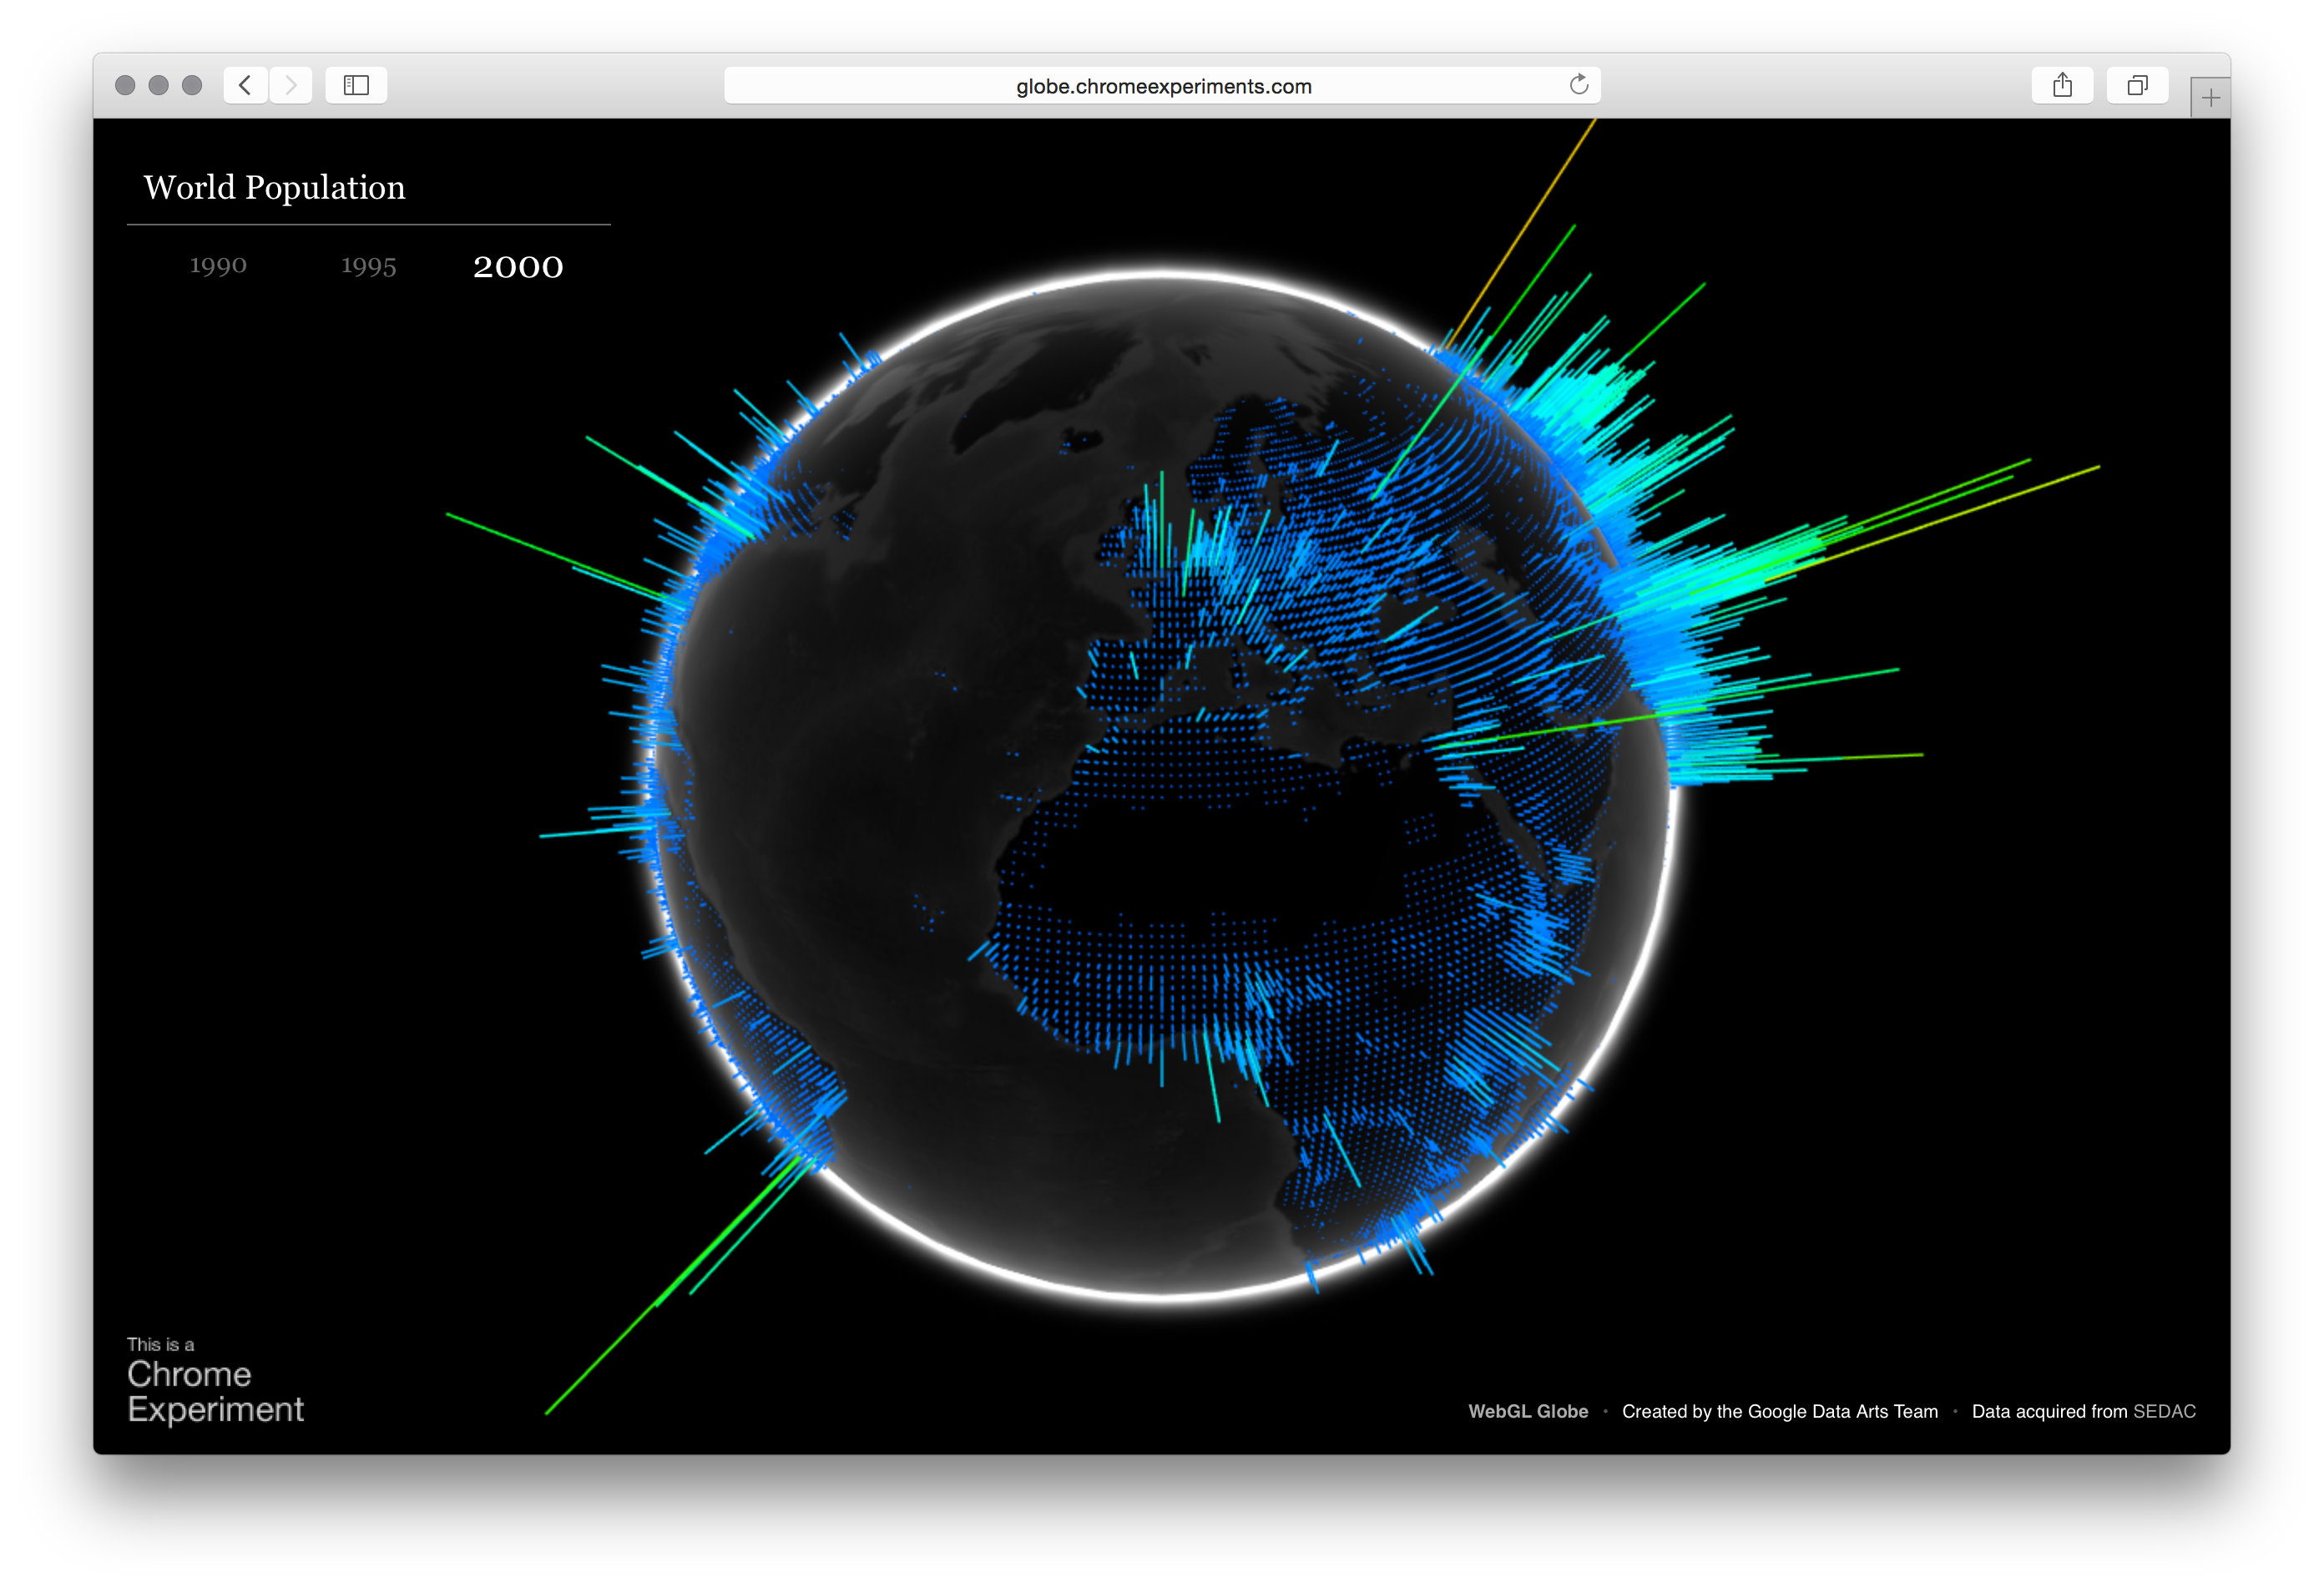
Chrome Experiments
Cinq: Care Platform, Niacare 360
Schema Design
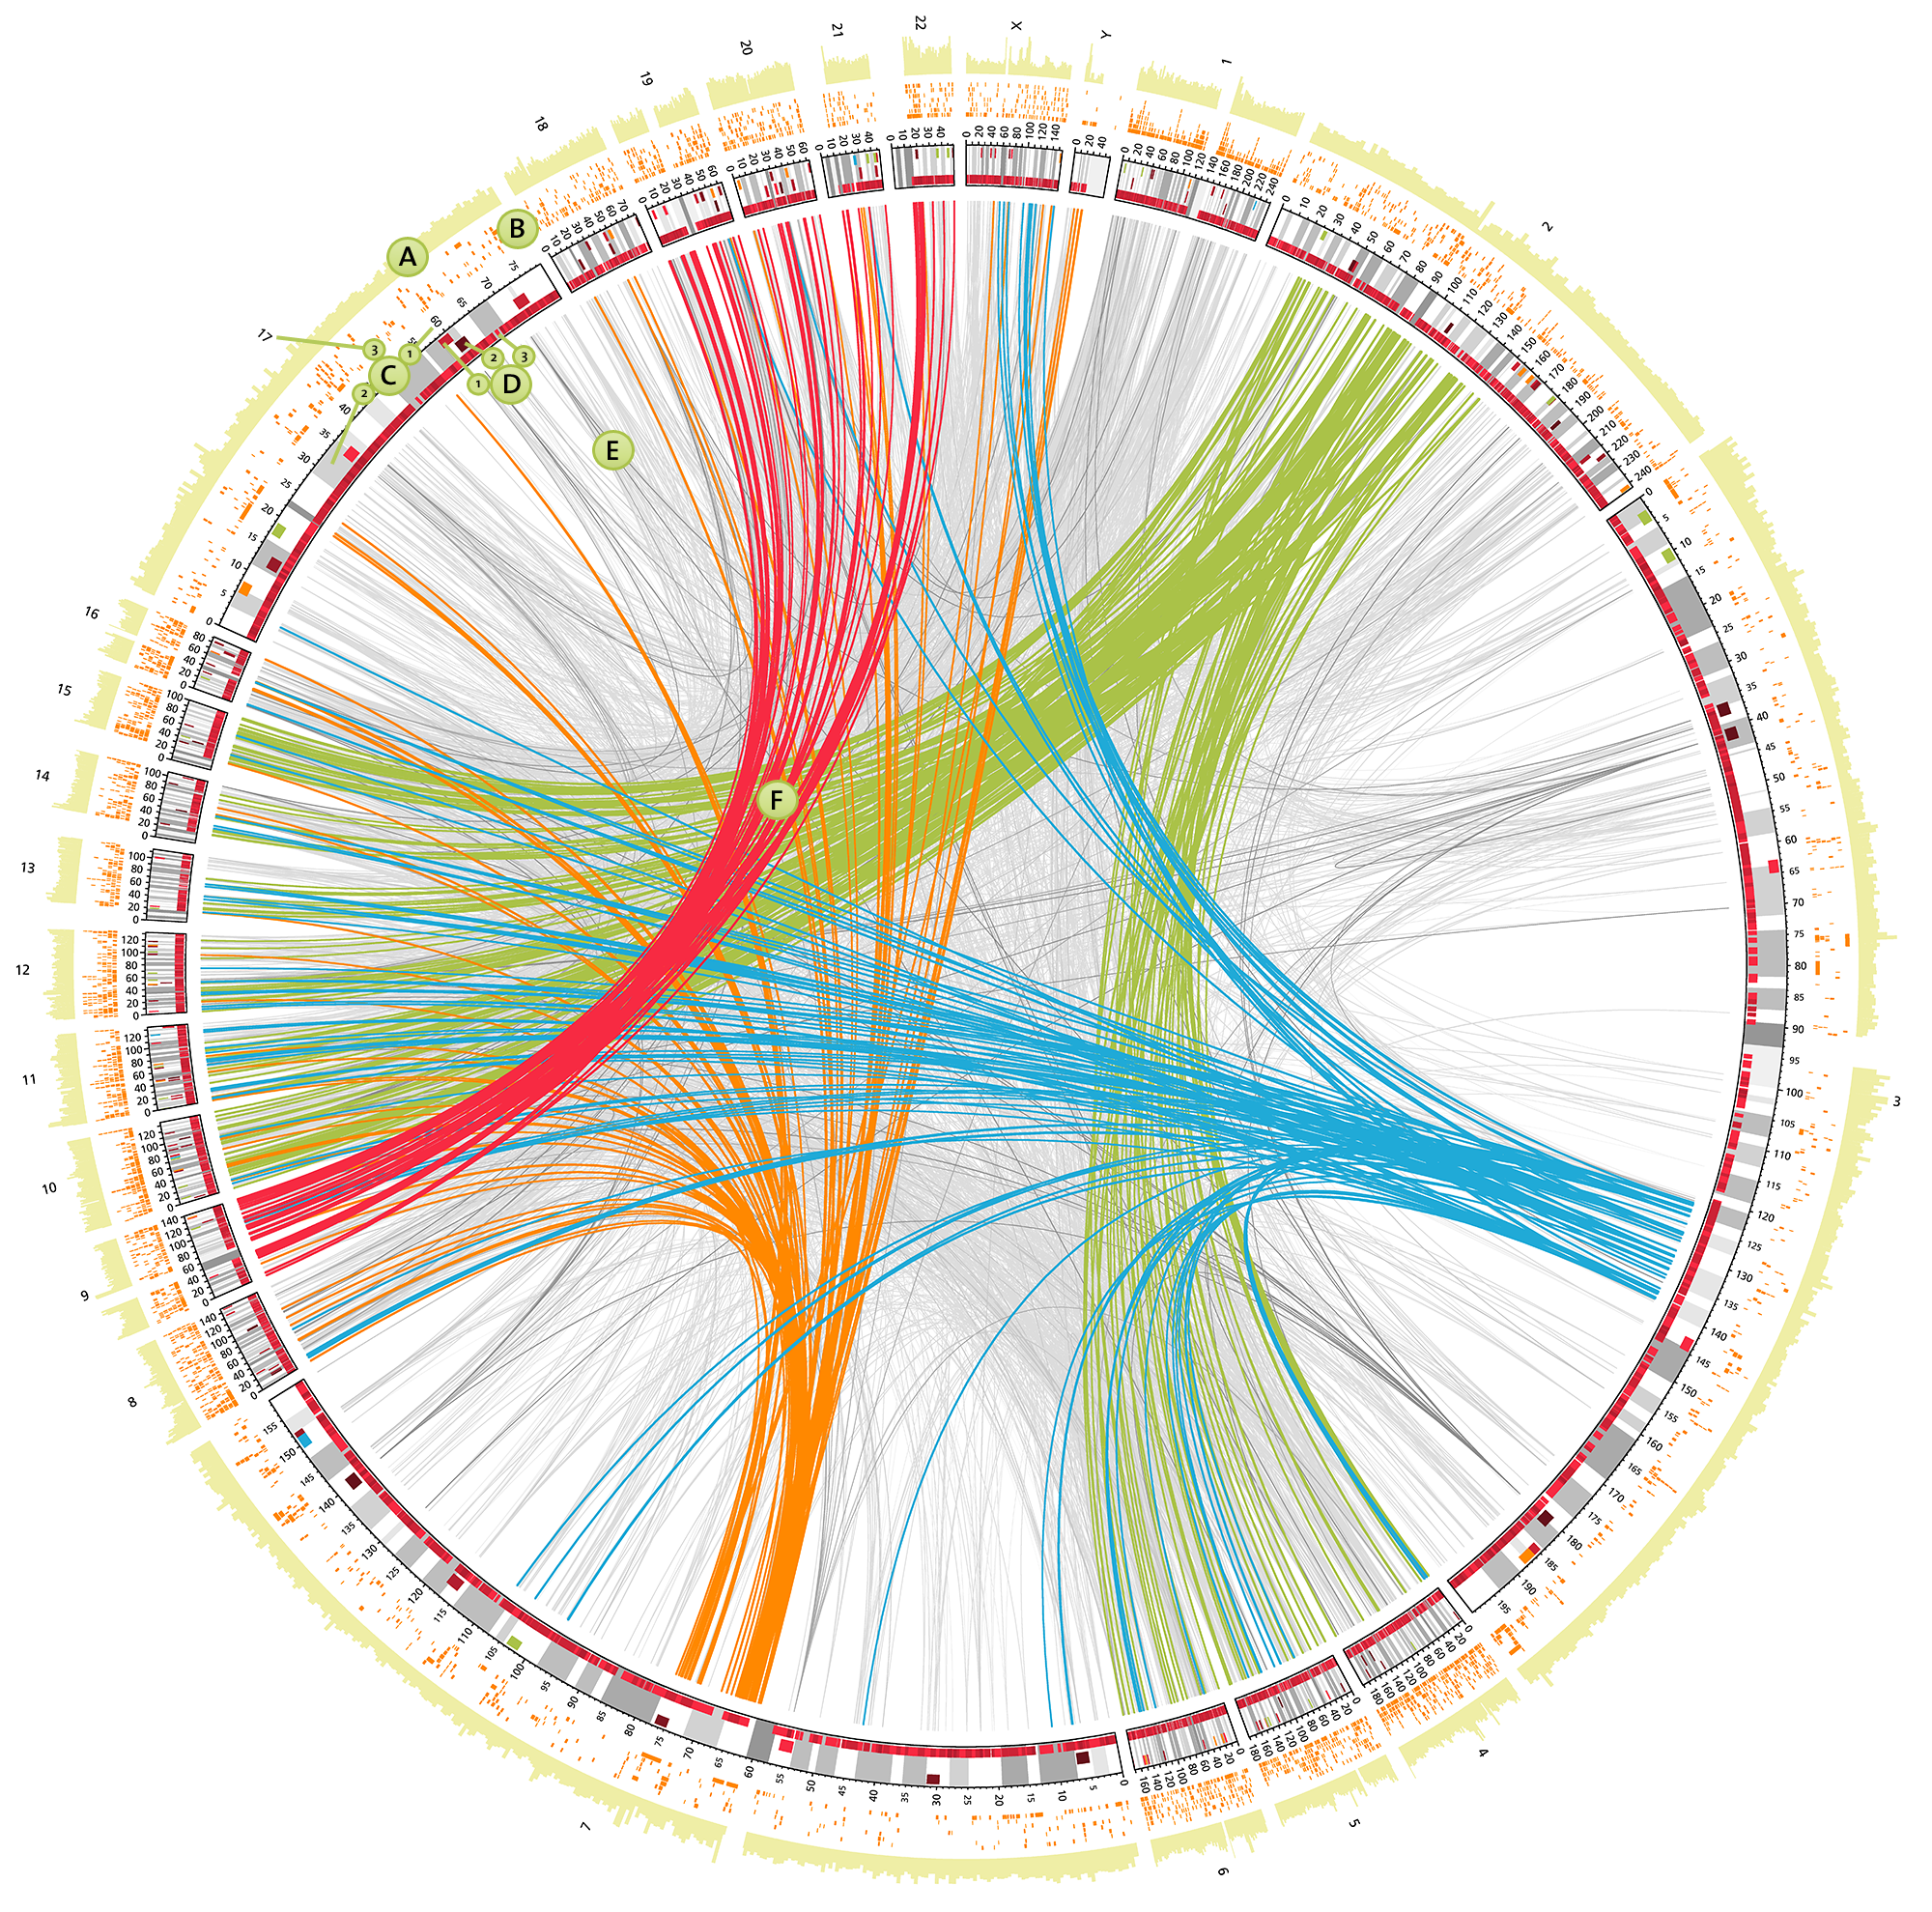
Circos
Martin Krzywinski
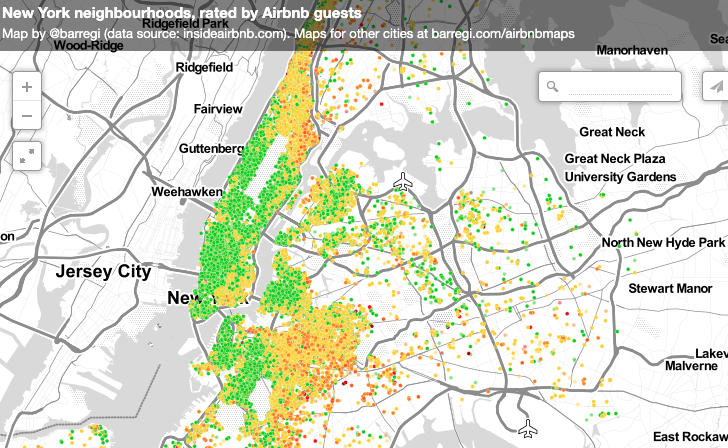
City Maps from Tourists' Feelings, by Beñat Arregi
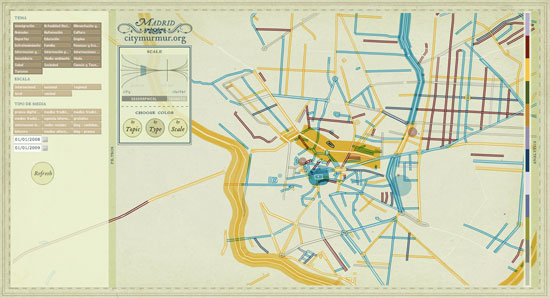
City Murmer
Writing Academic English
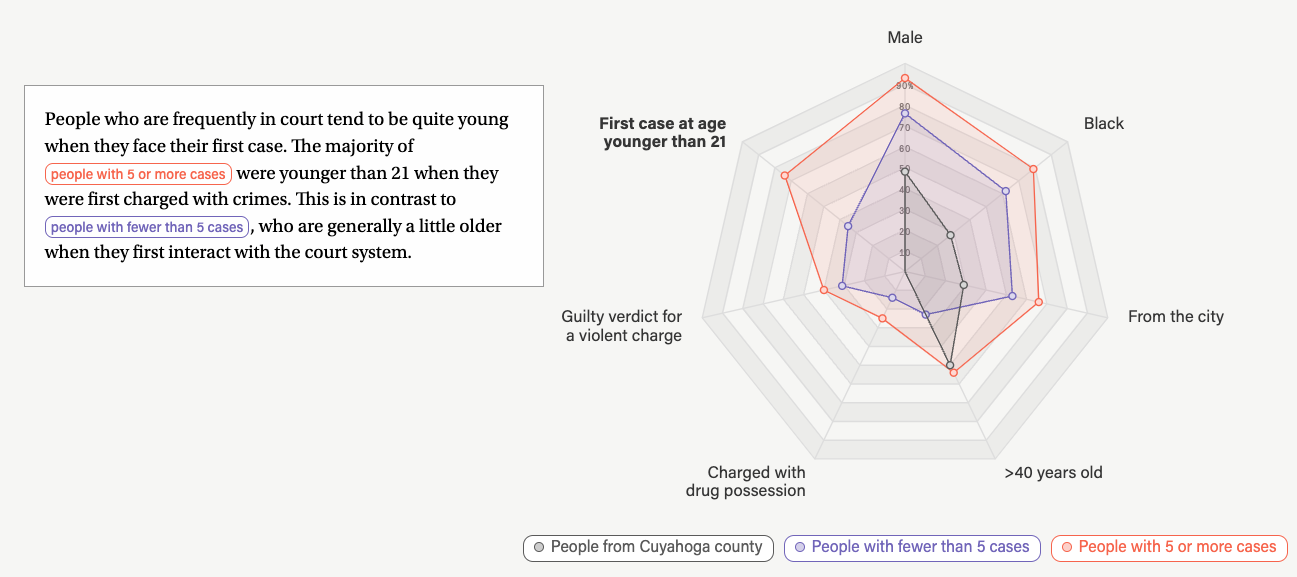
Cleveland Courts’ Revolving Door in One Chart
The Marshall Project
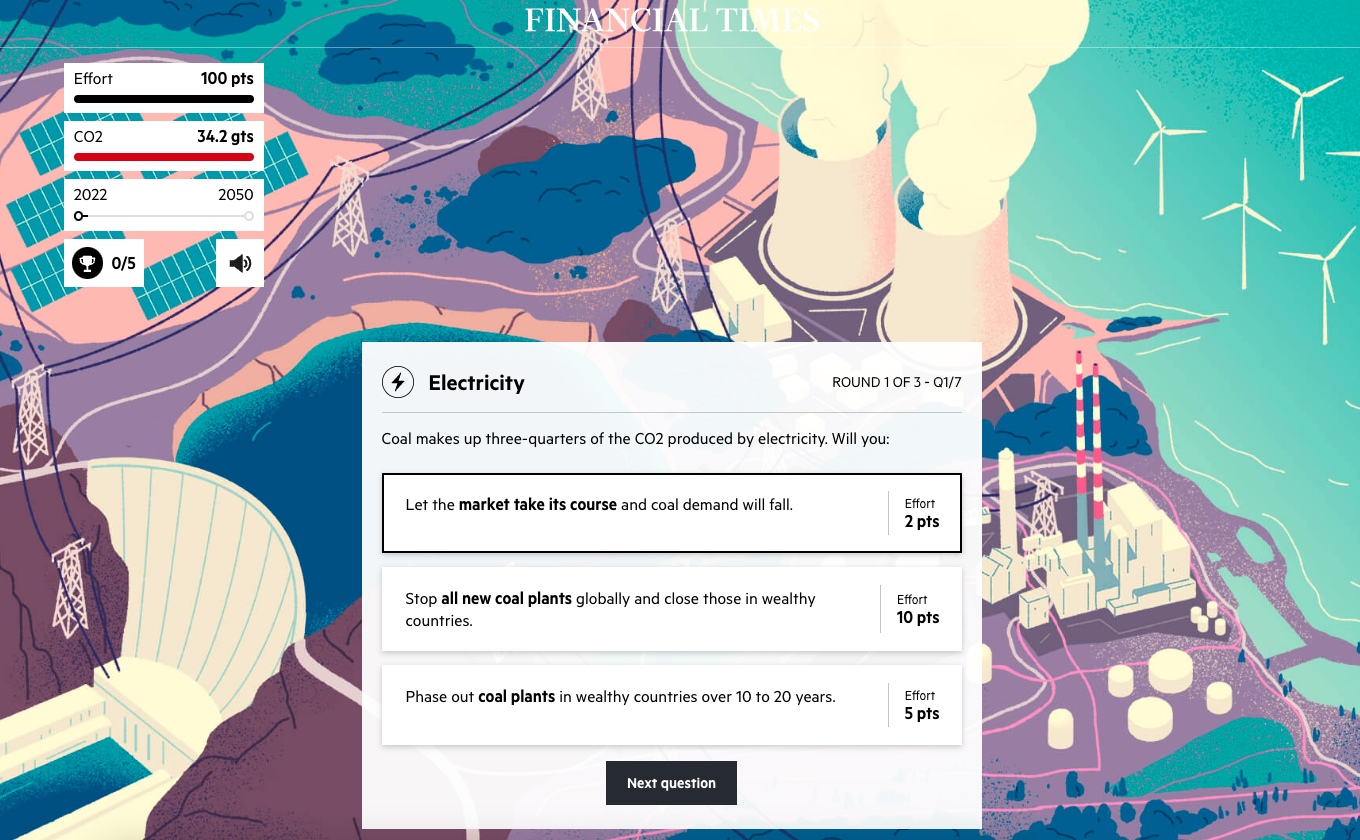
Climate Game
Climate—conflict—vulnerability Index
Climate Security Mechanism

CloudMedX
CNN Casualties
Stamen Design
Coda Story

Codex Atlanticus
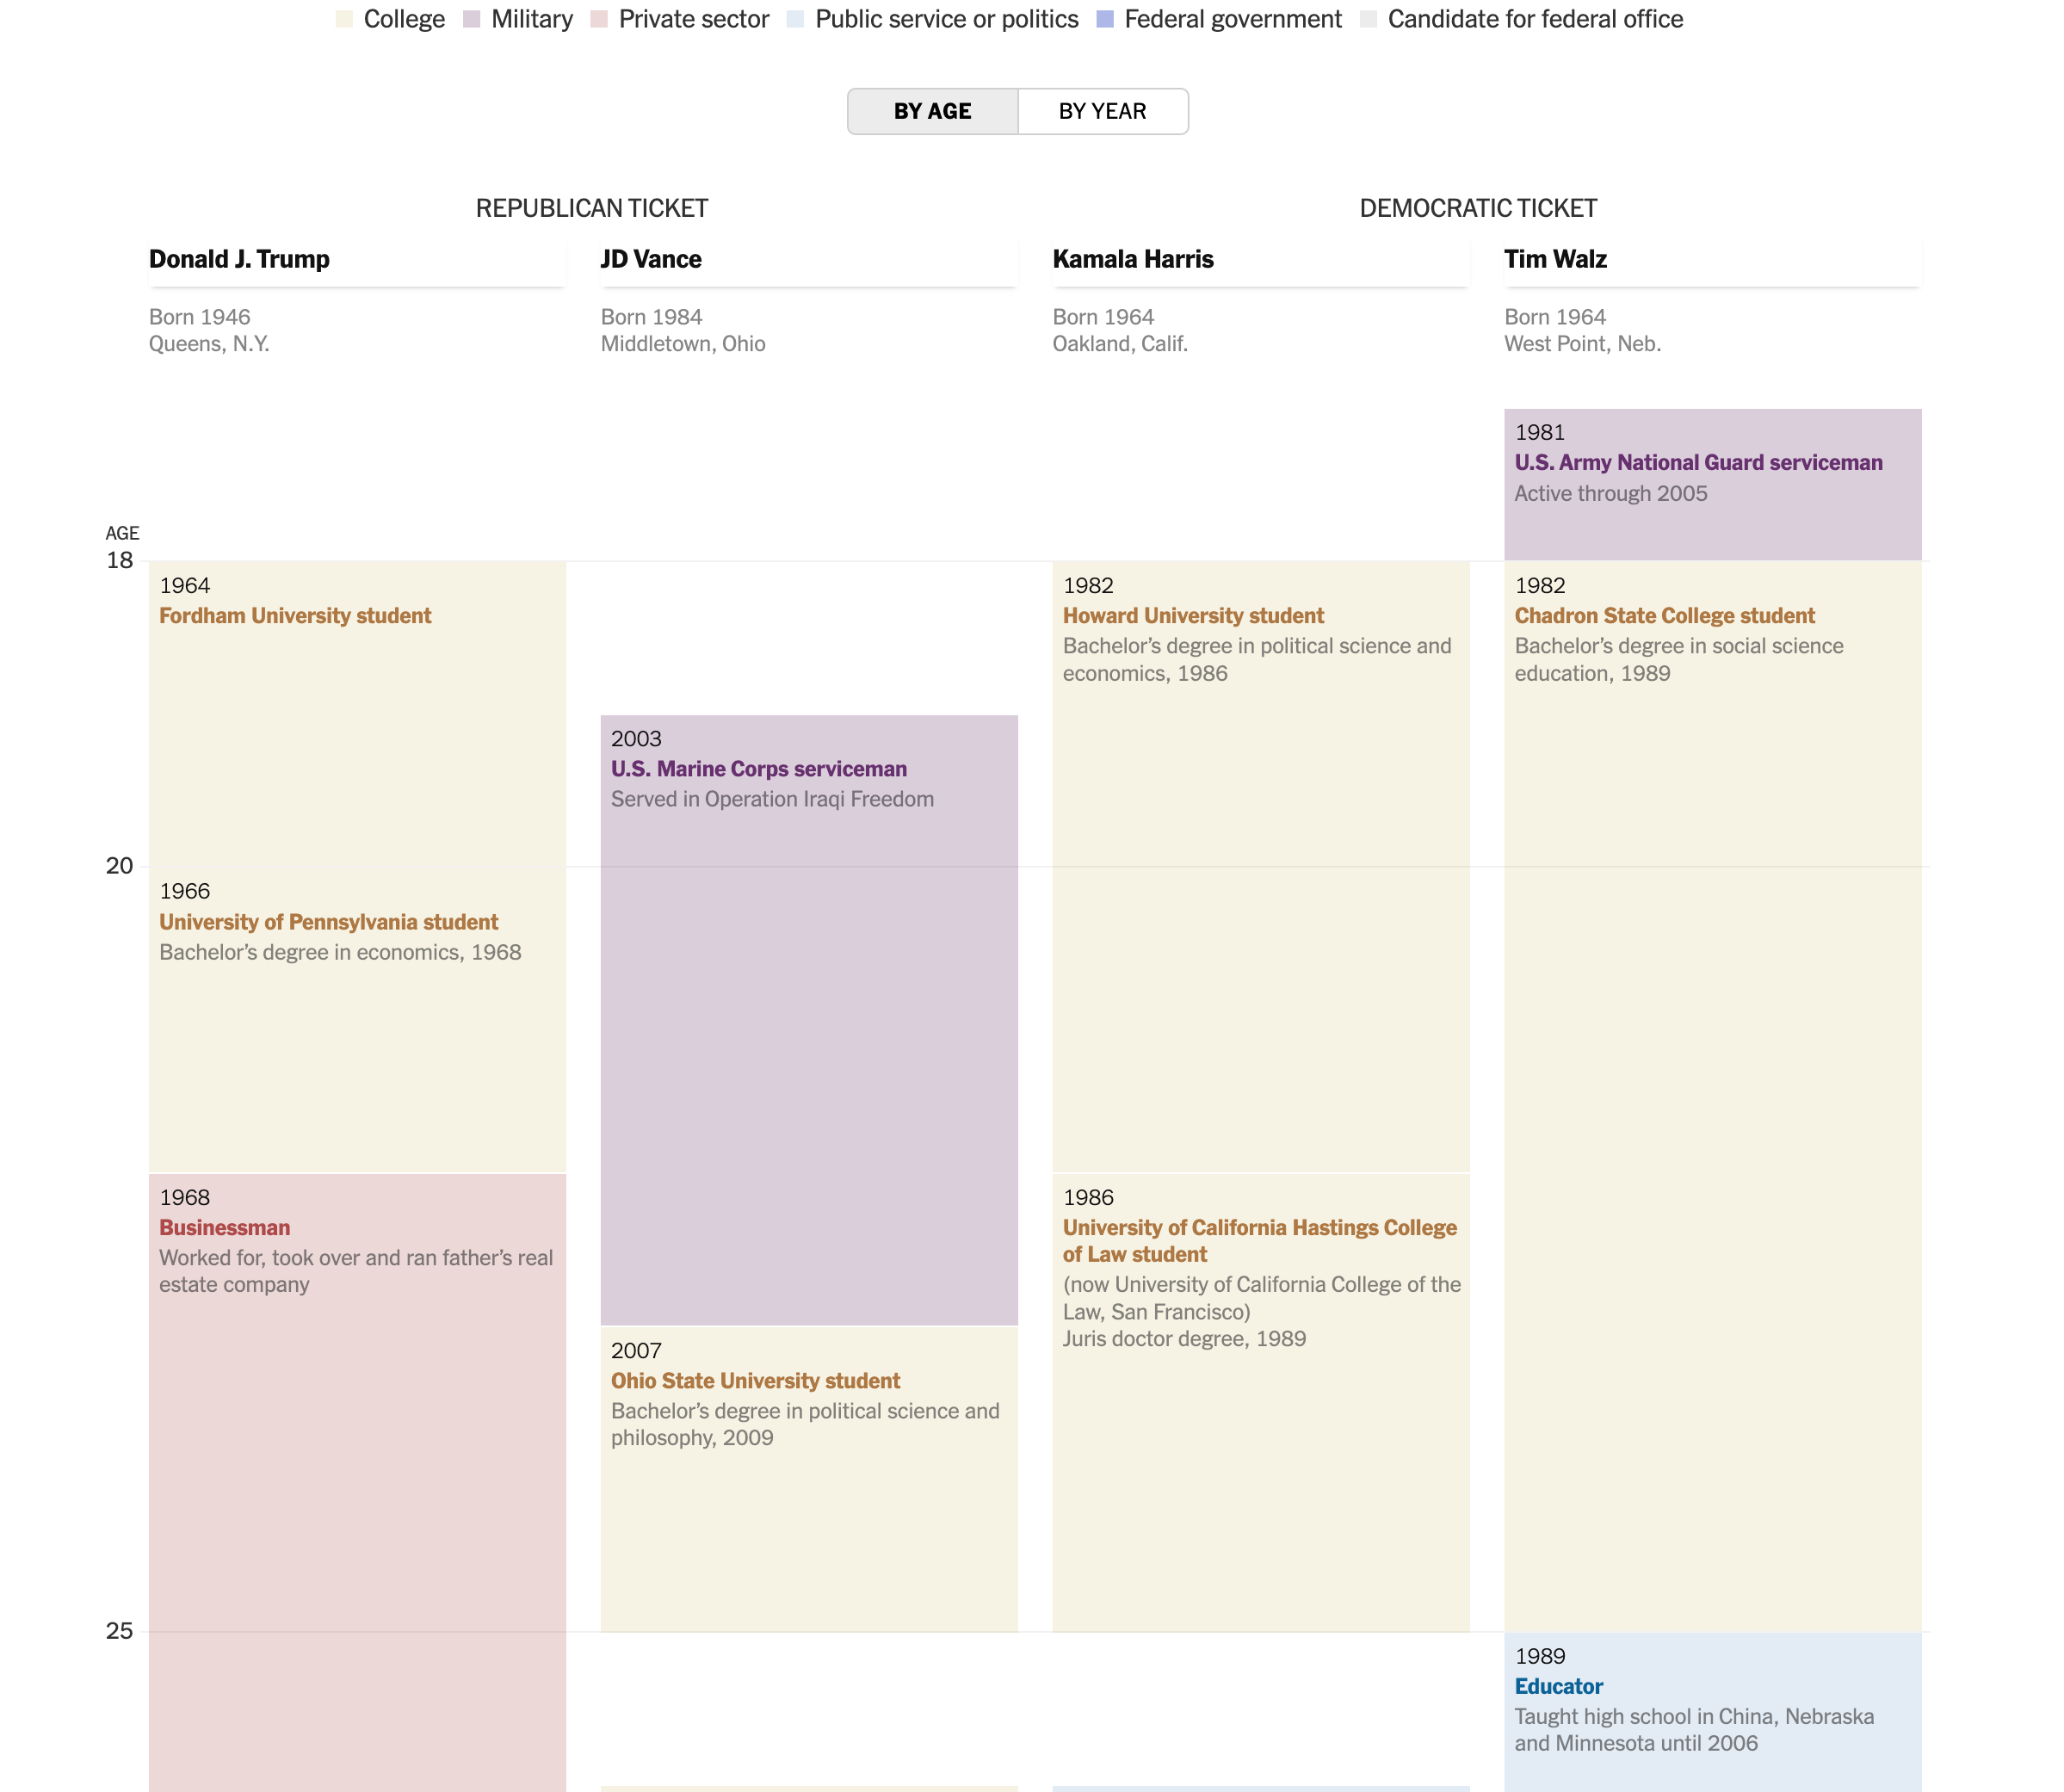
Comparing the Career Timelines of Trump, Vance, Harris and Walz
The New York Times
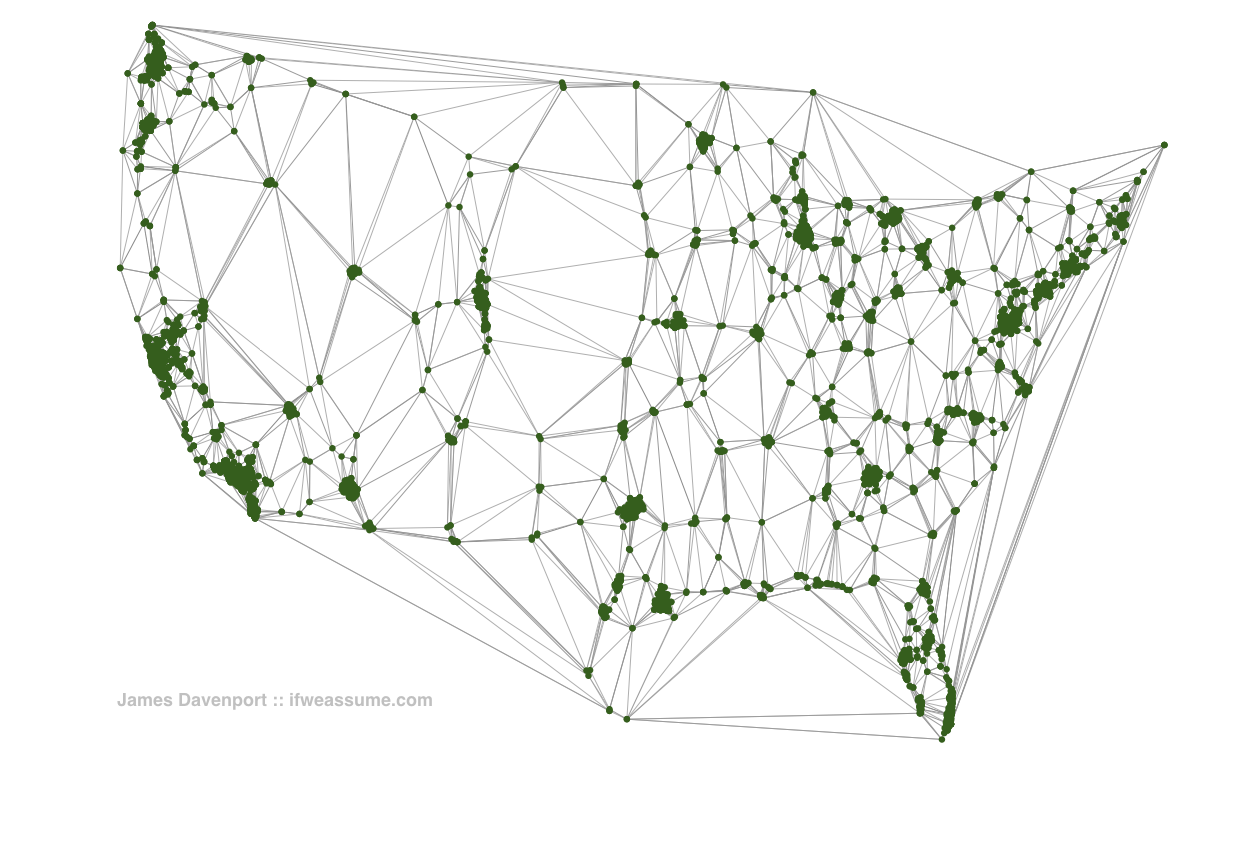
Contiguous United States
Eric Fischer
Conversation Map
Warren Sack

Conway Game of Life
John Conway

Cooper Information Landscapes
Muriel Cooper / MIT Media Lab
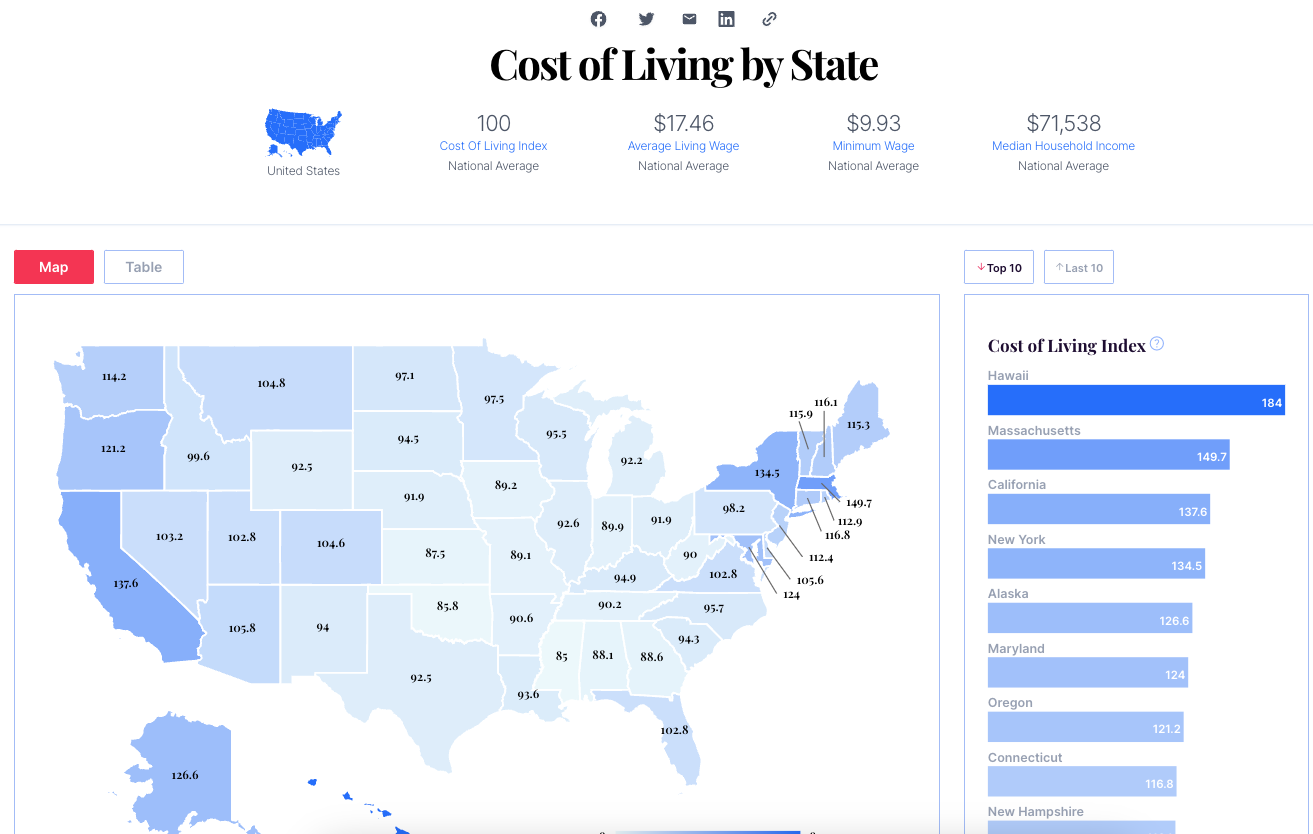
Cost of Living Index
WiseVoter (Government Data)
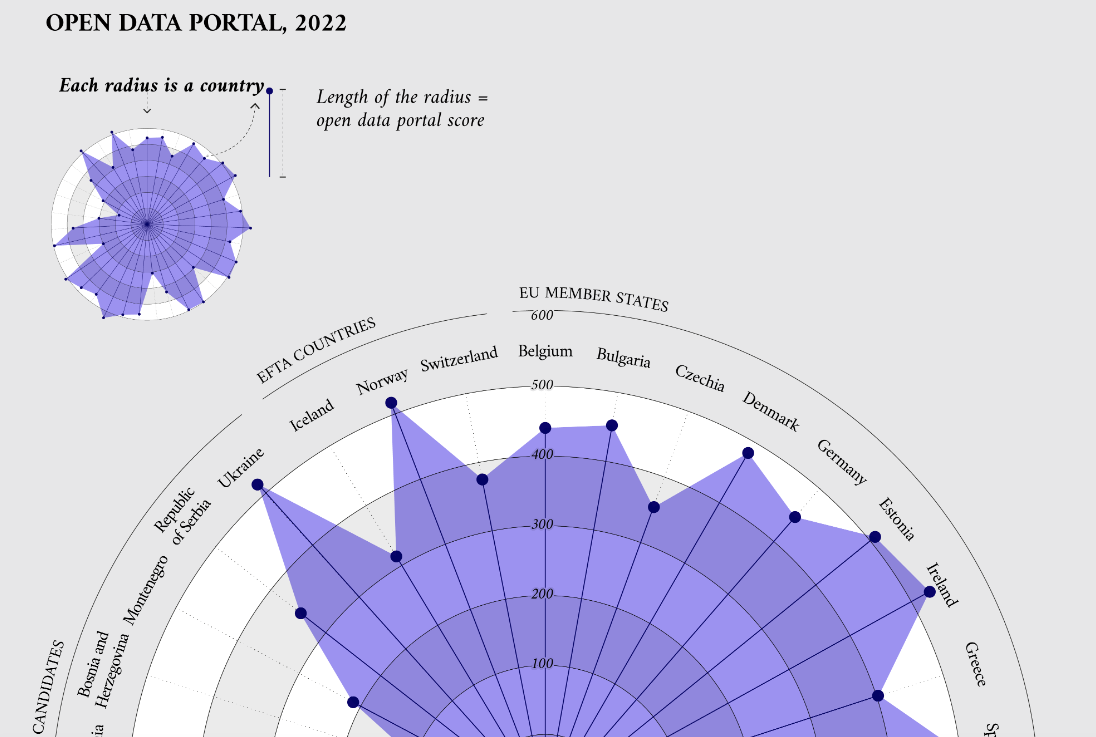
Countries’ Perspectives on Their Open Data Portals
European Commision
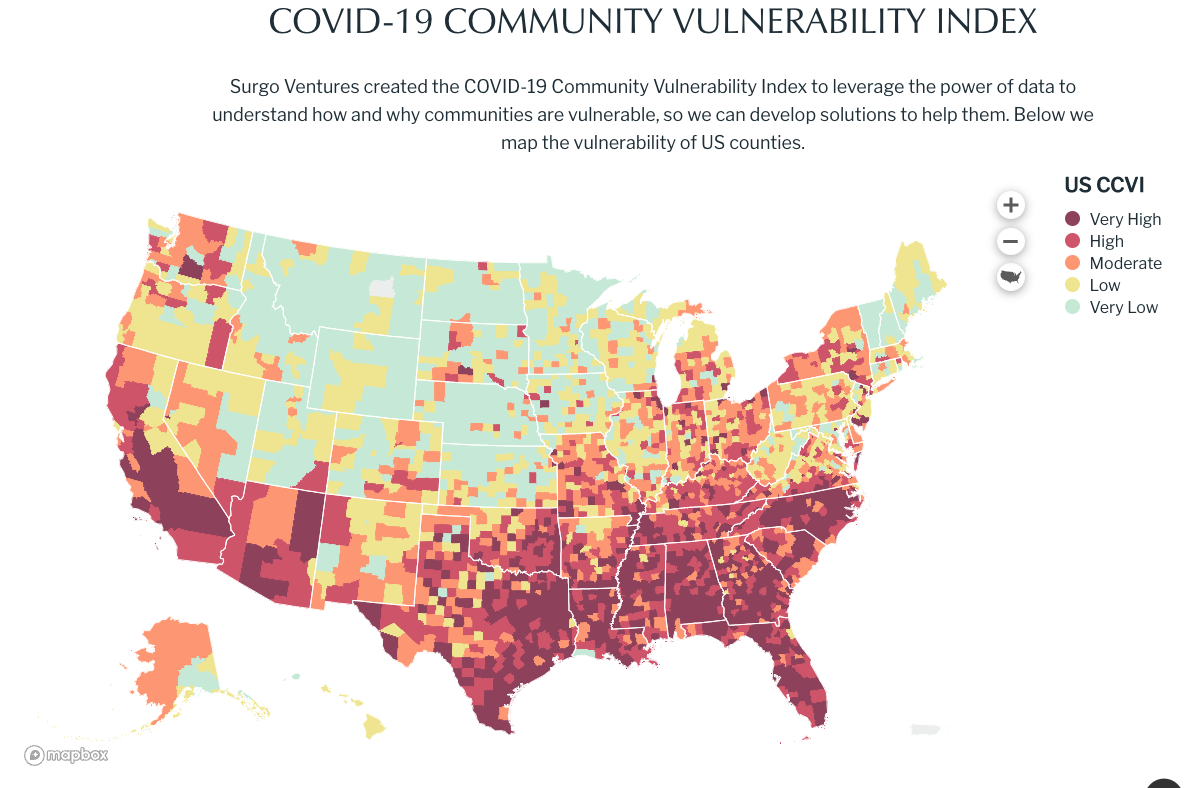
COVID-19 Community Vulnerability Index
Precision for COVID
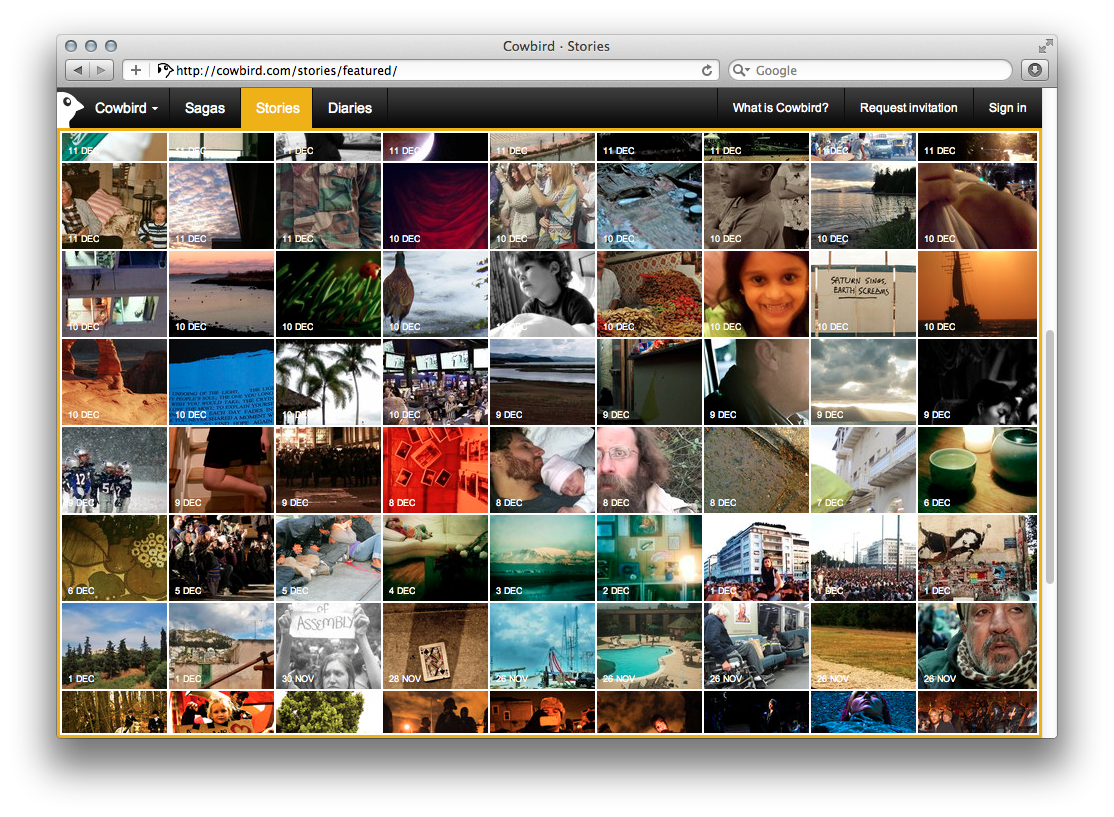
Cowbird
Jonathan Harris
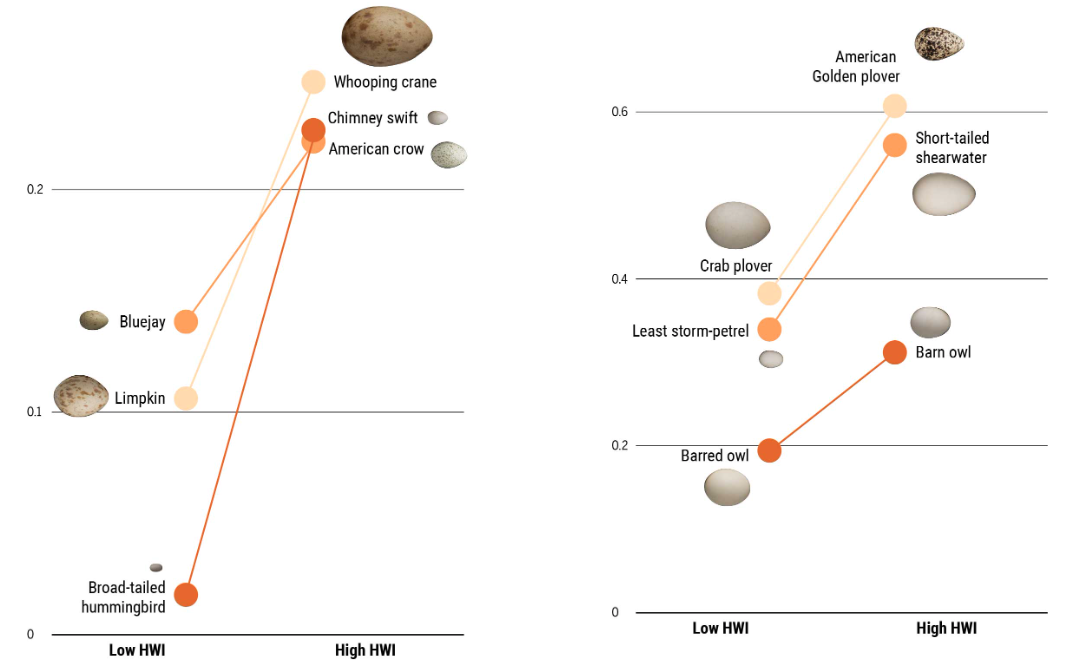
Cracking the Mystery of Egg Shape
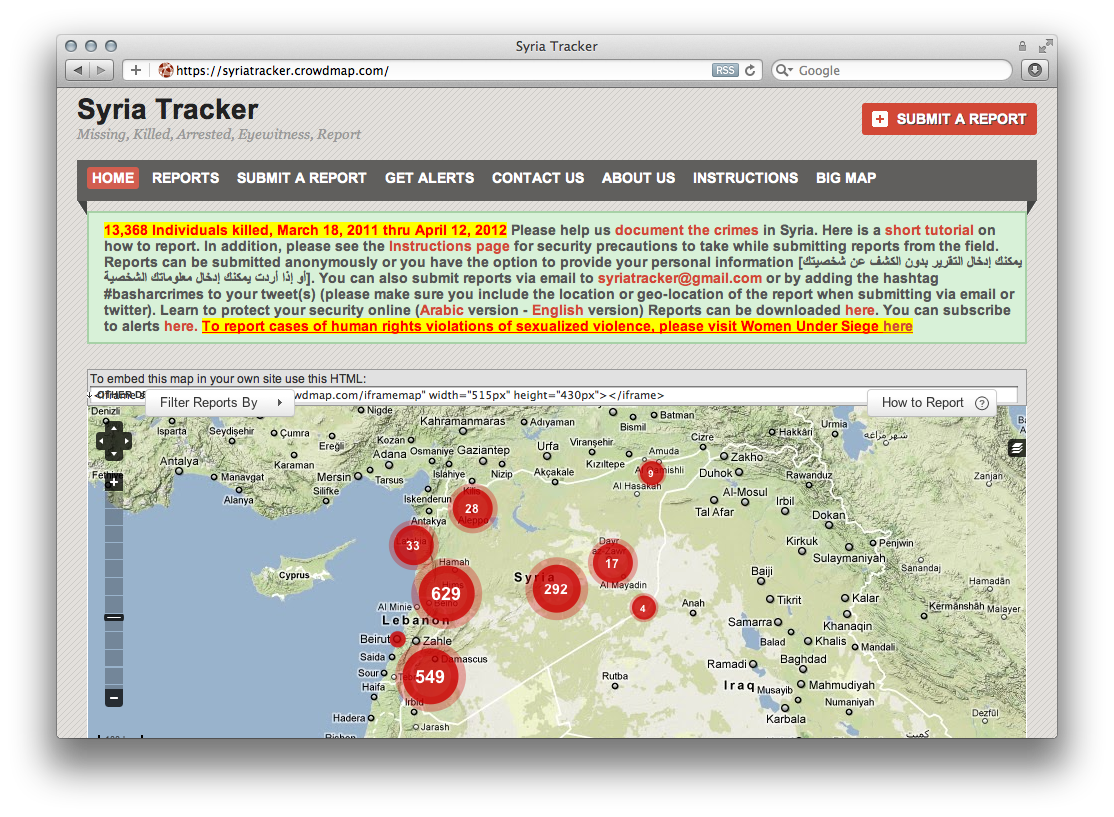
Crowdmaps Syria Tracker
Ushahidi / Crowdmaps
Crowdsourced iPhone Logs
Eric Fischer
Cubism and Abstract Art
Alfred H. Barr

Culture in the Crosshairs
ABC News
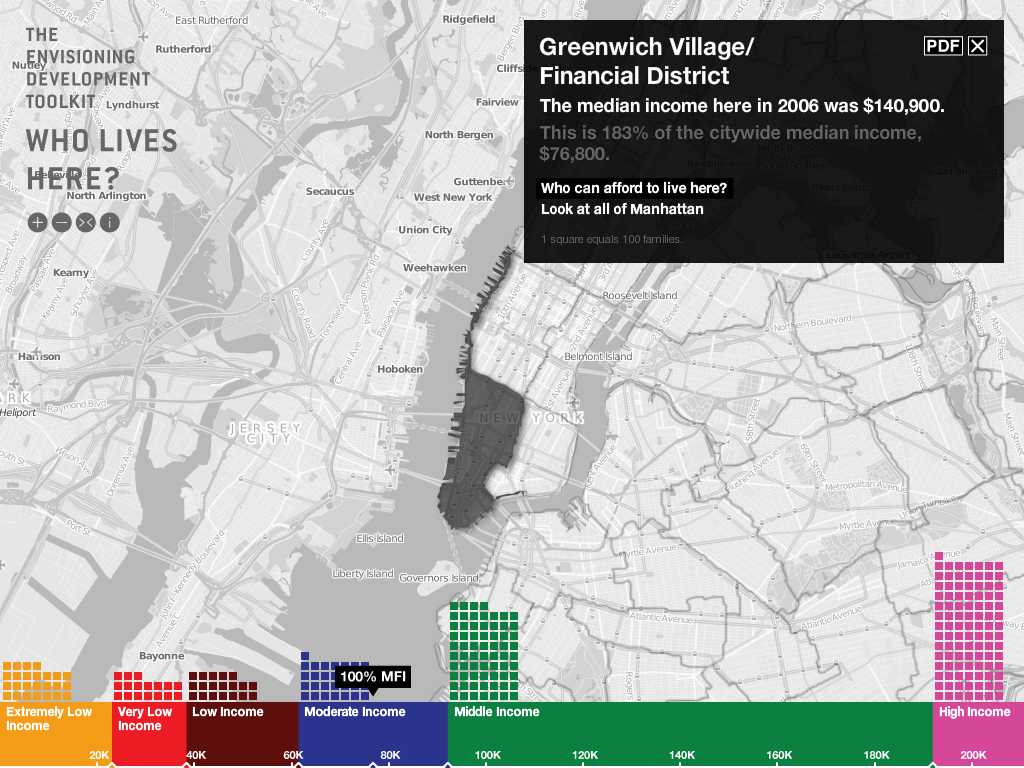
CUPEnvisioning Development
Center for Urban Pedagogy (CUP)
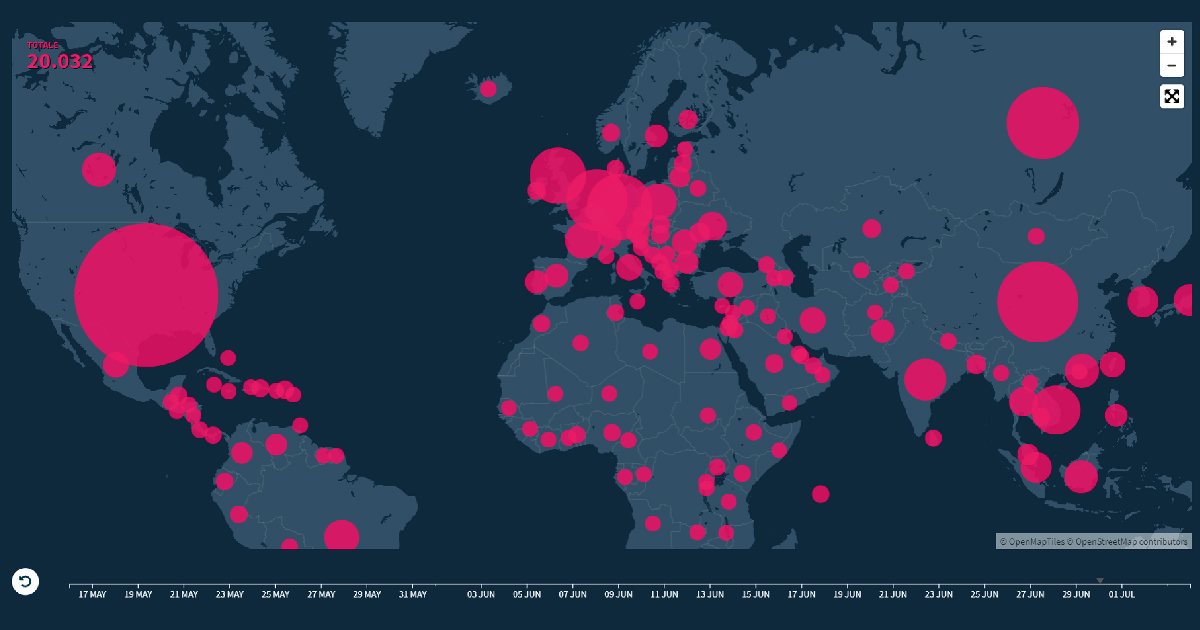
Cybersecurity, the New Threats in Real Time
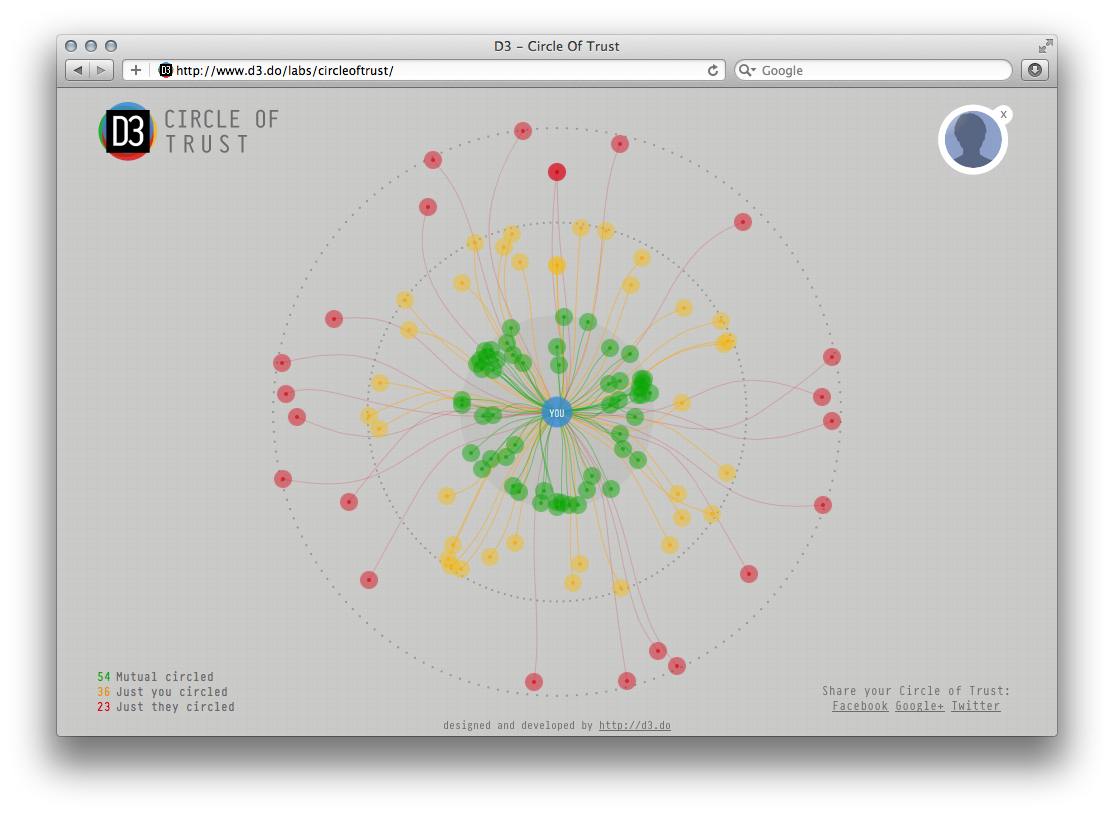
D3Circle Of Trust
Unknown
Dashboard of the Present Future

DasProgramm
Data Density Examples
Edward Tufte
data.org
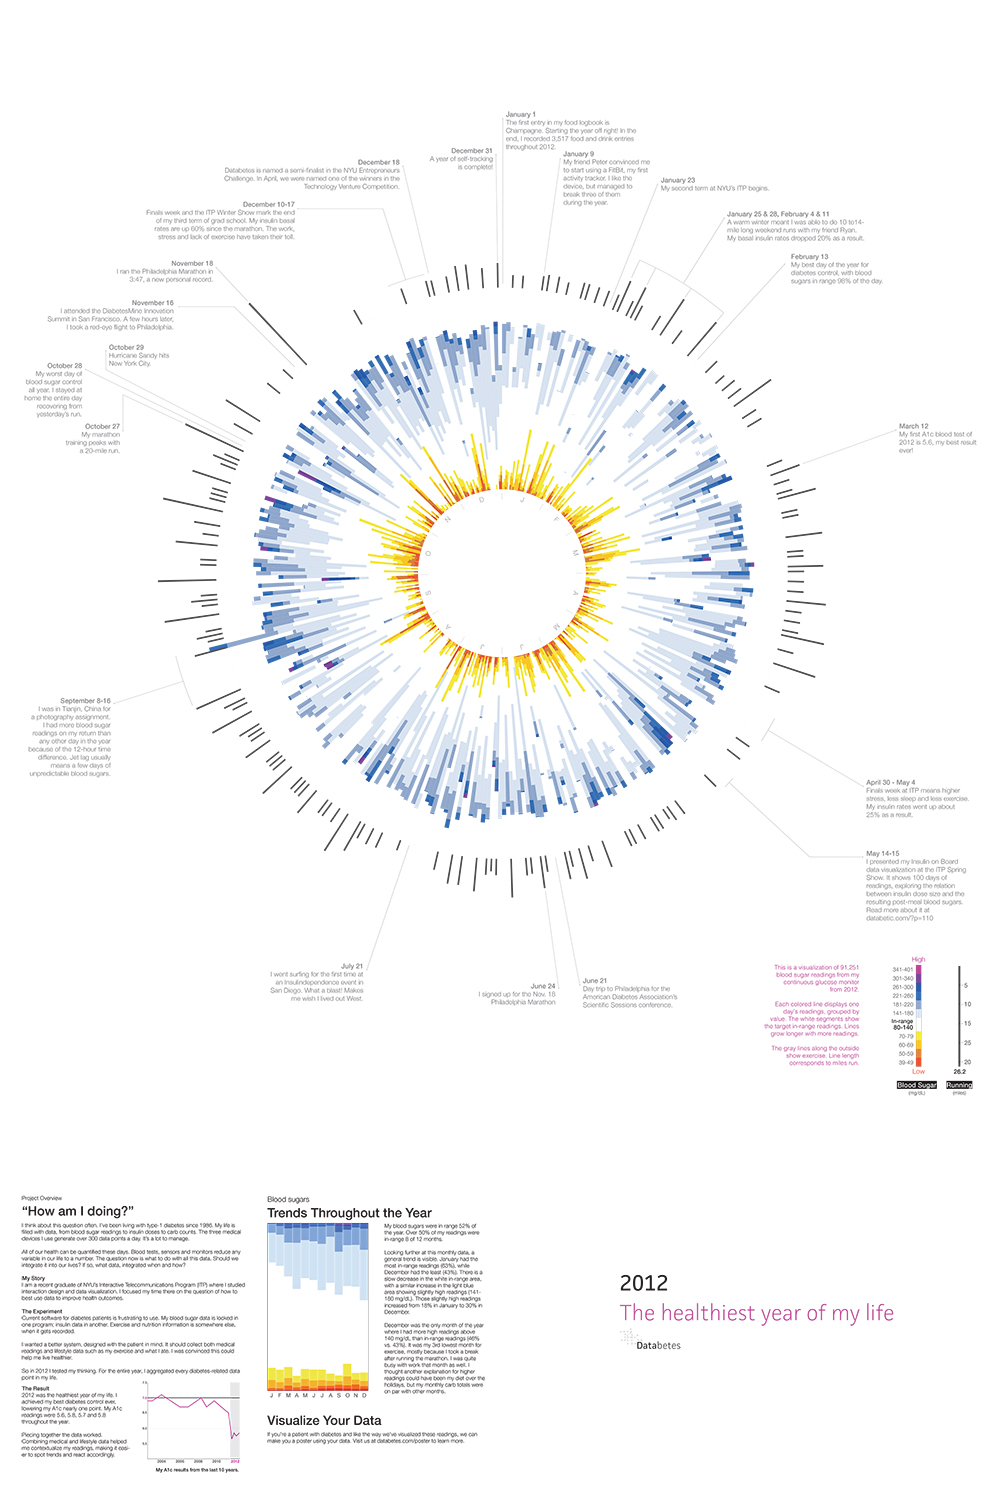
Databetes
Doug Kanter
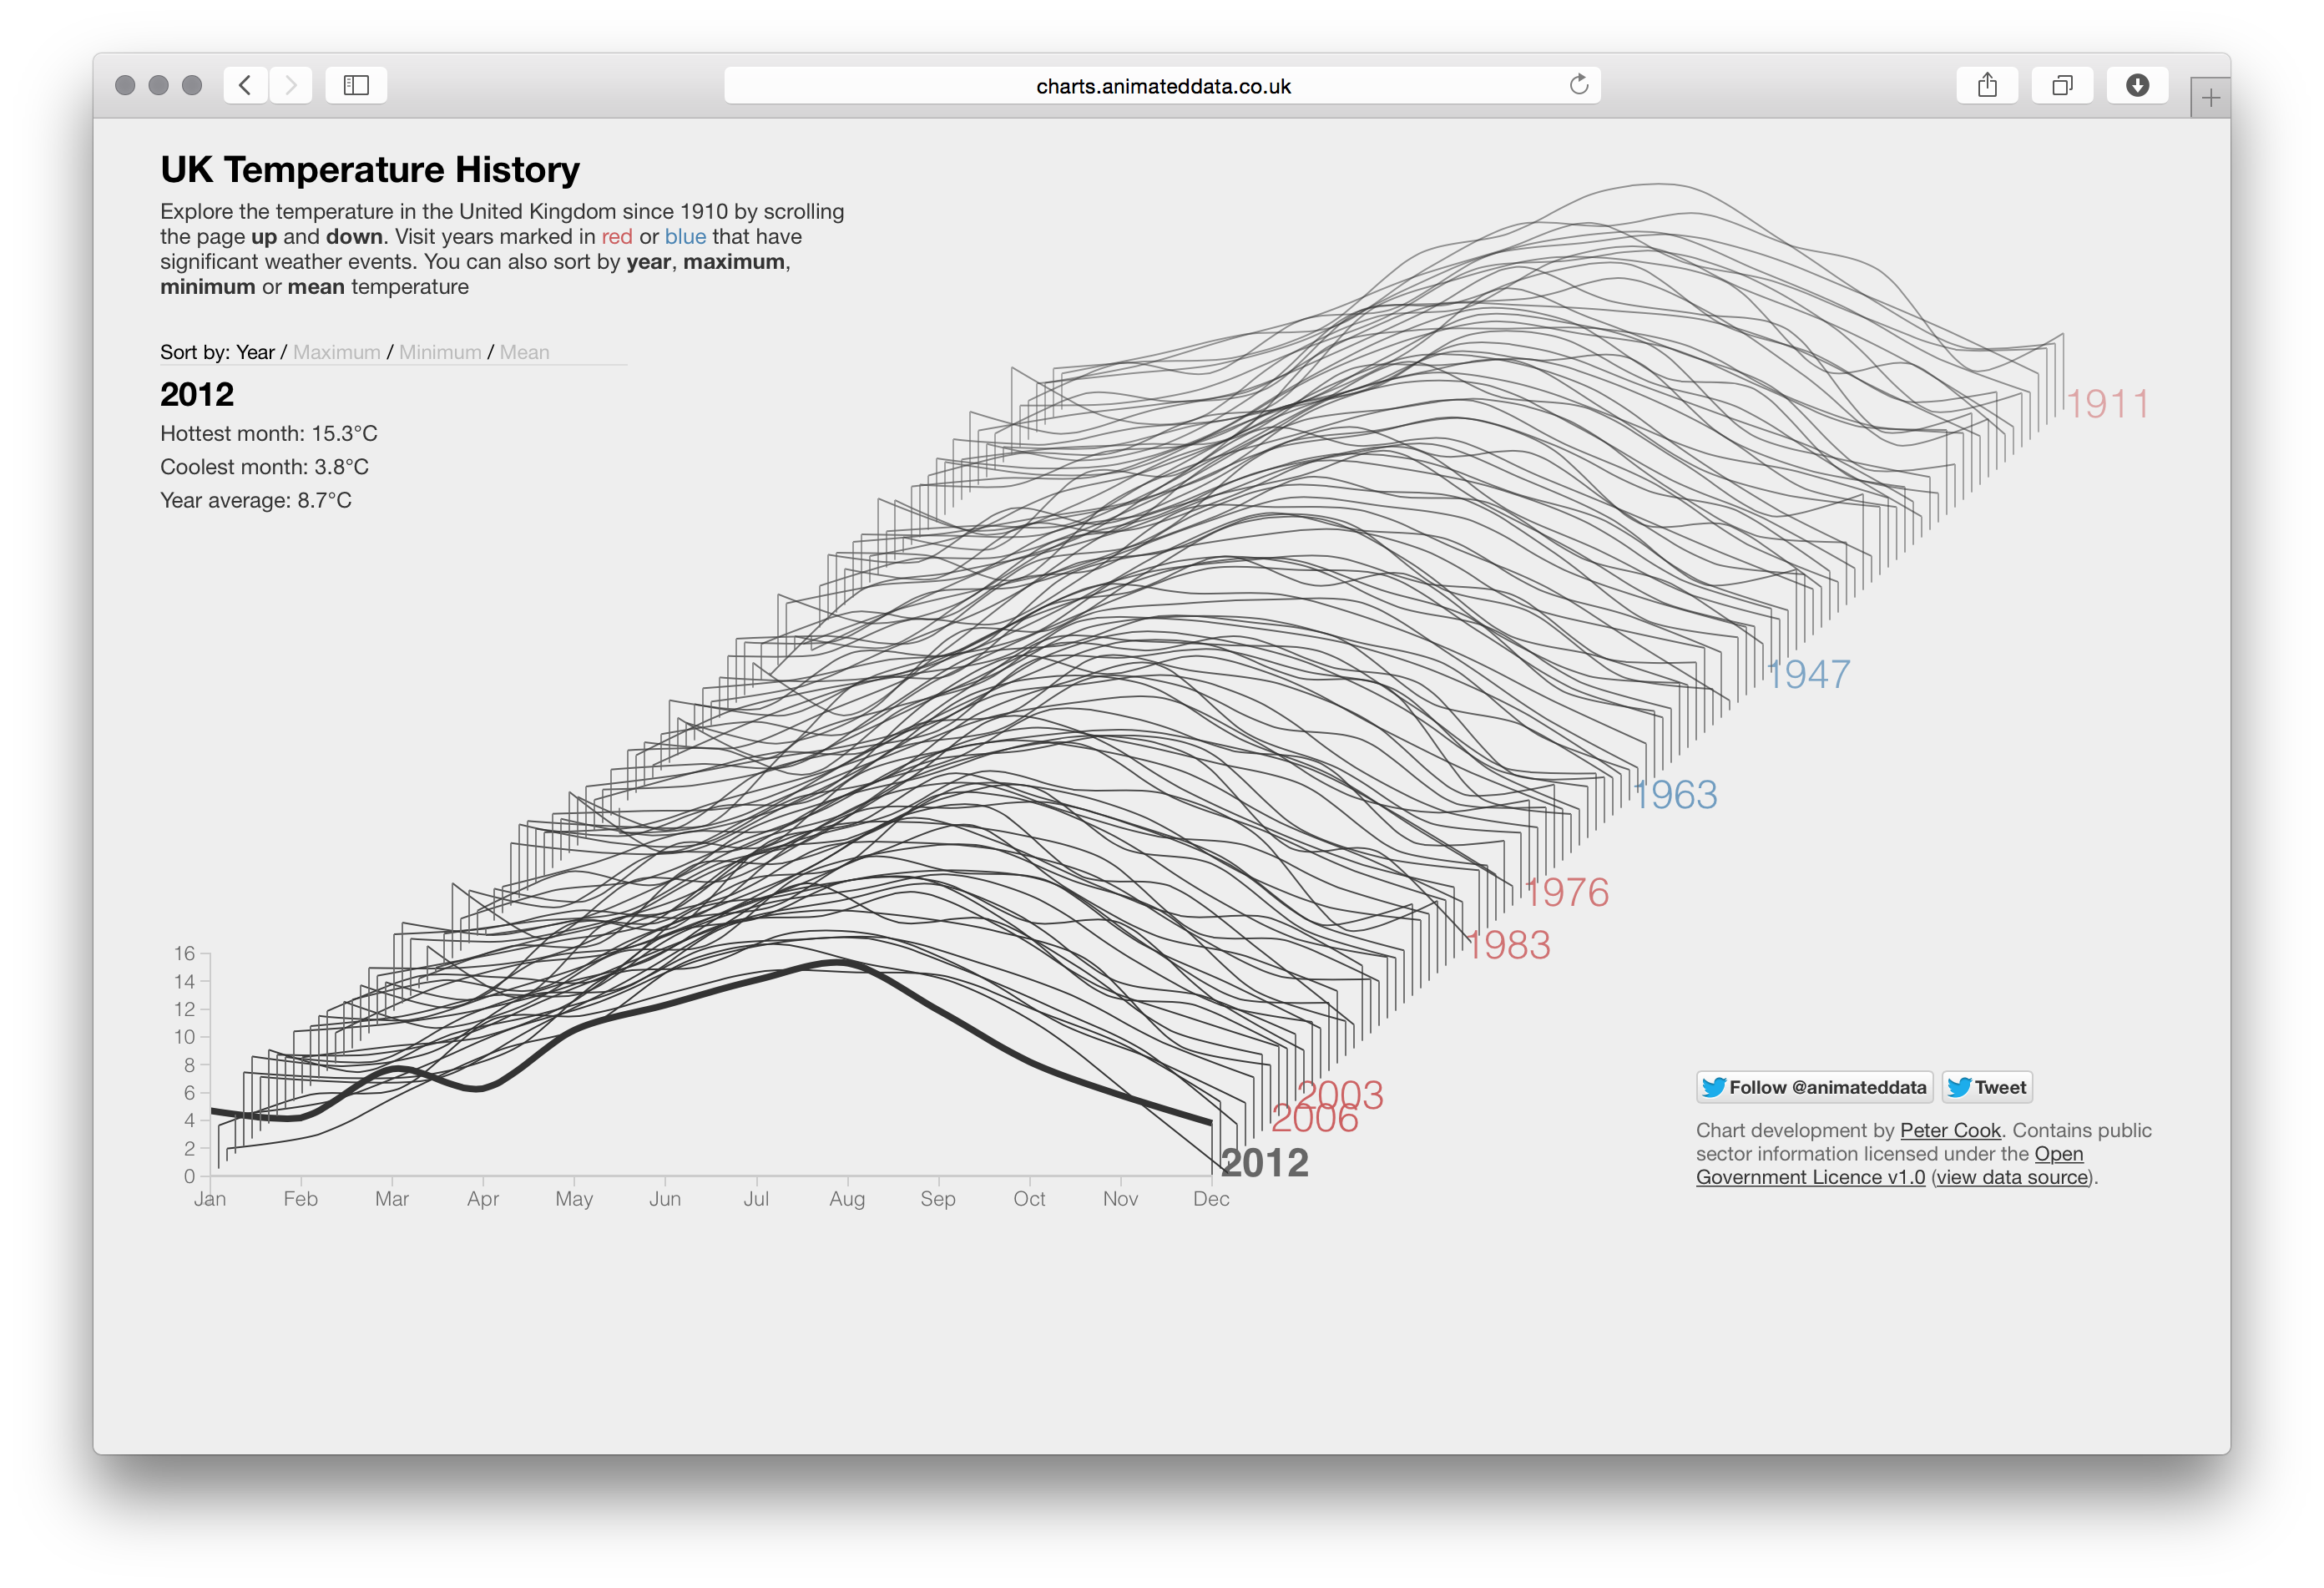
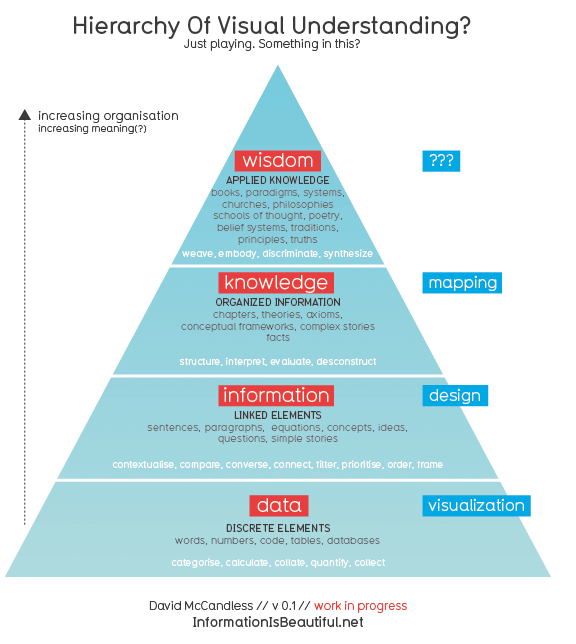
David McCandless / Cook
David McCandless
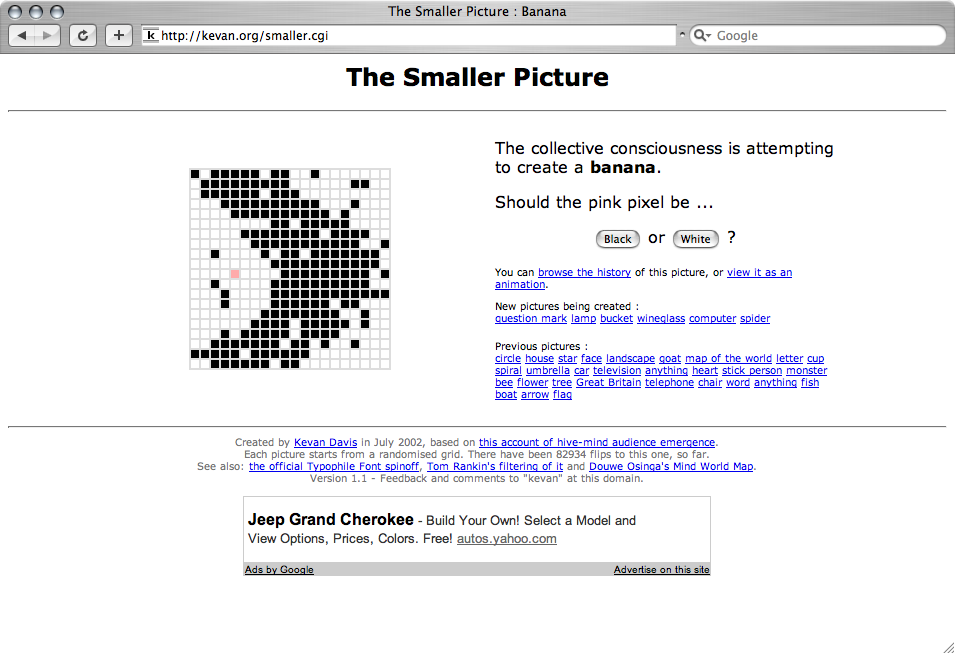
Davis Smaller Picture
Davis
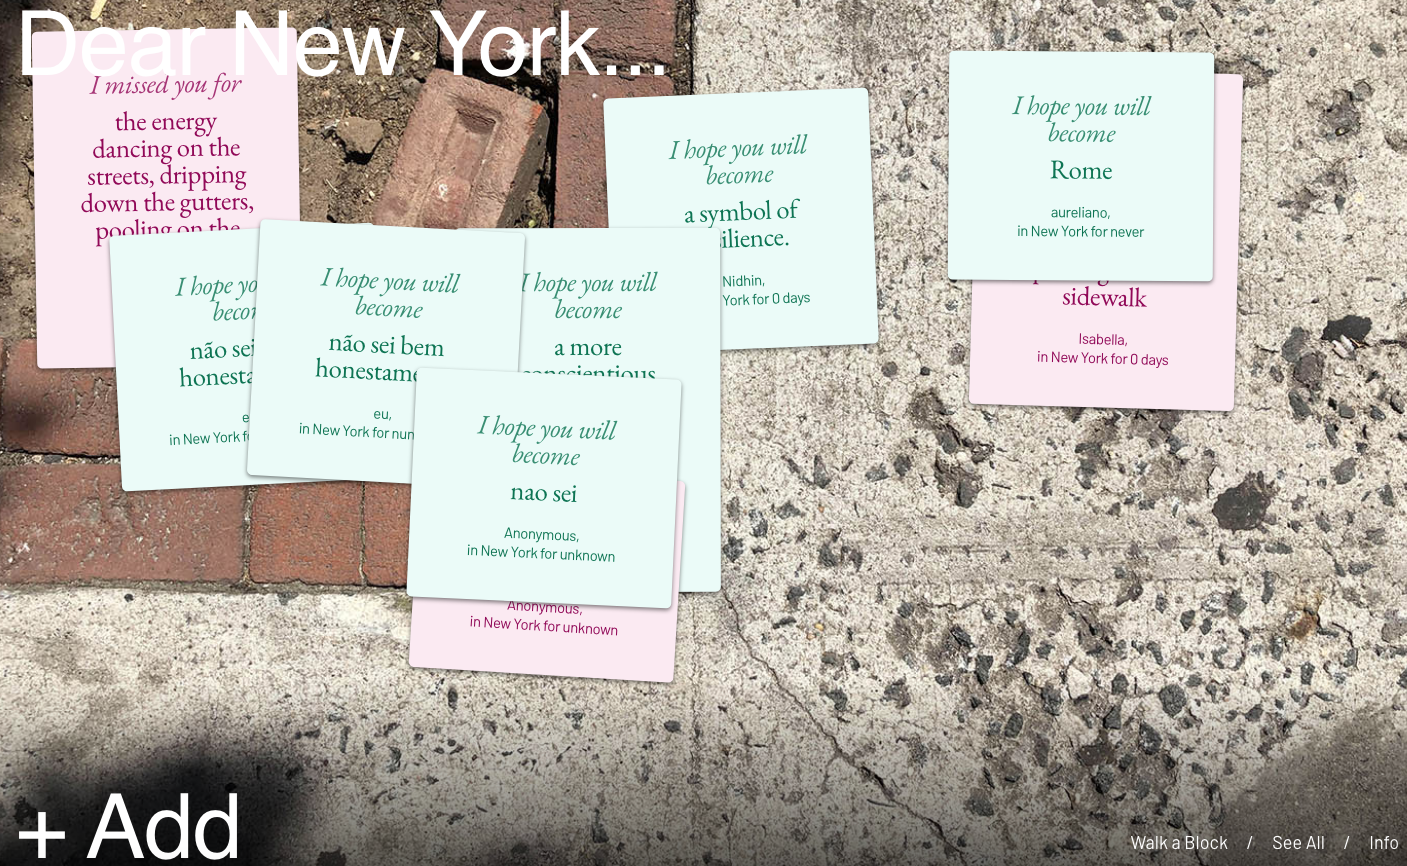
Dear New York
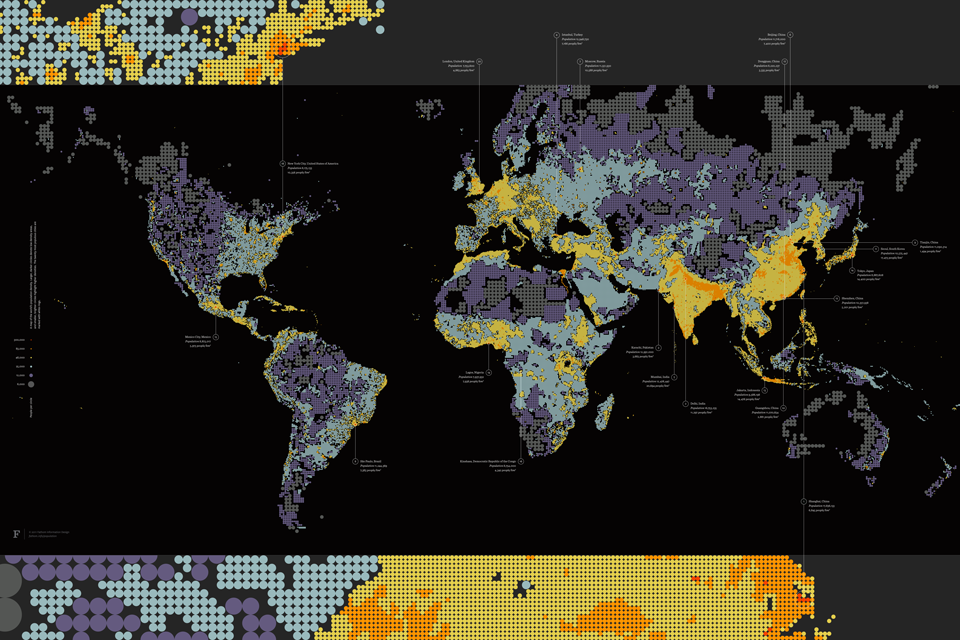
Dencity
Fathom Information Design
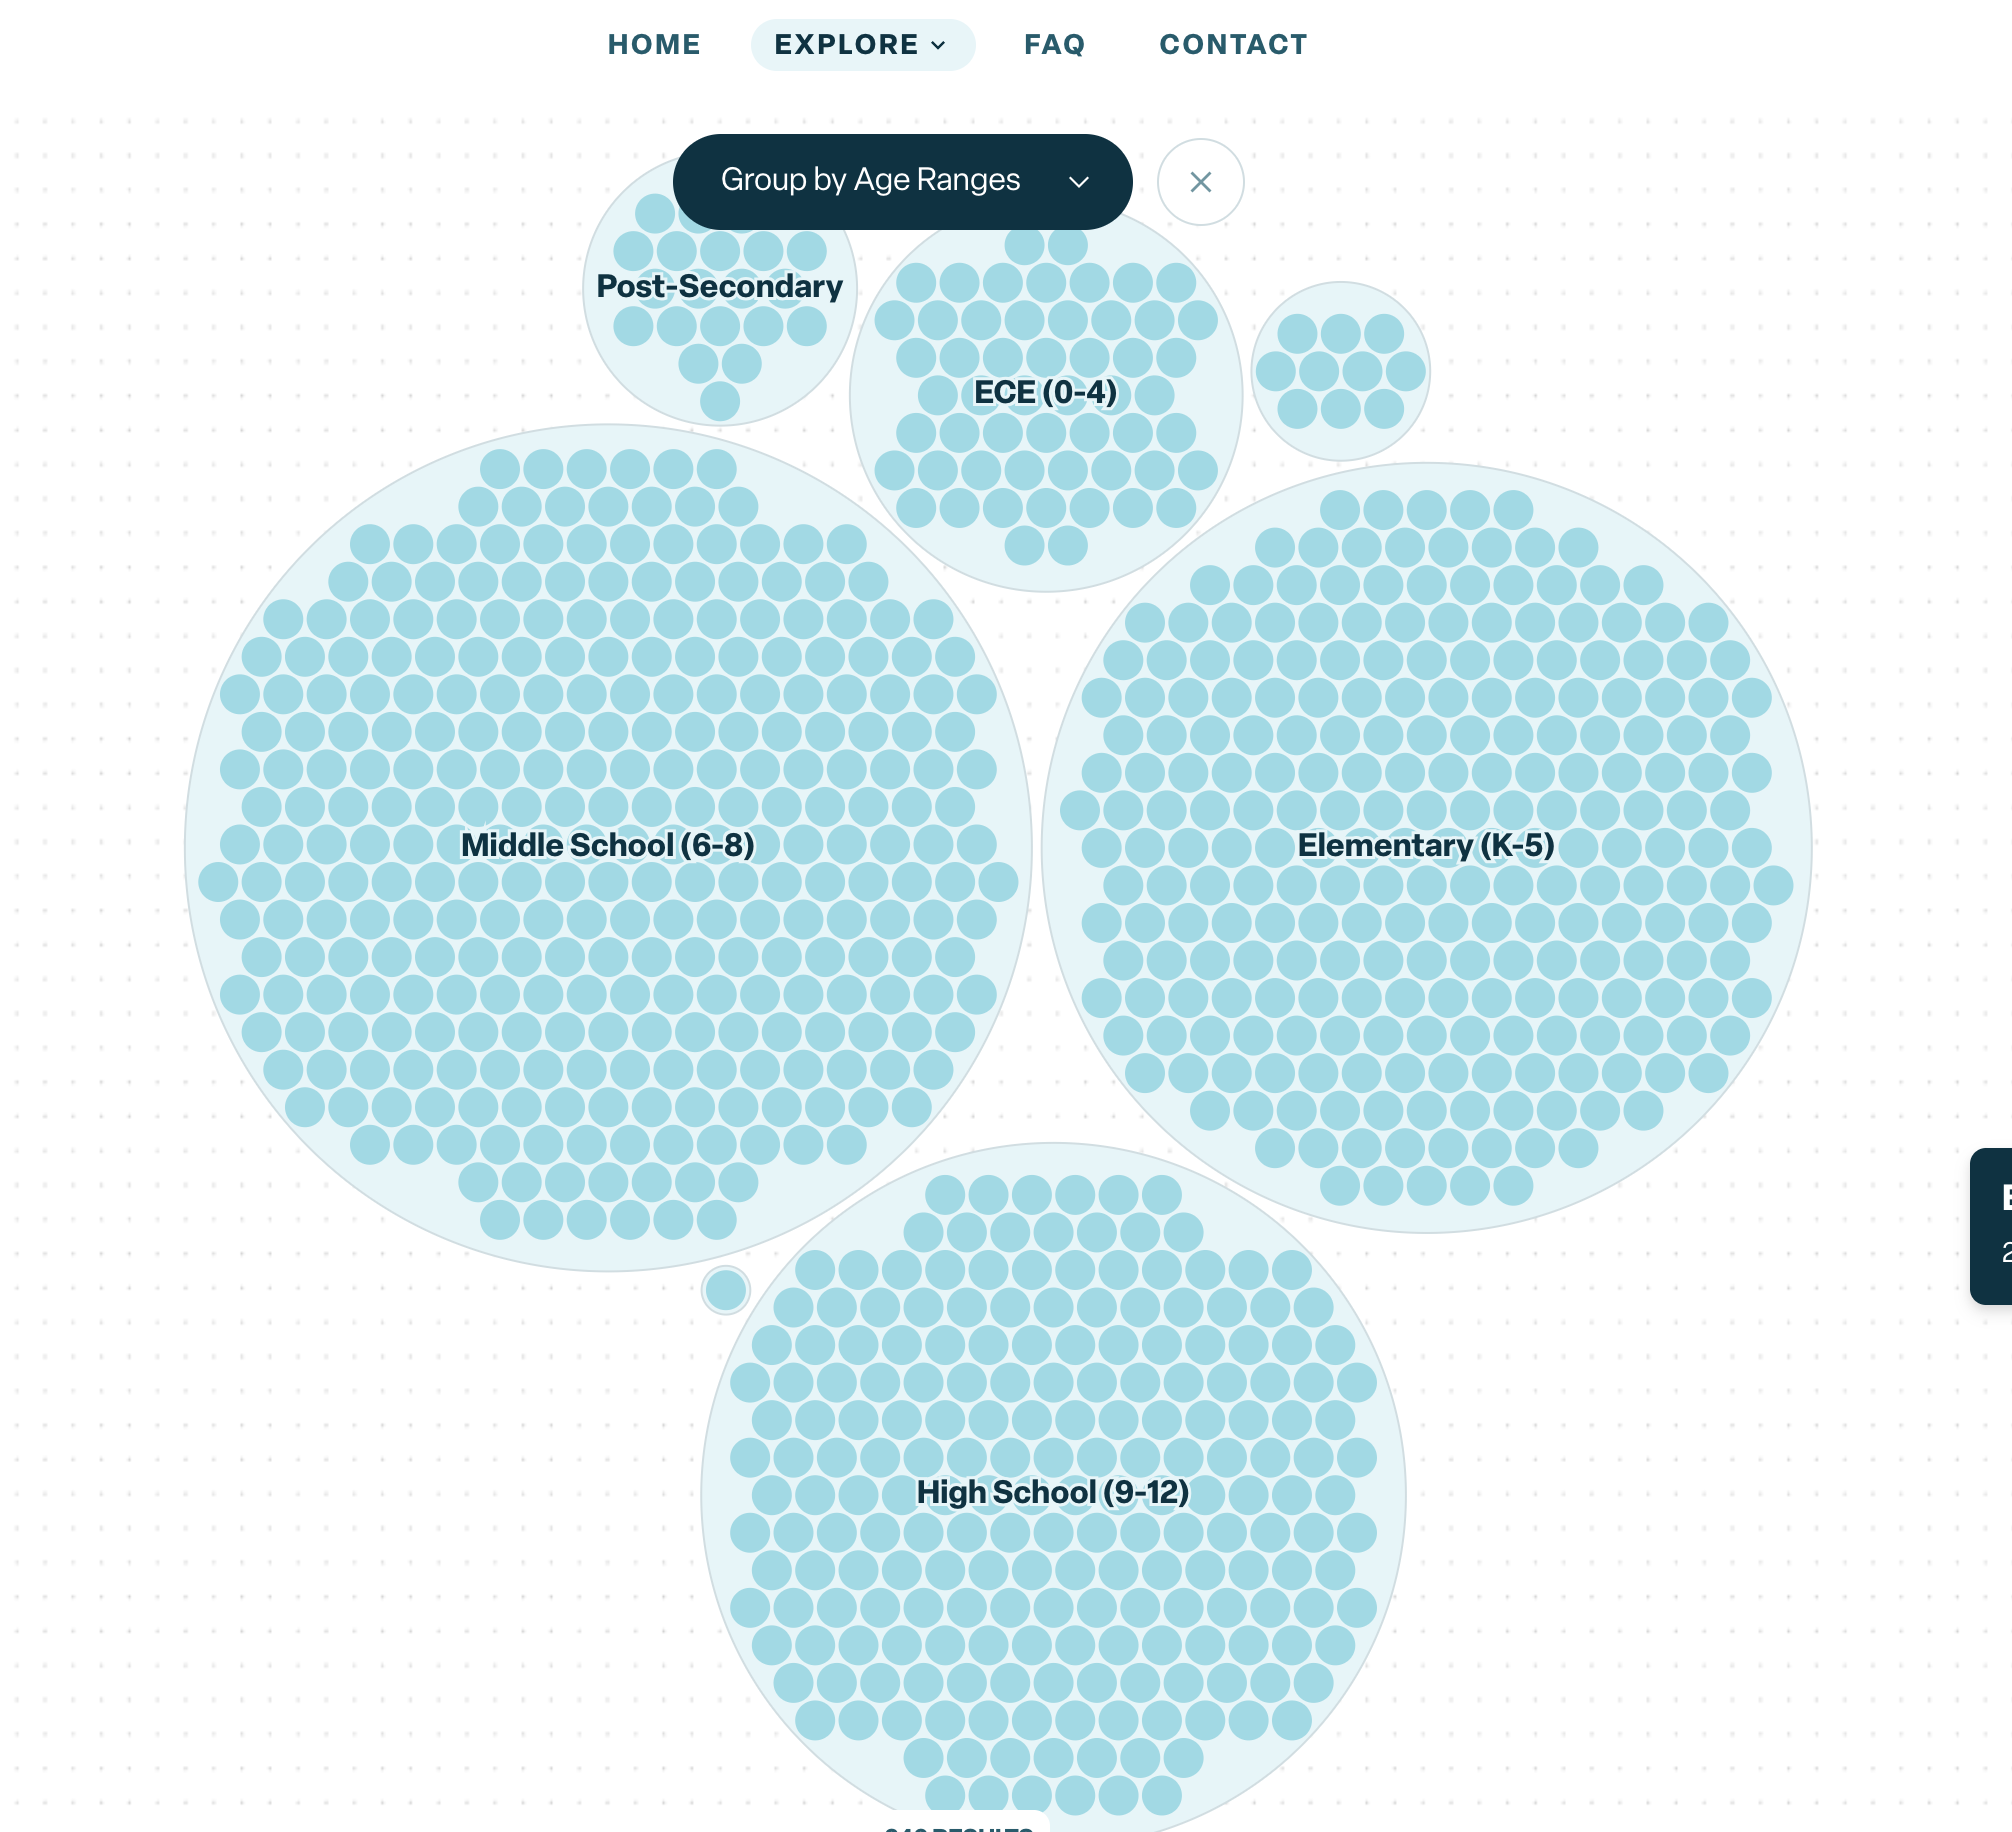
Denver Learning Ecosystem
Depopulation Pyramids, Propublica
Propublica
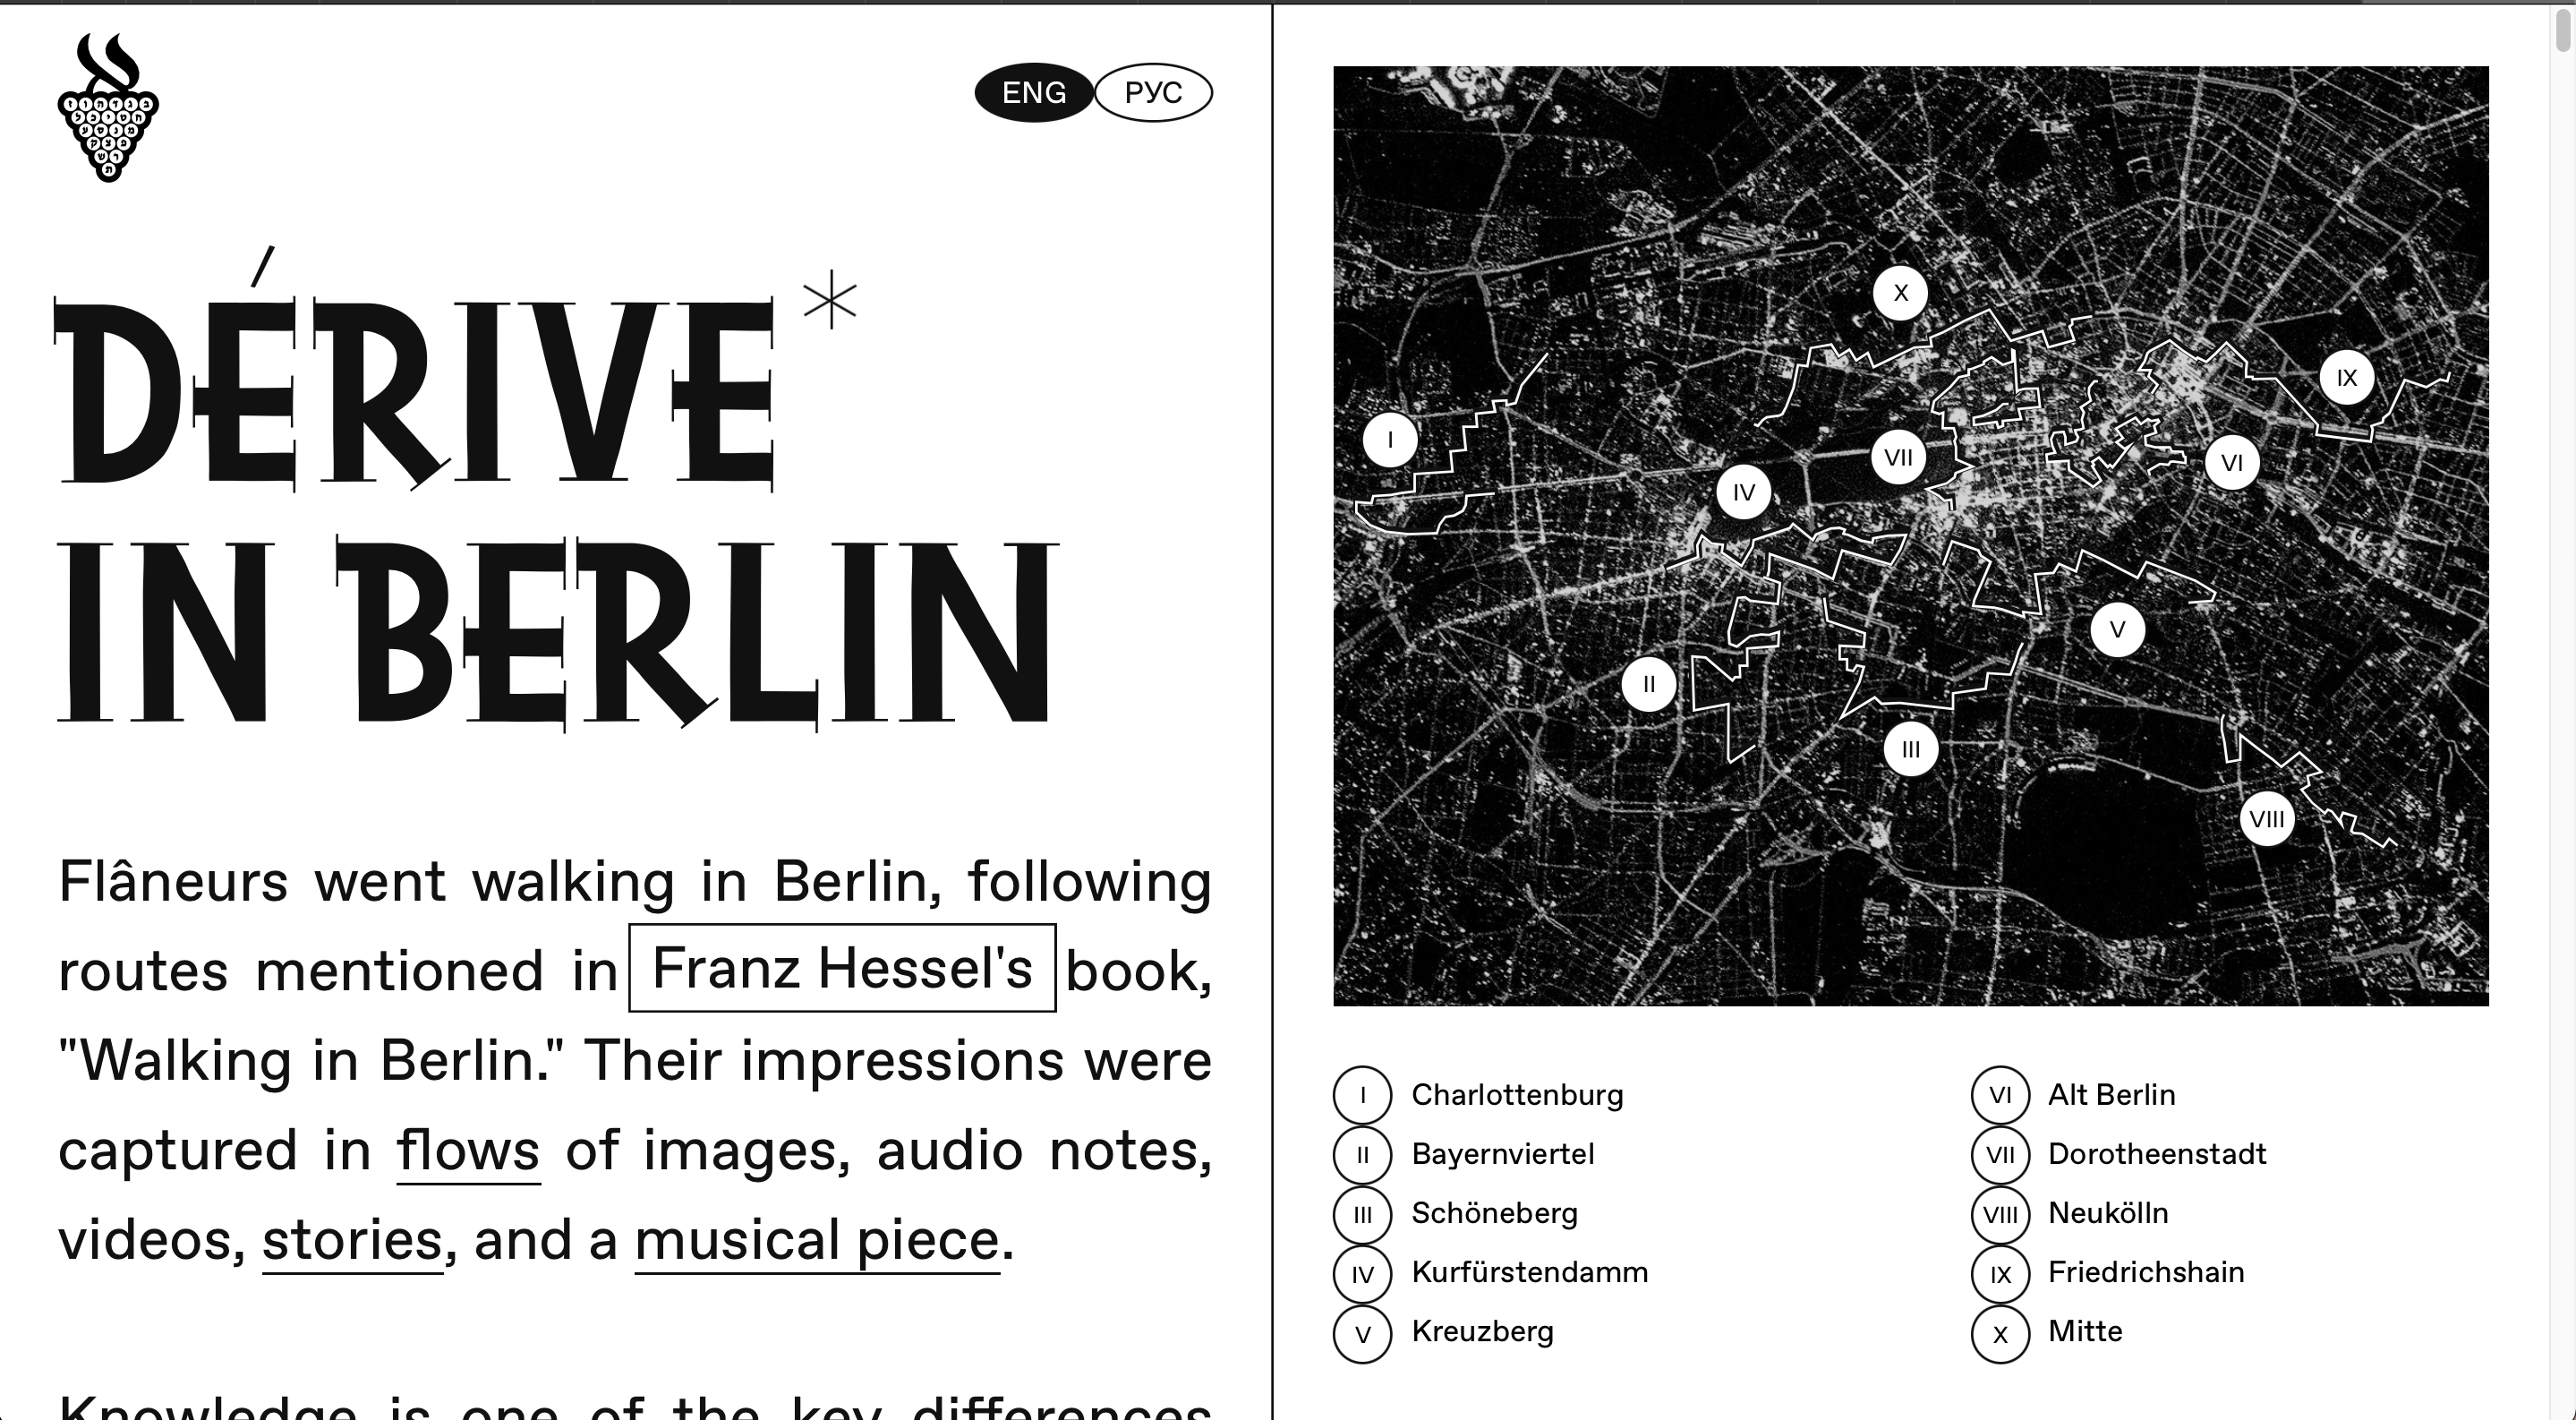
Derive in Berlin

Designed by Women
Dialogos Pathfinder Report
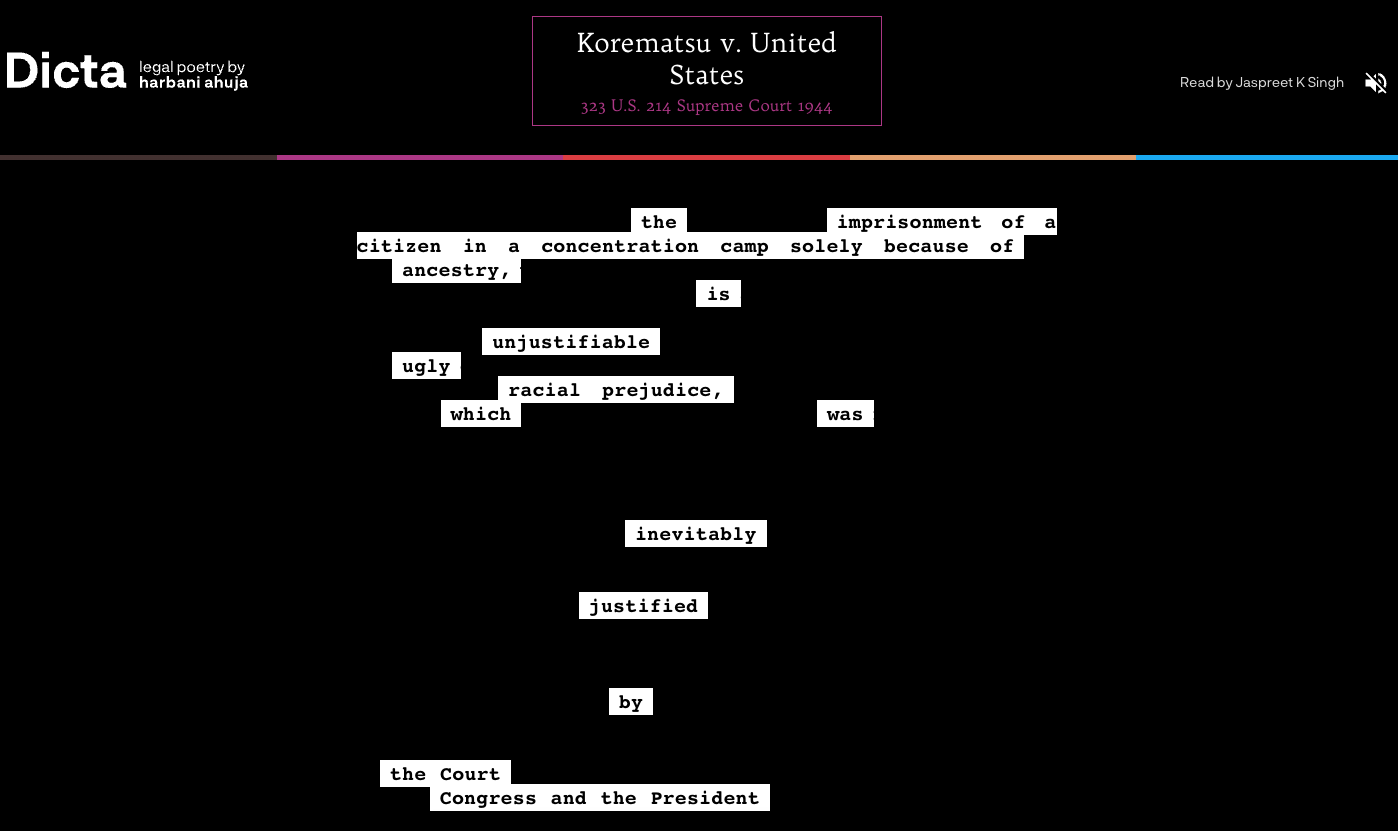
Dicta: Legal Poetry Timeline
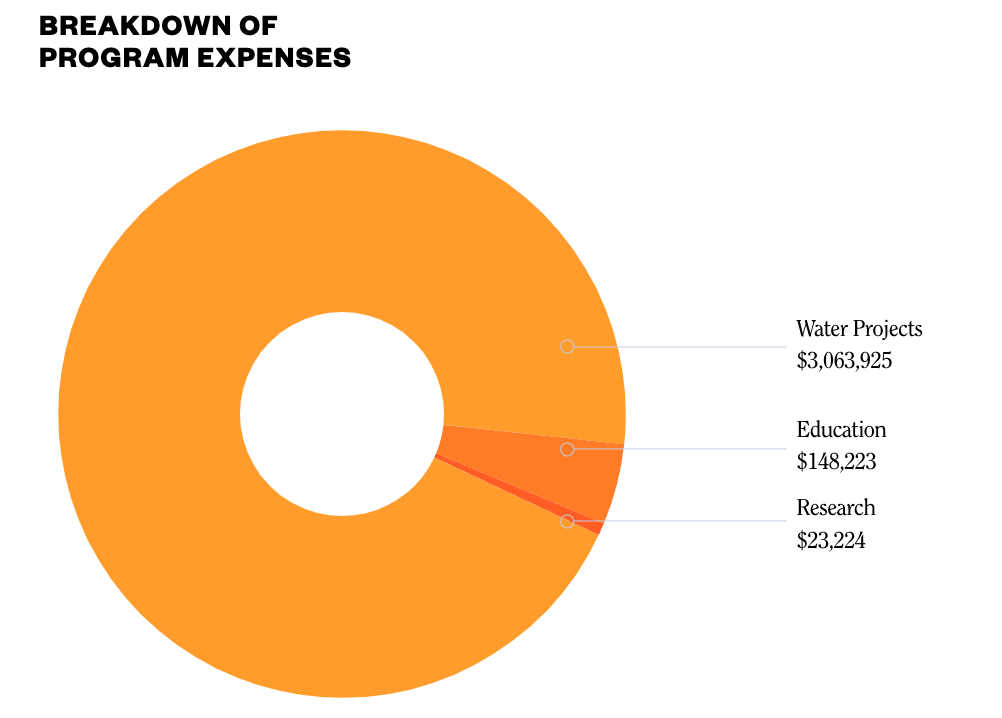
Dig Deep Annual Report 2020
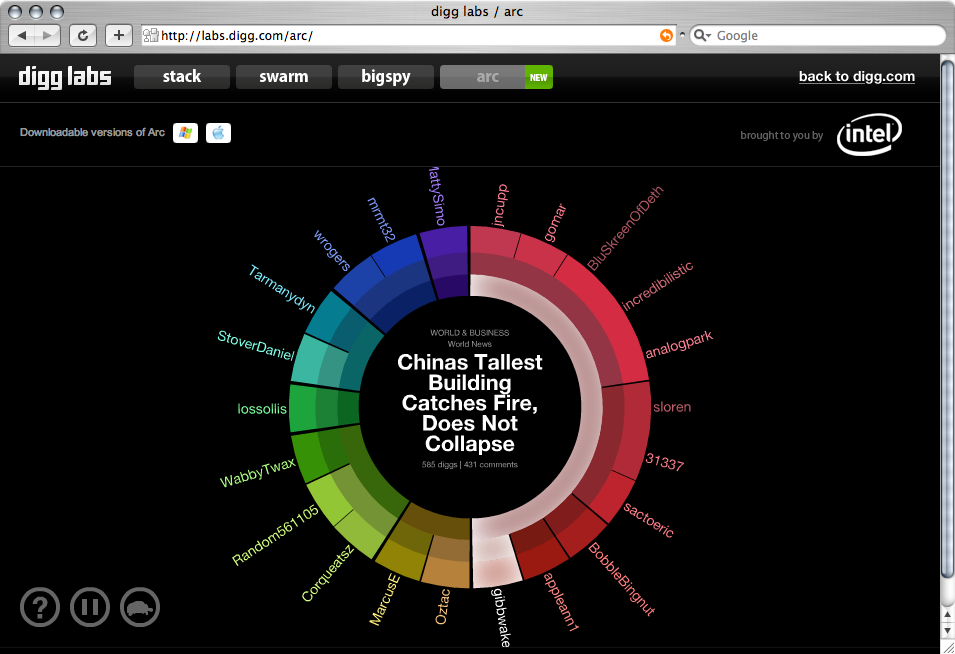
Digg Labs
Stamen Design
Digital Photographs
Jörg Sasse
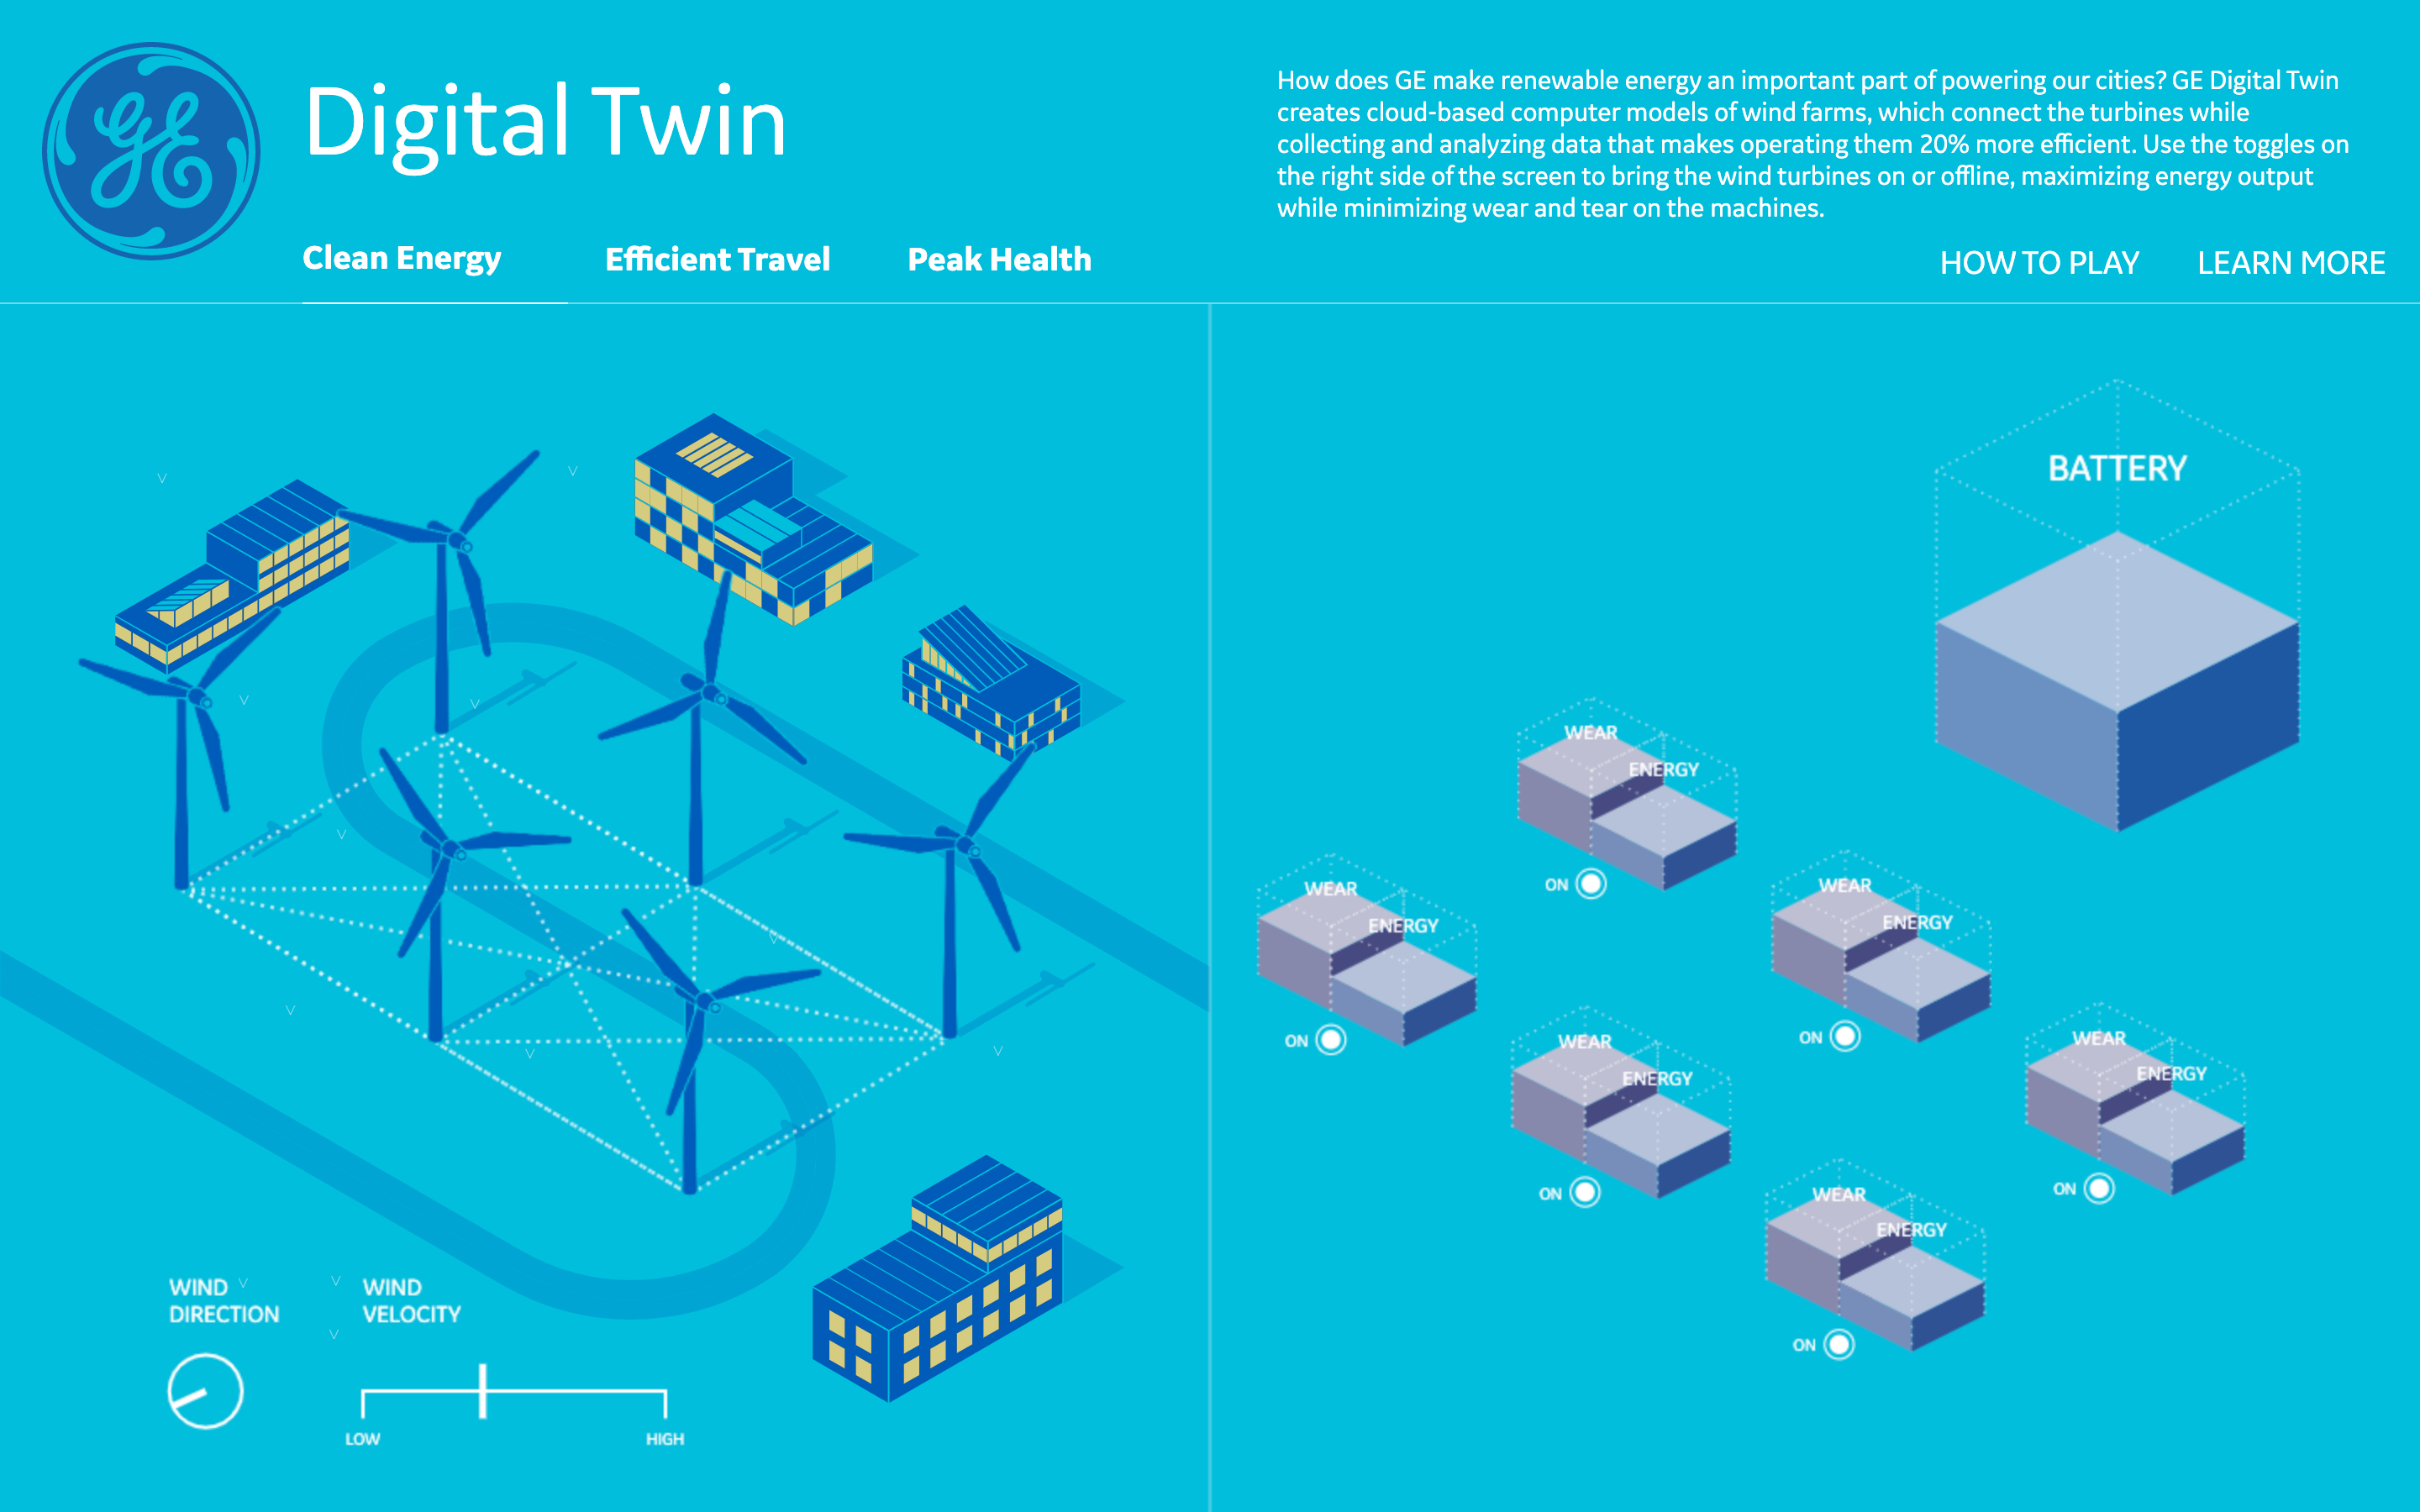
Digital Twin Simulation
Schema Design
DNA
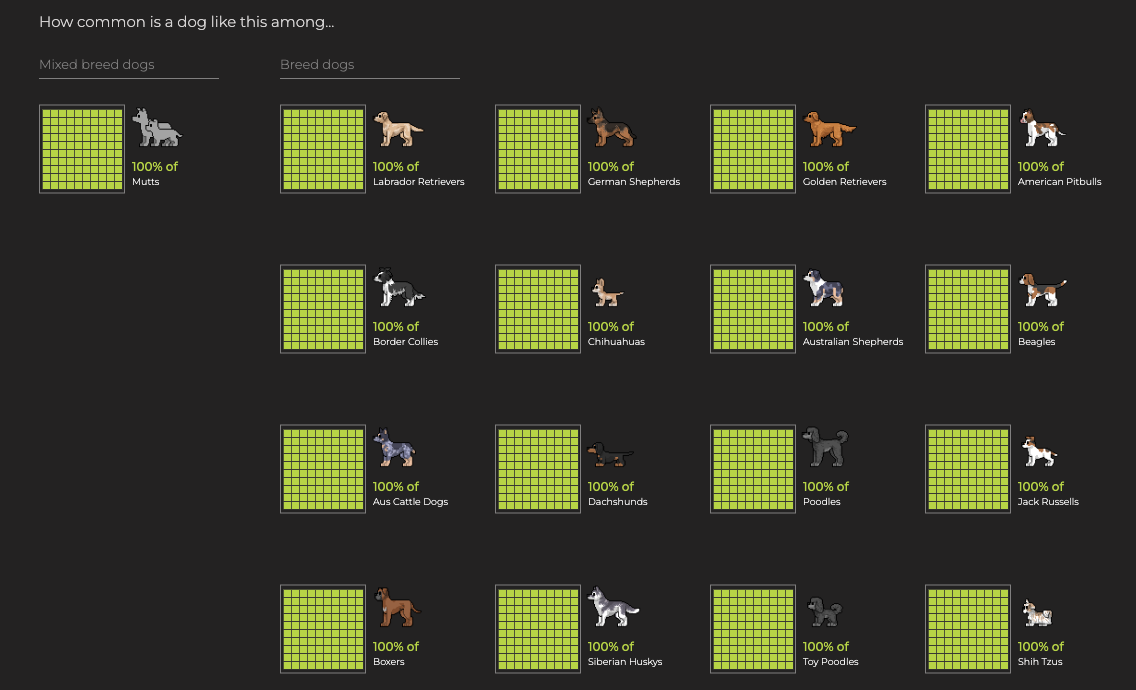
Do You Have a Dream Dog?
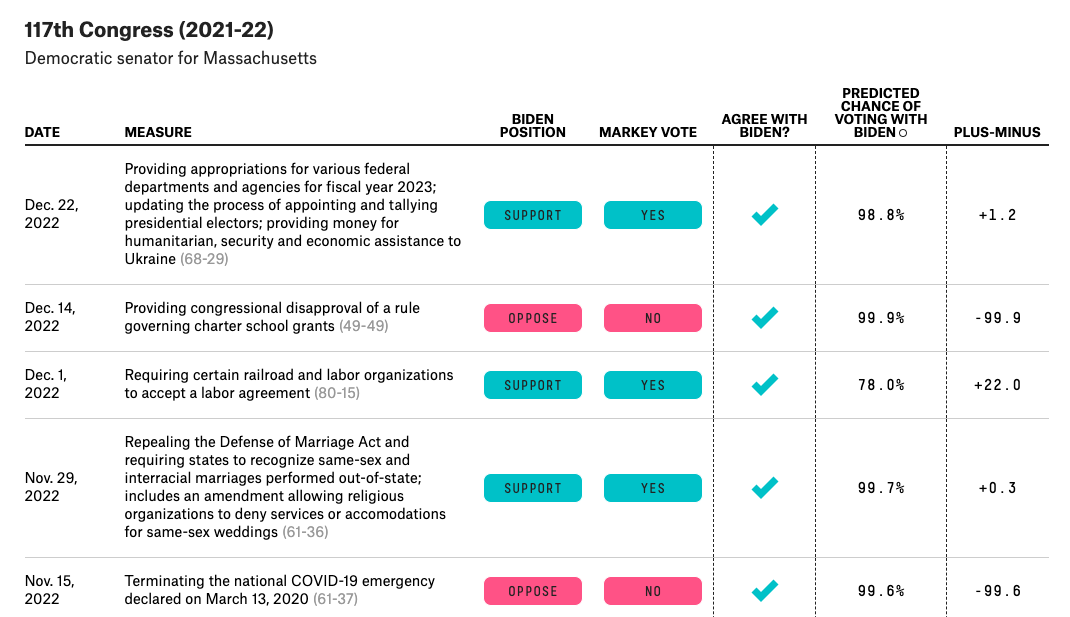
Does Your Member of Congress Vote with or against Biden?
538
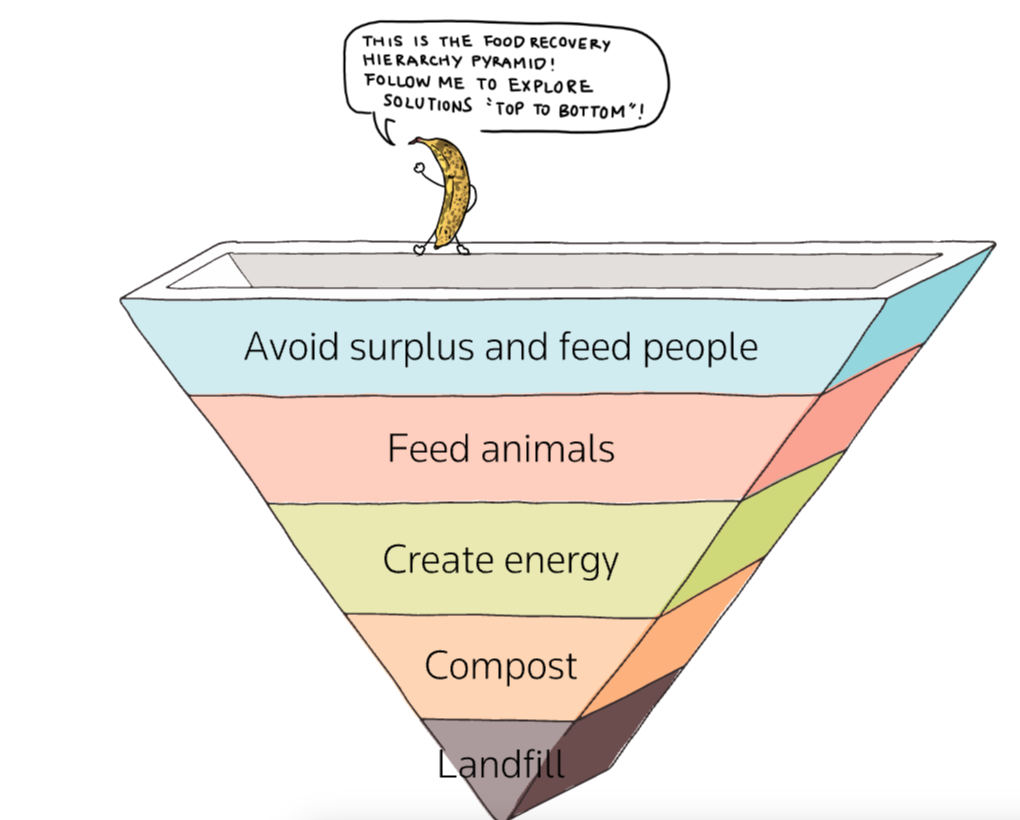
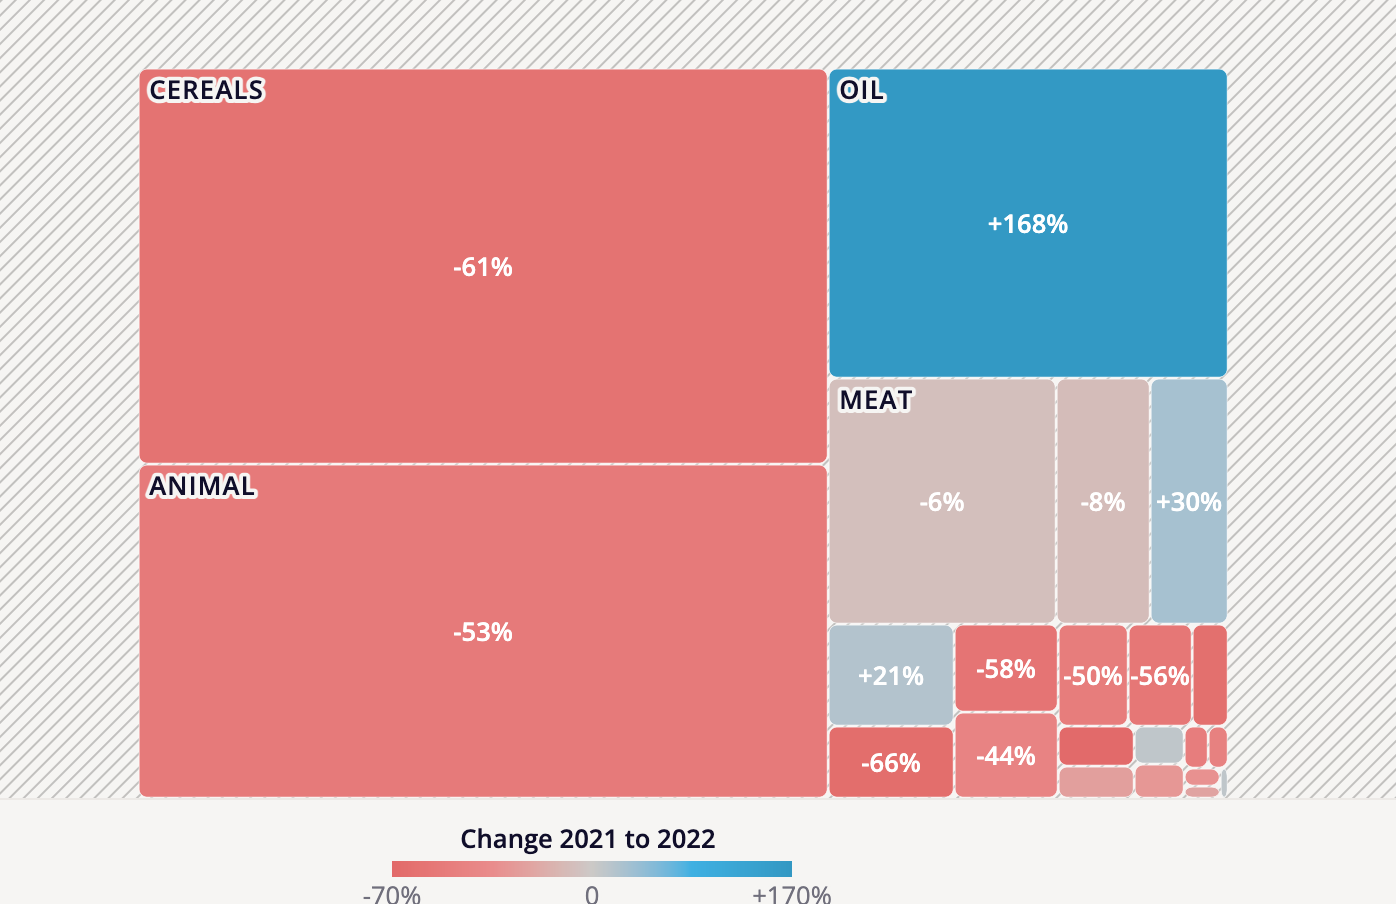
Don’t Waste Food
Reuters
Dotspotting
Stamen Design
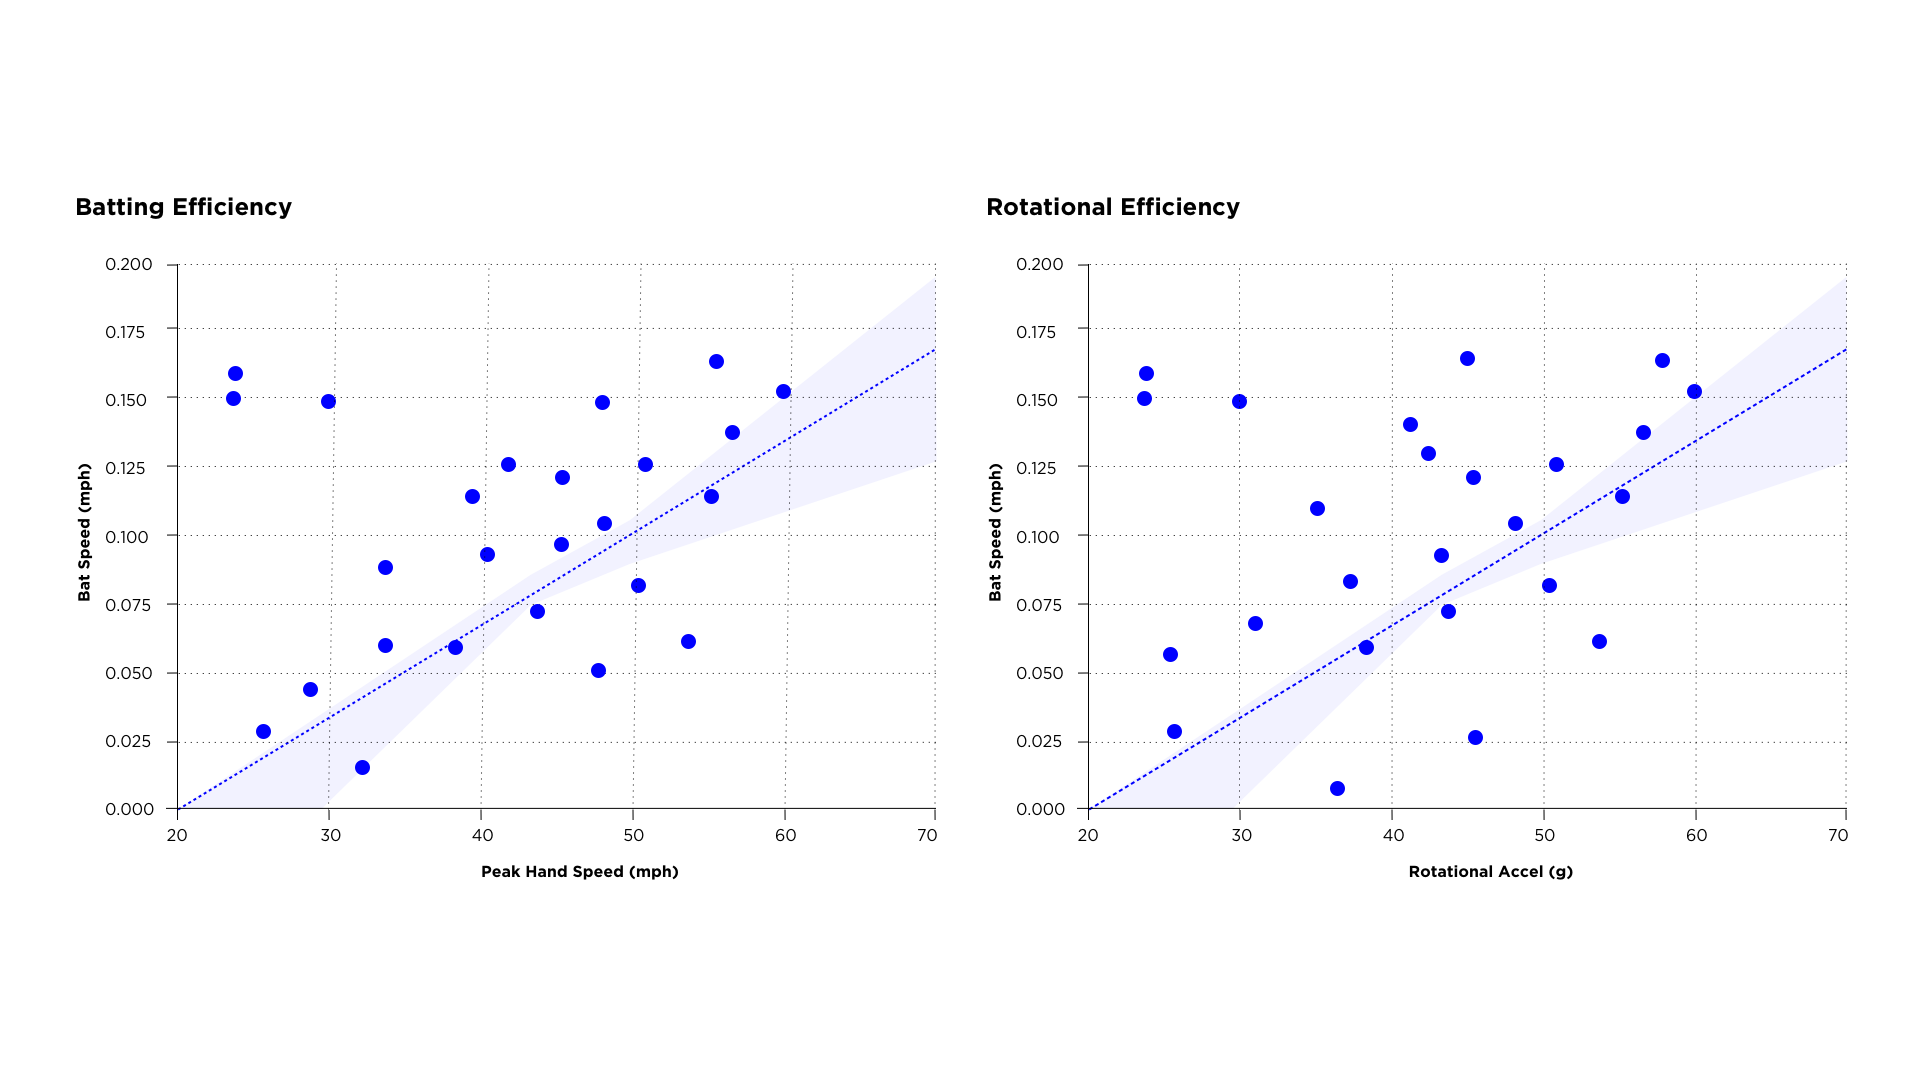
Driveline Baseball Reports
Schema Design
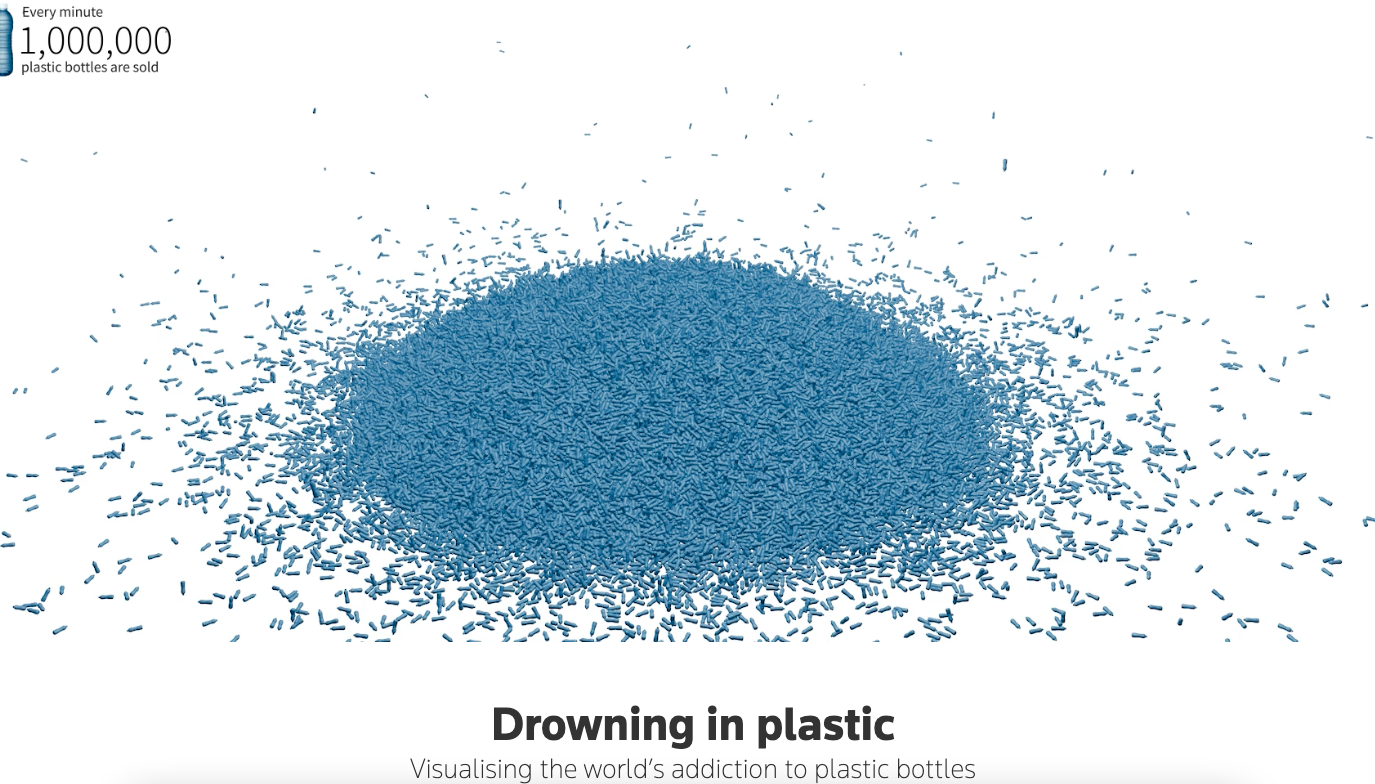
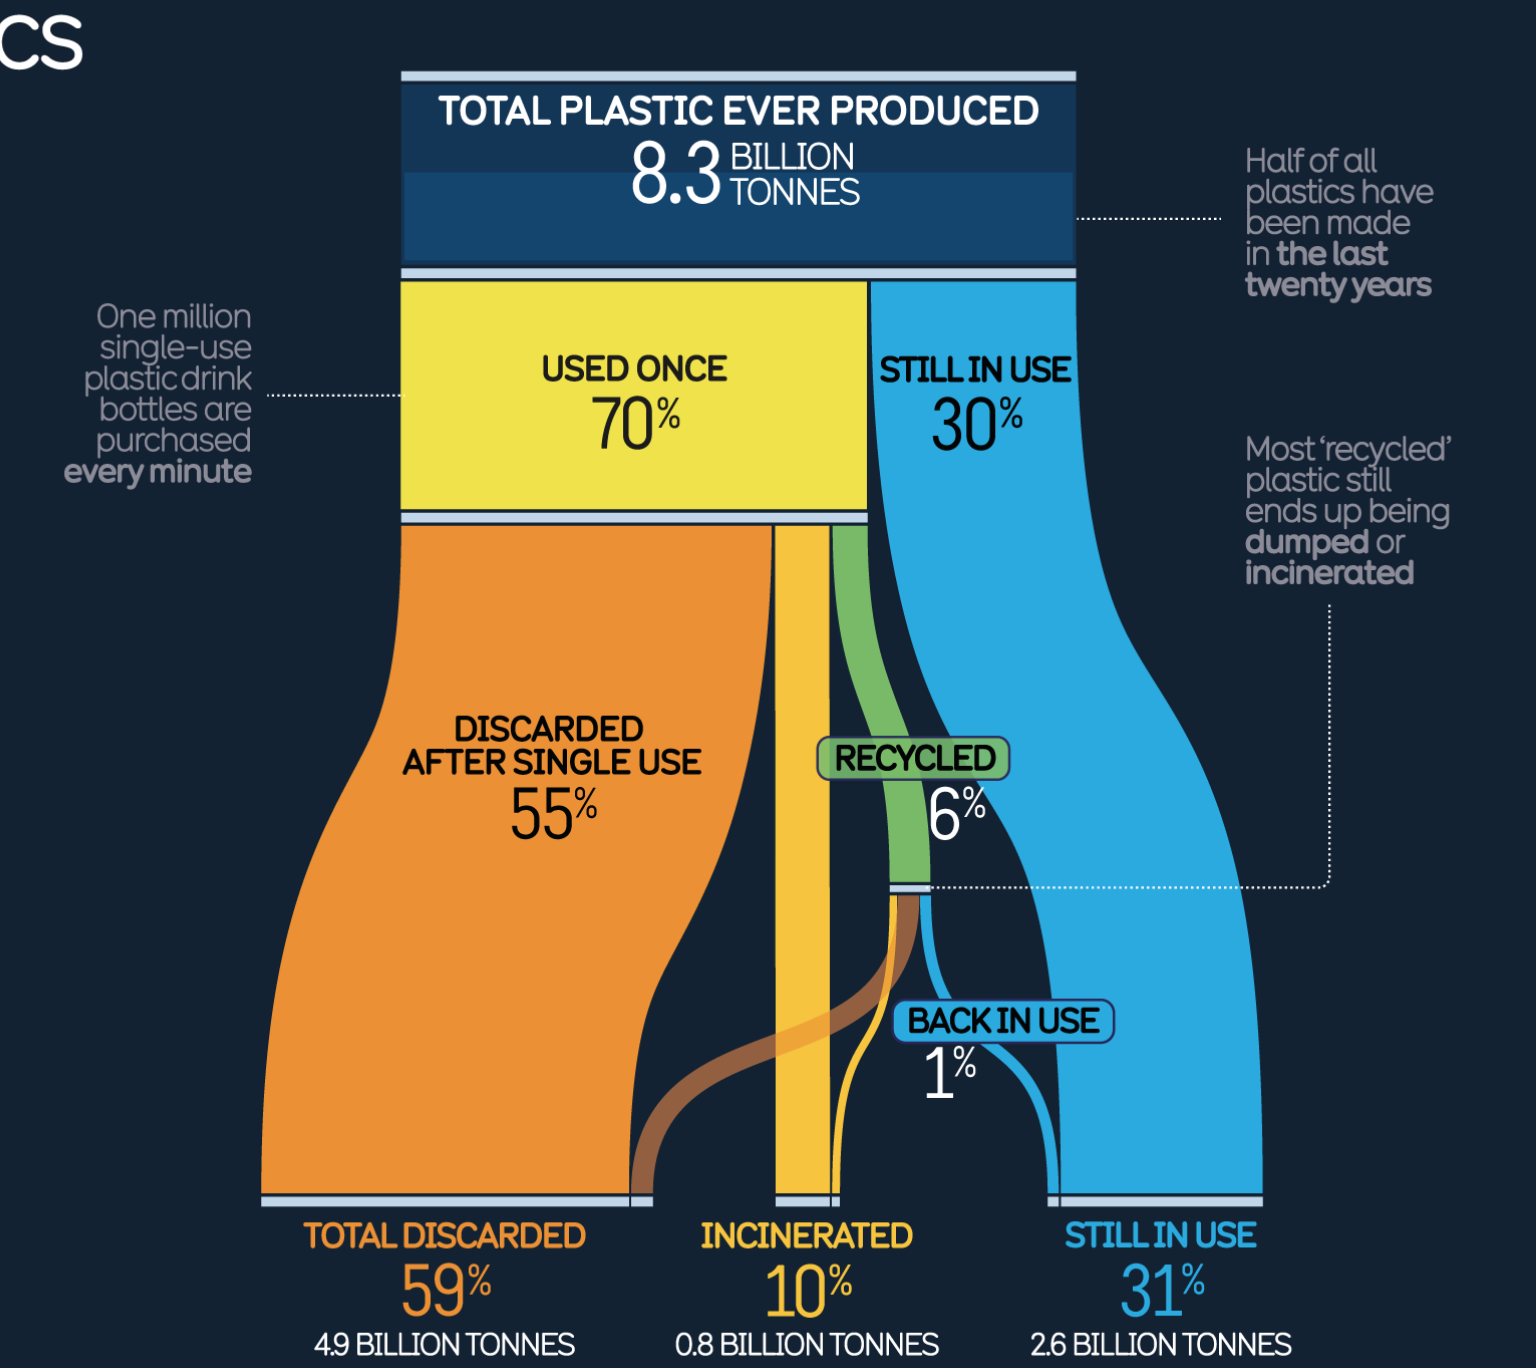
Drowning in Plastic
Reuters
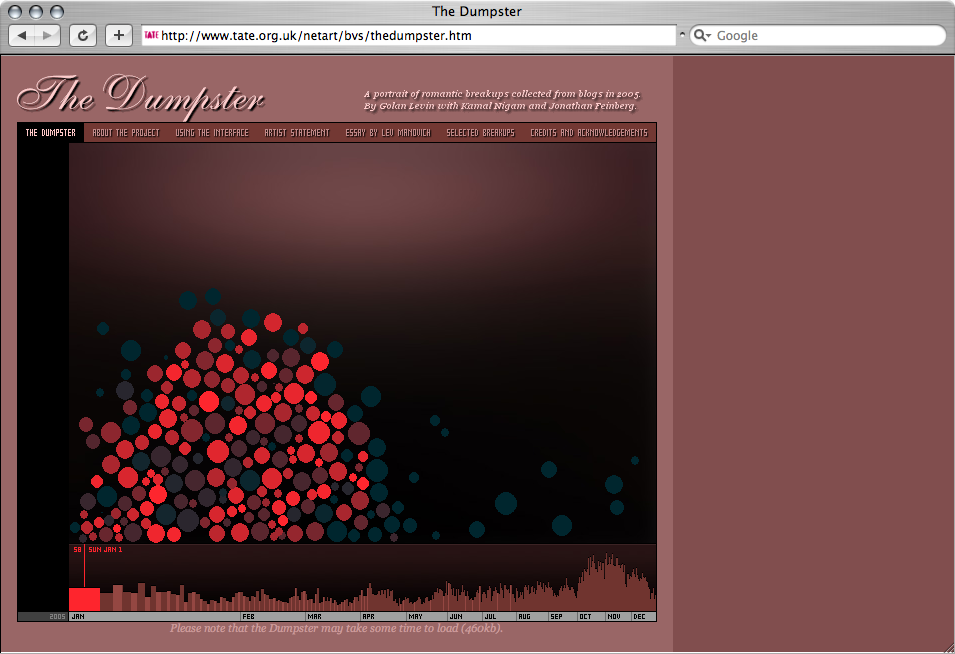
Dumpster
Golan Levin
Dymaxion Map
Buckminster Fuller
Dynamicland
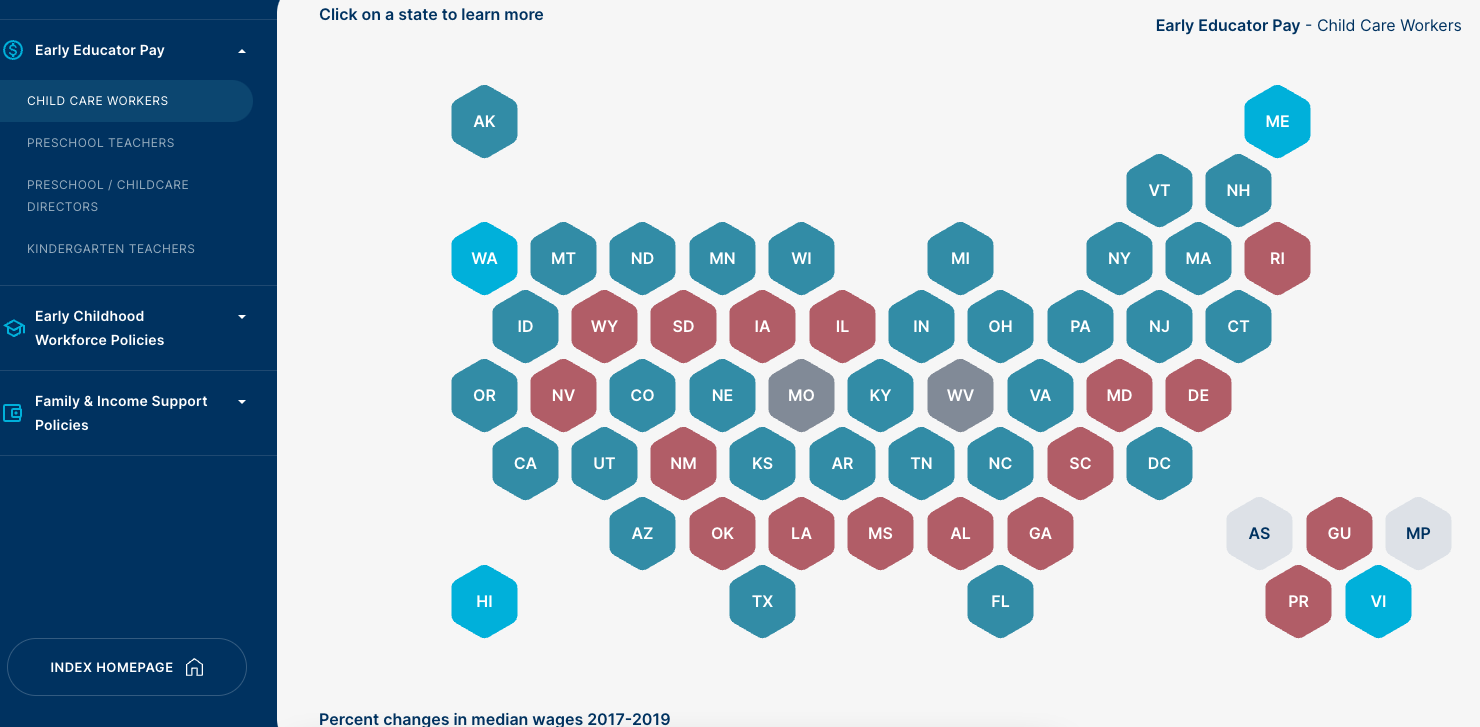
Early Childhood Workforceindex 2020
UC Berkeley
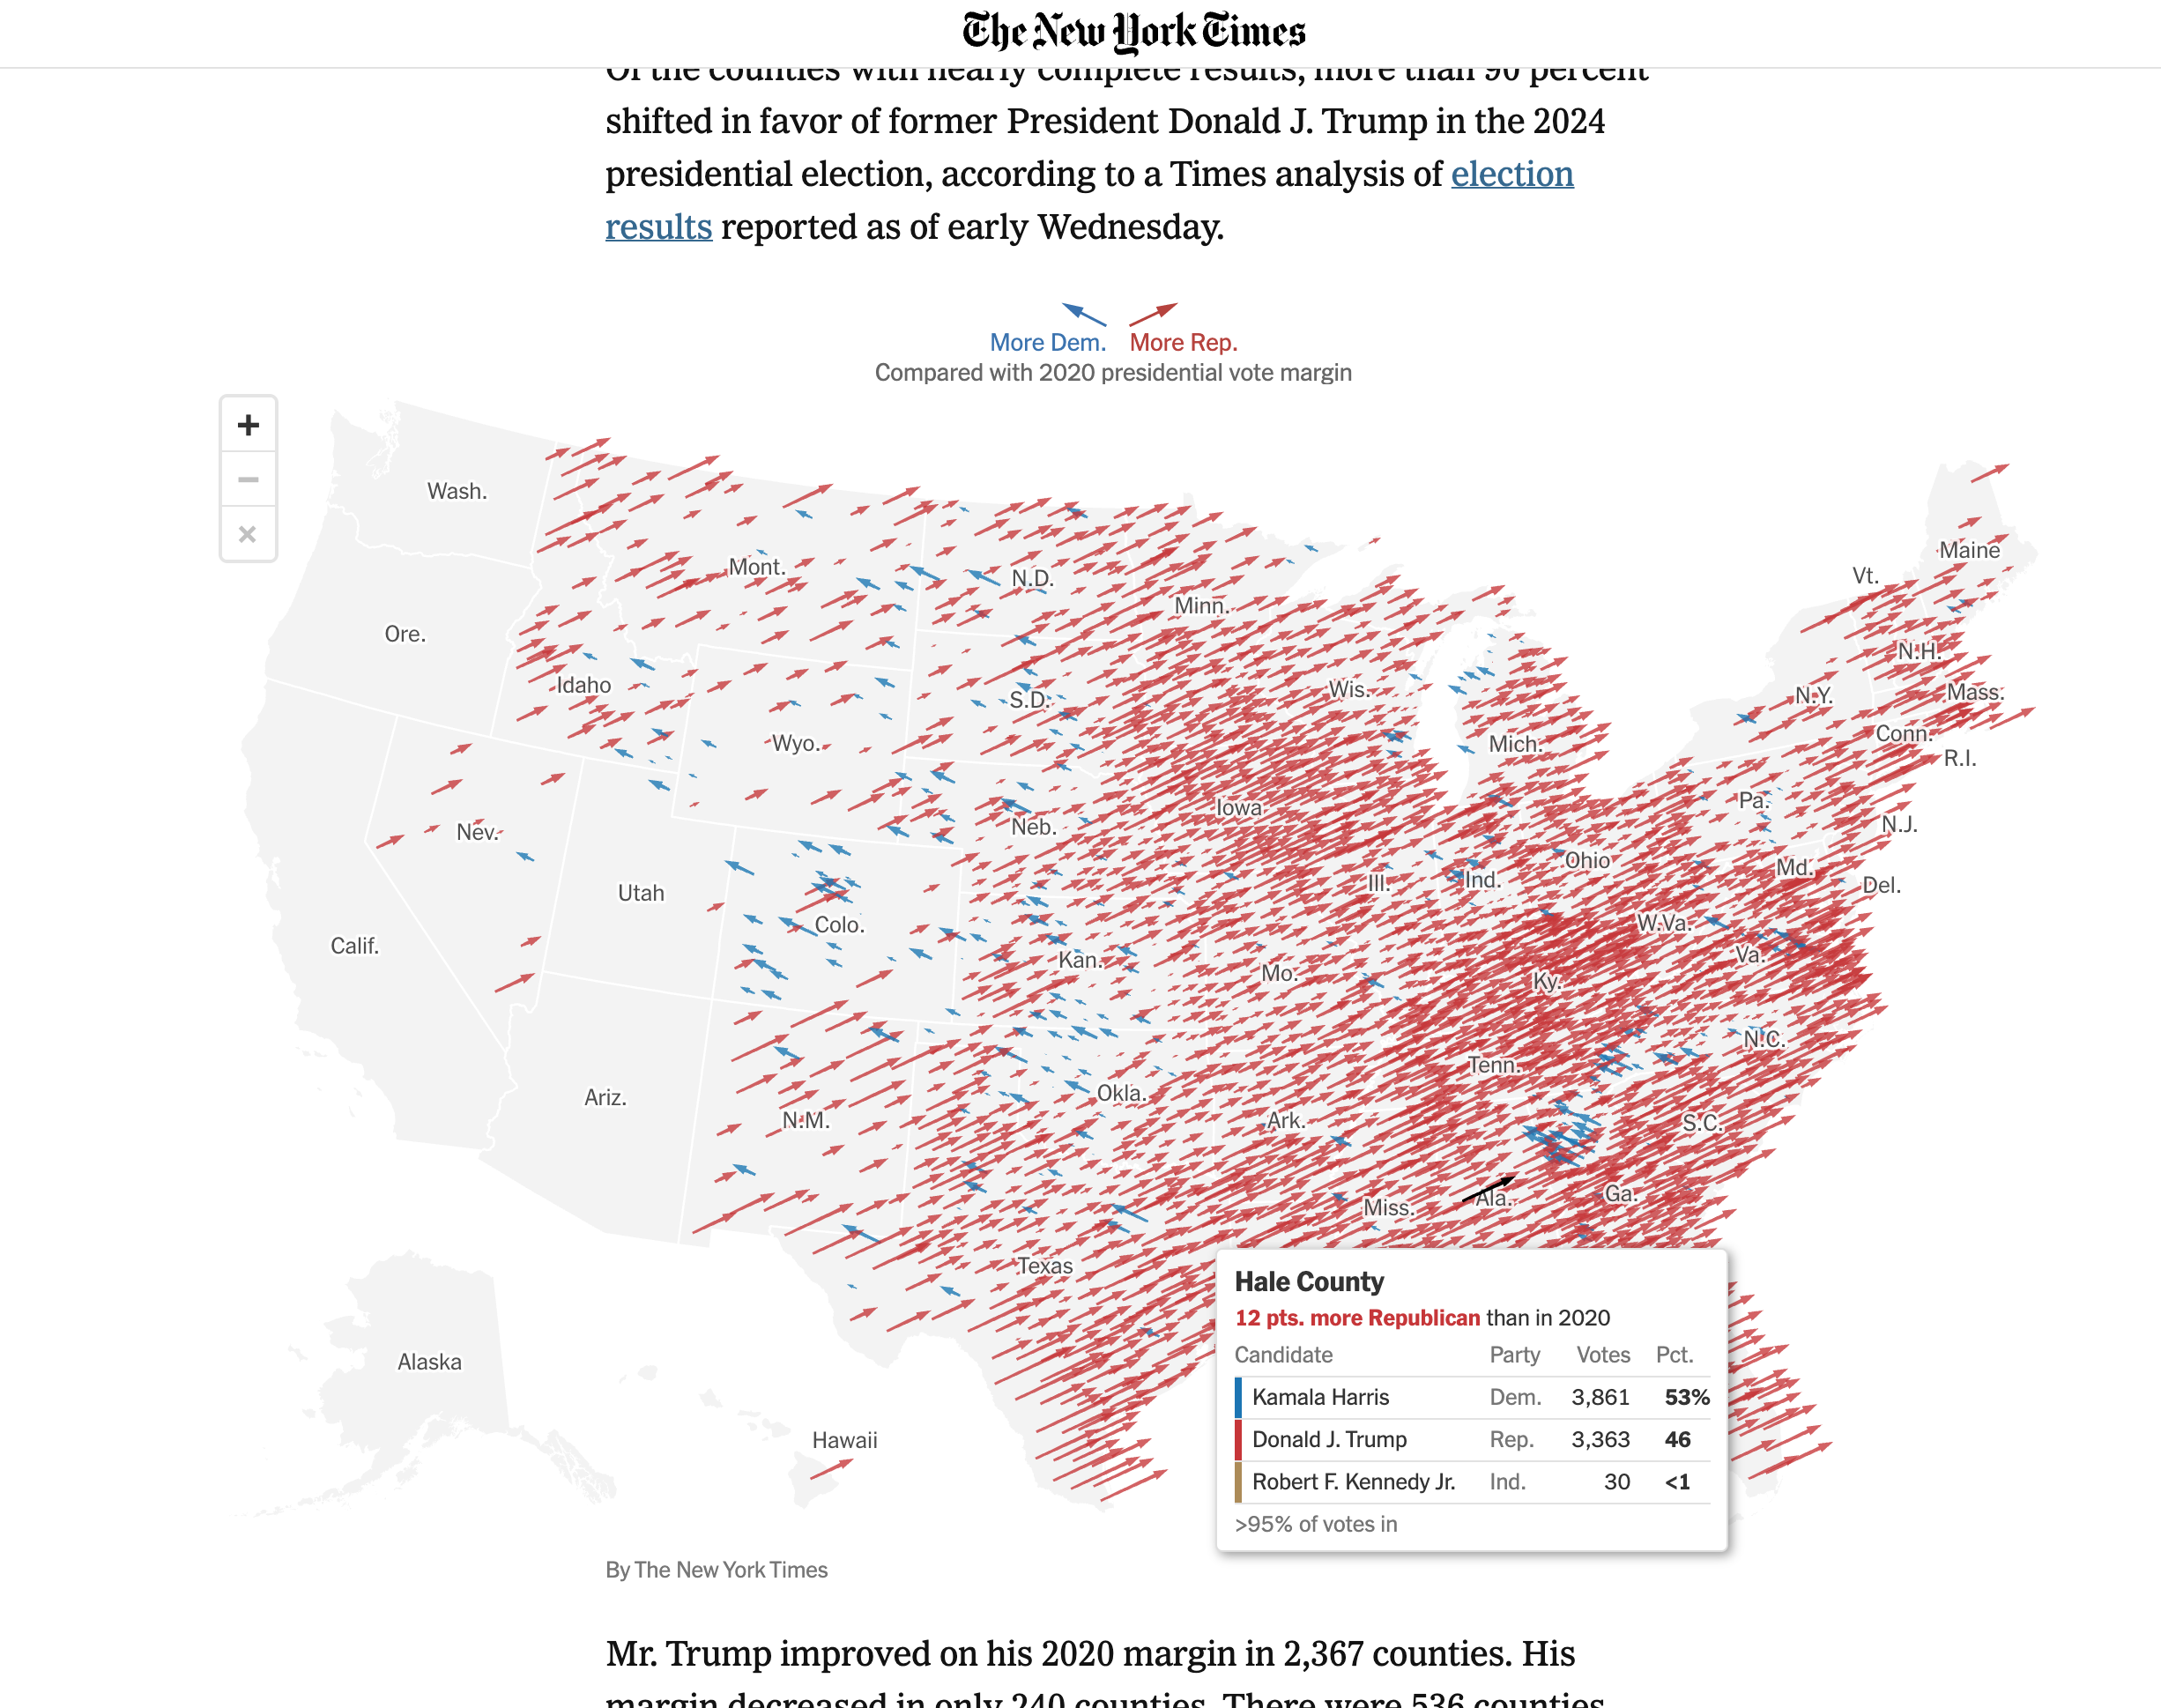
Early Results Show a Red Shift across the U.S.
The New York Times
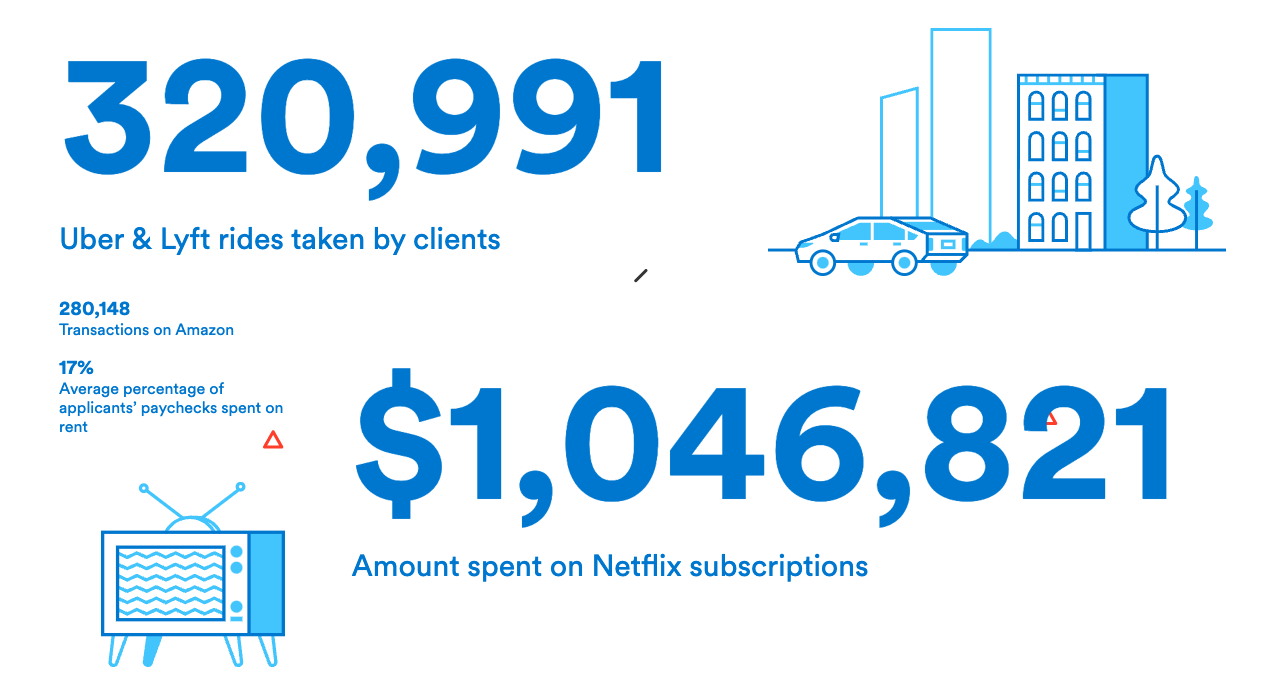
Earnest Review 2015
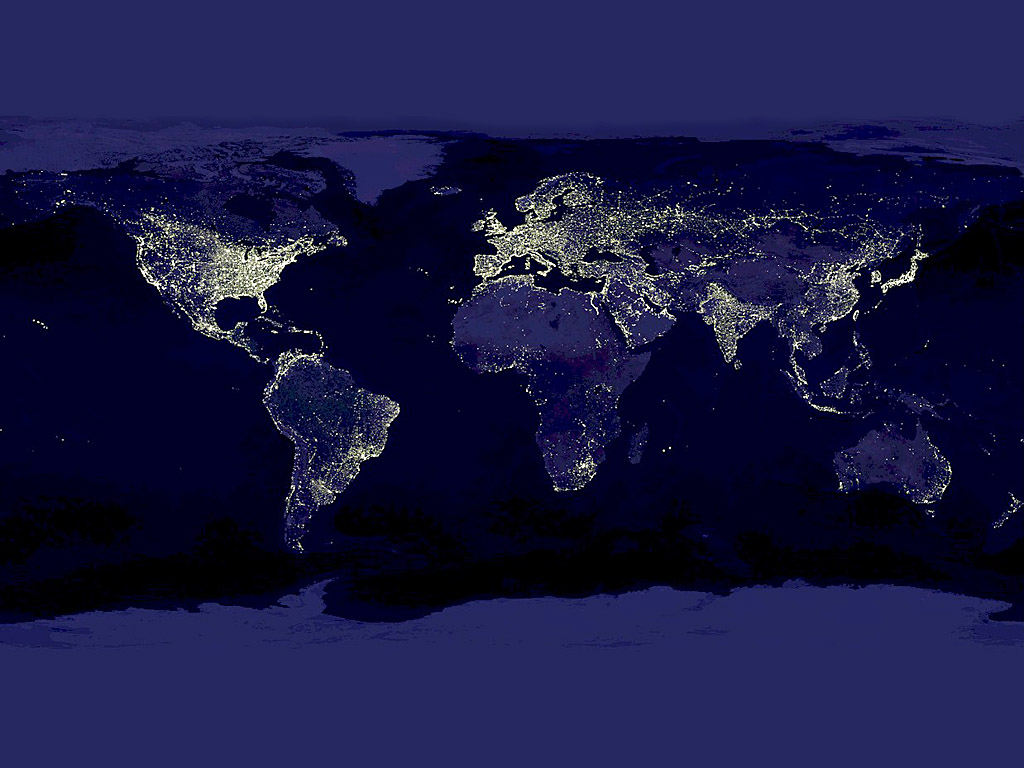
Earth at Night
NASA

Eckermann Stock Market Sculpture
Eckermann

Eco
Eco-solve: Dashboard
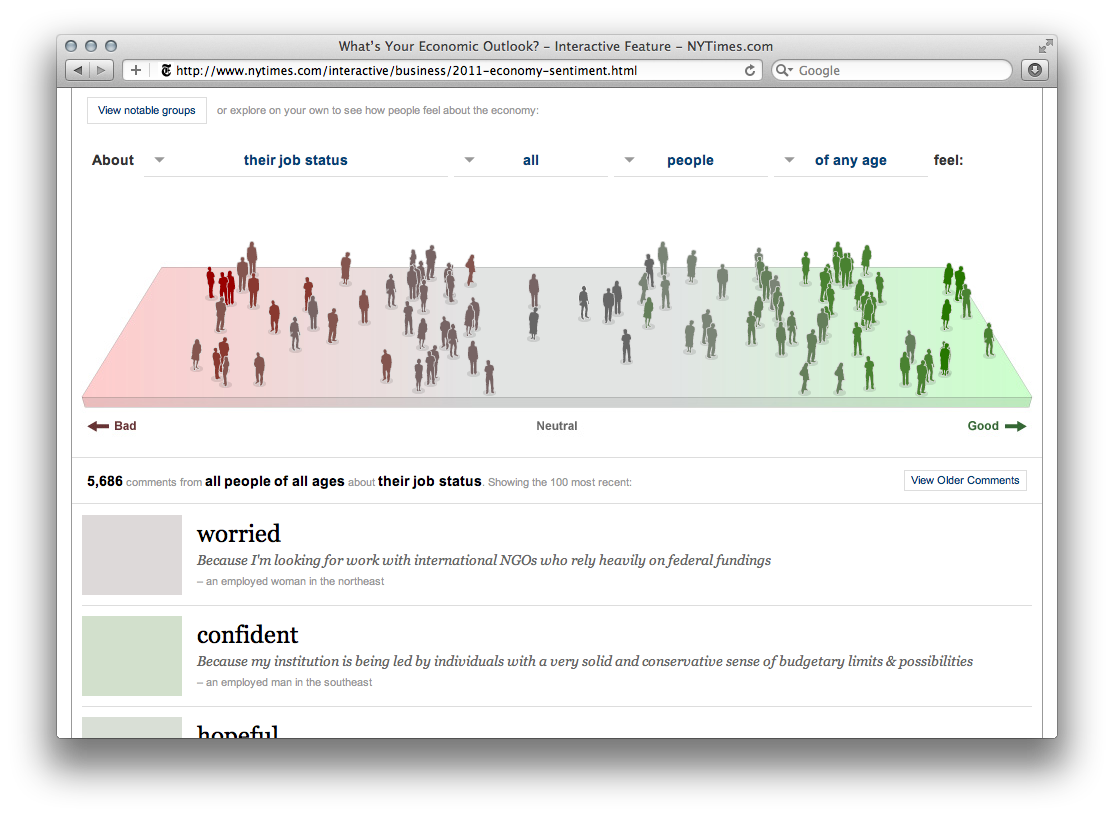
Economic Outlook
New York Times Graphics
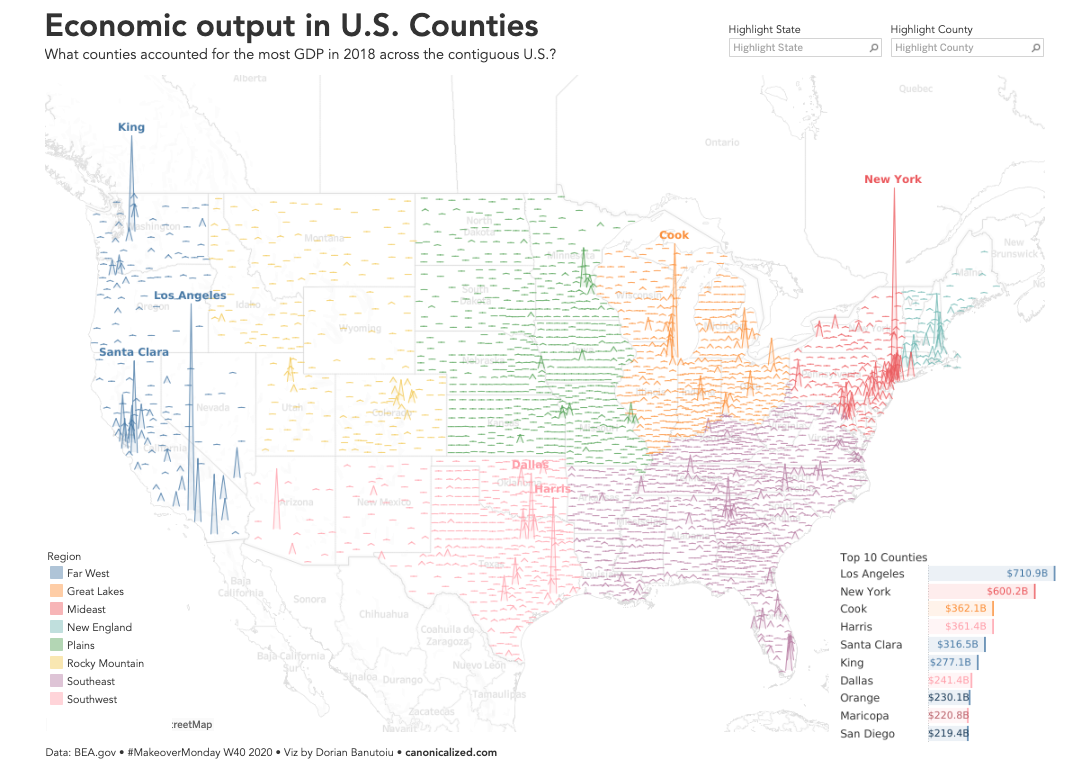
Economic Output in U.S. Counties
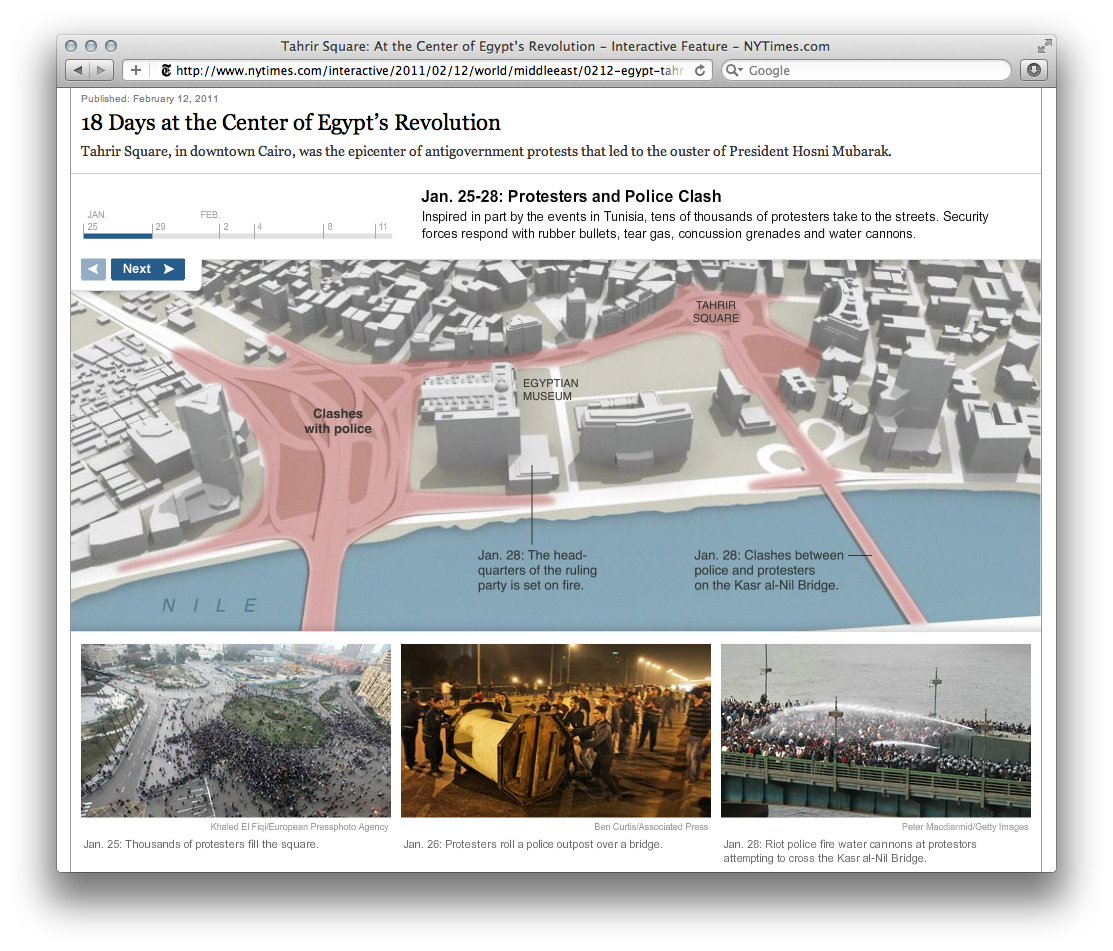
Egypt Coverage
New York Times Graphics
Ekata Microsite
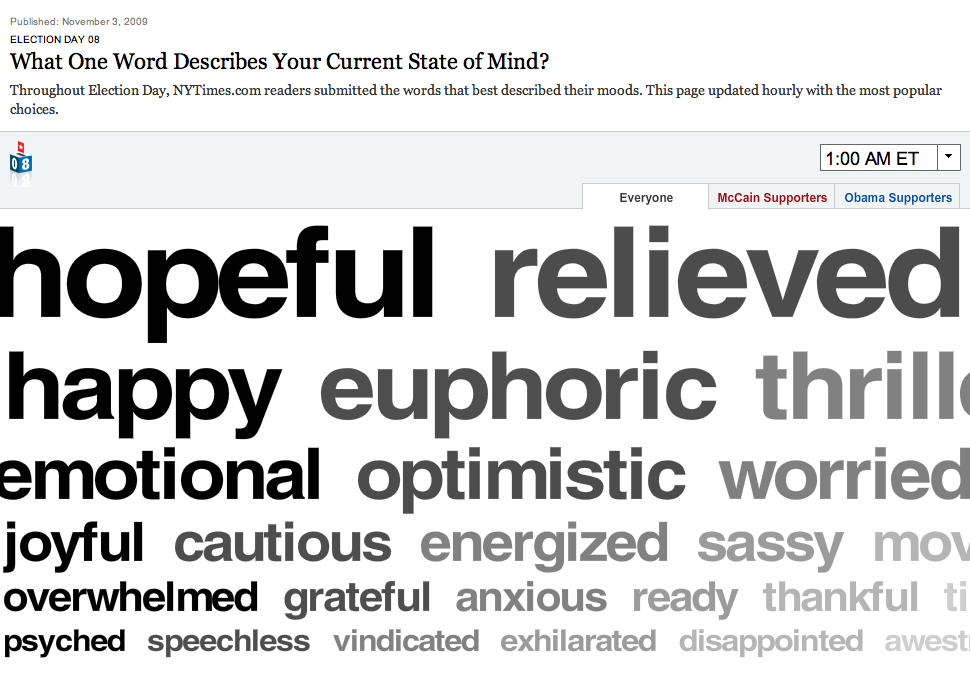
Election Day
New York Times Graphics
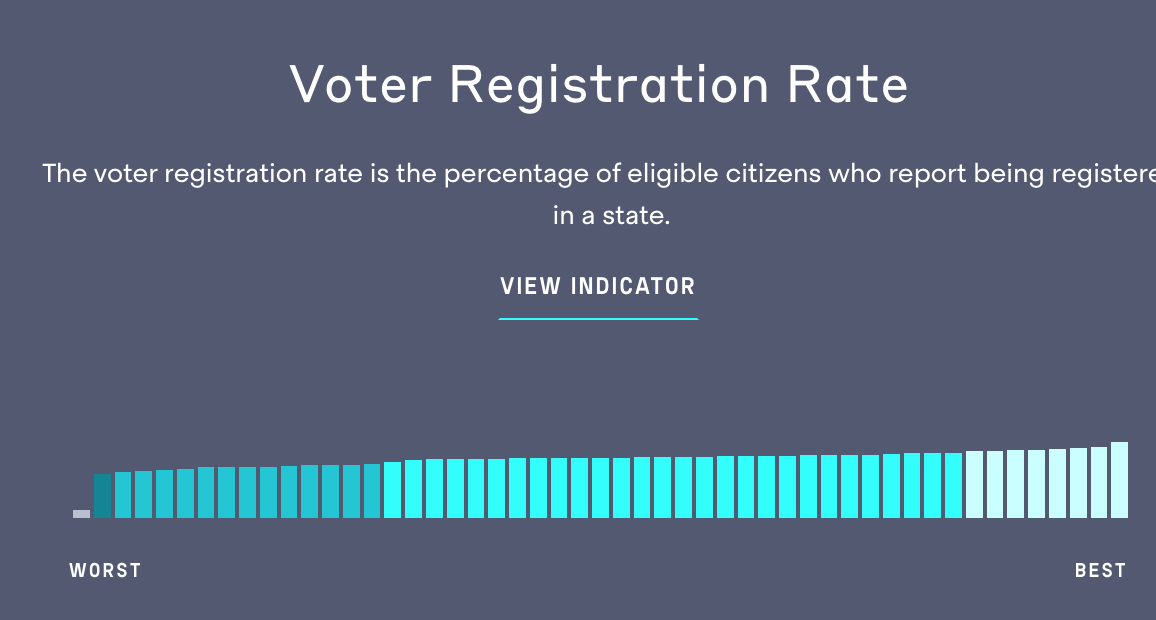
Elections Performance Index
MIT
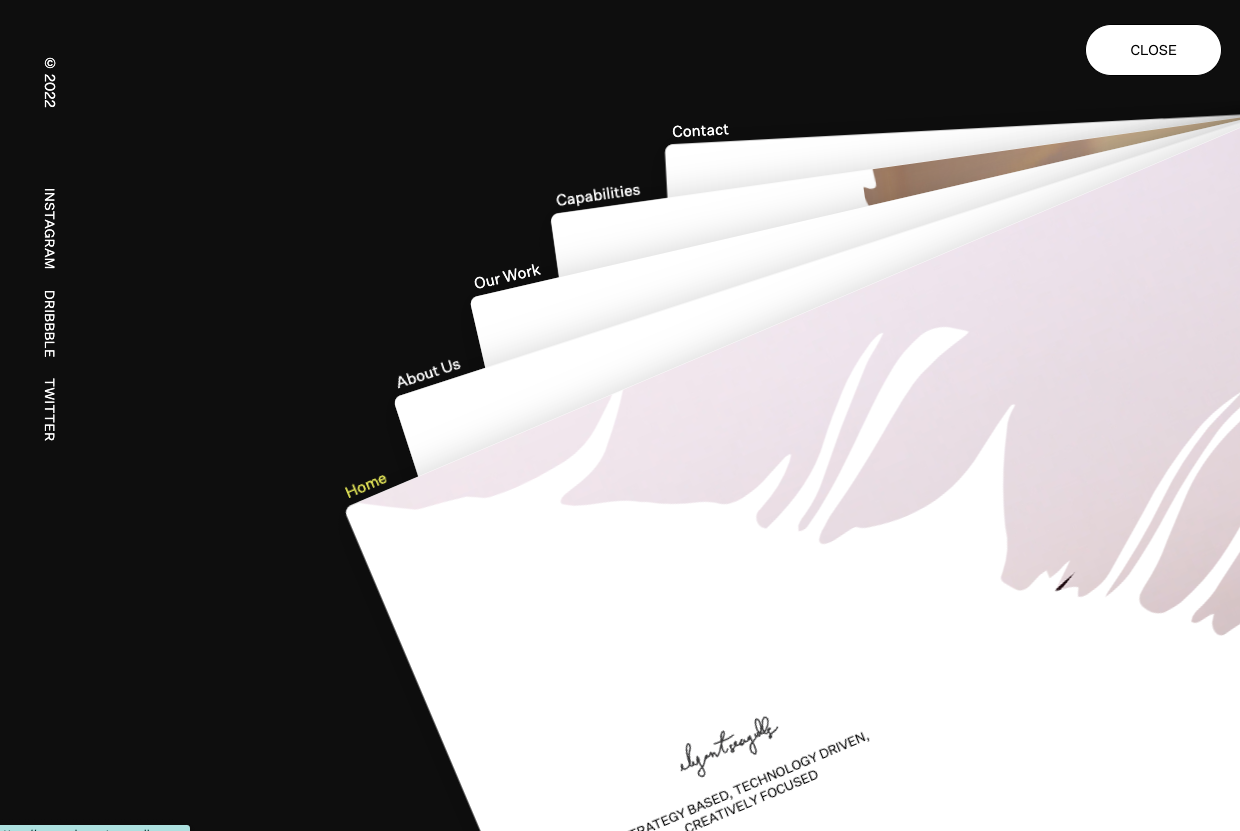
Elegant Seagulls
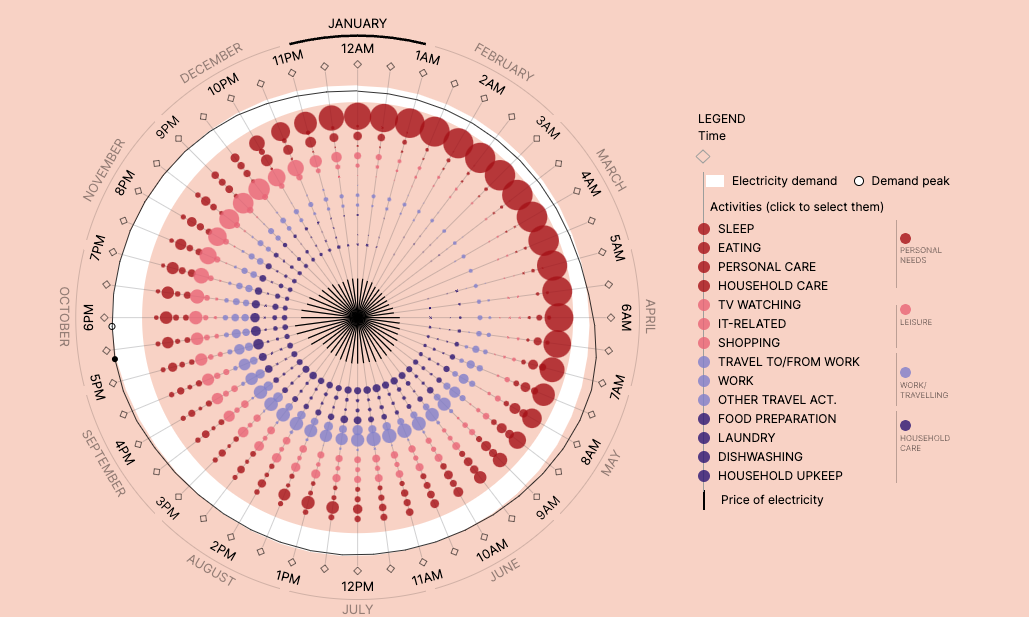
Energy Demand Flexibility
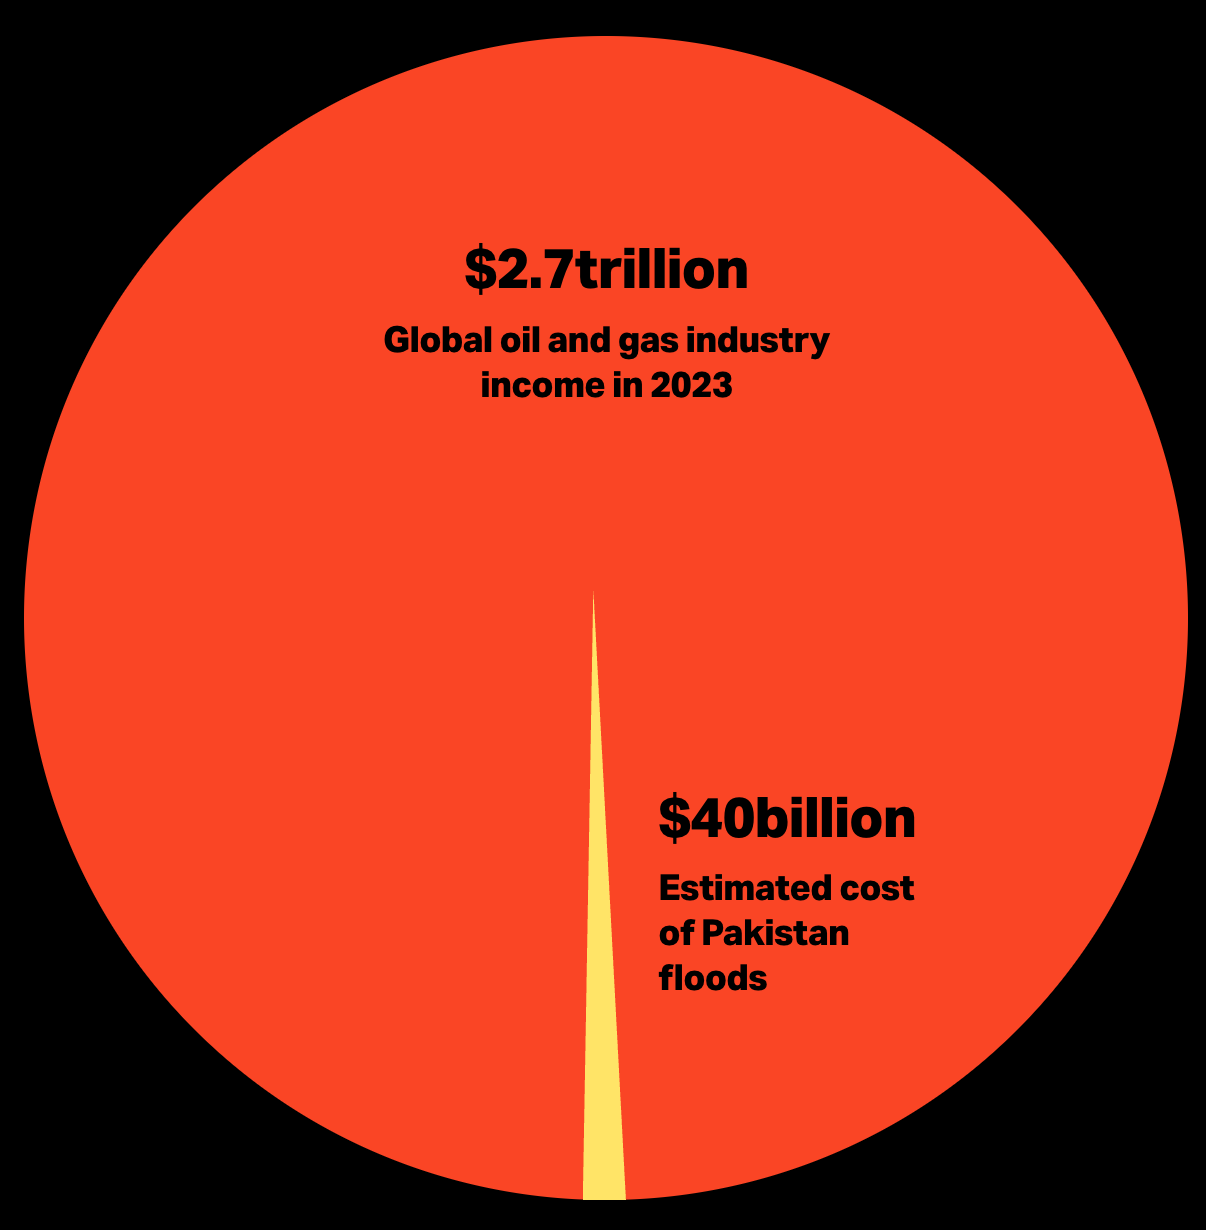
Energy Profits
Engie Engage
Schema Design
Engie Portal
Schema Design
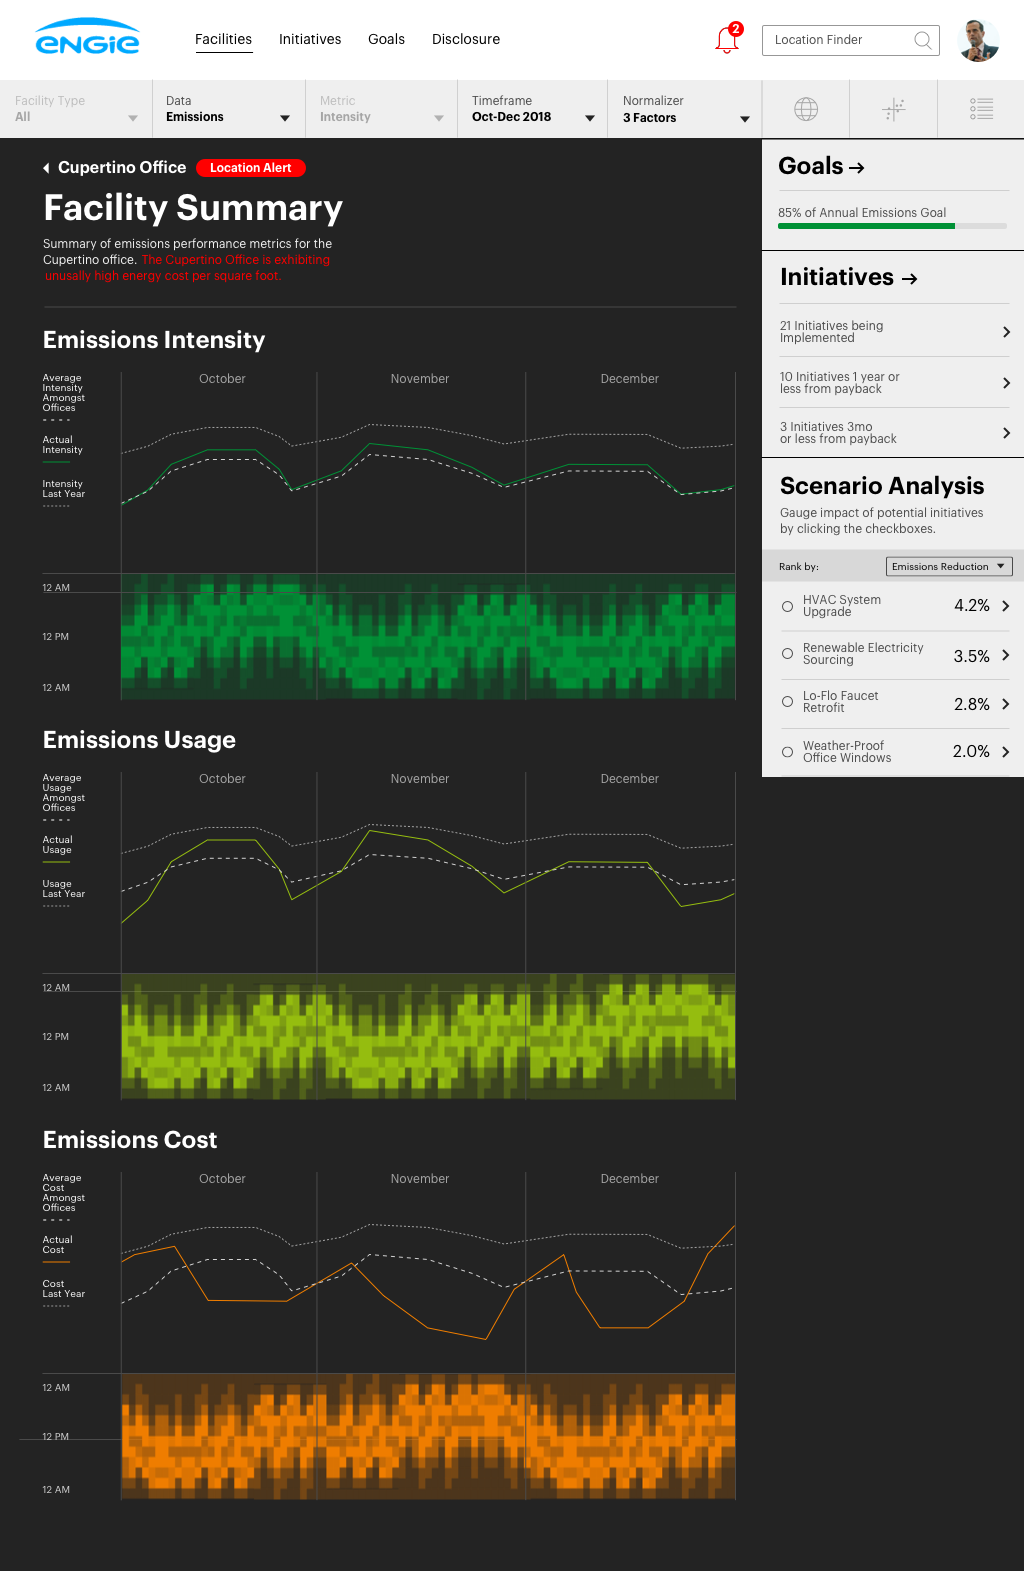
Engie Sustainability Vision Prototype
Schema Design
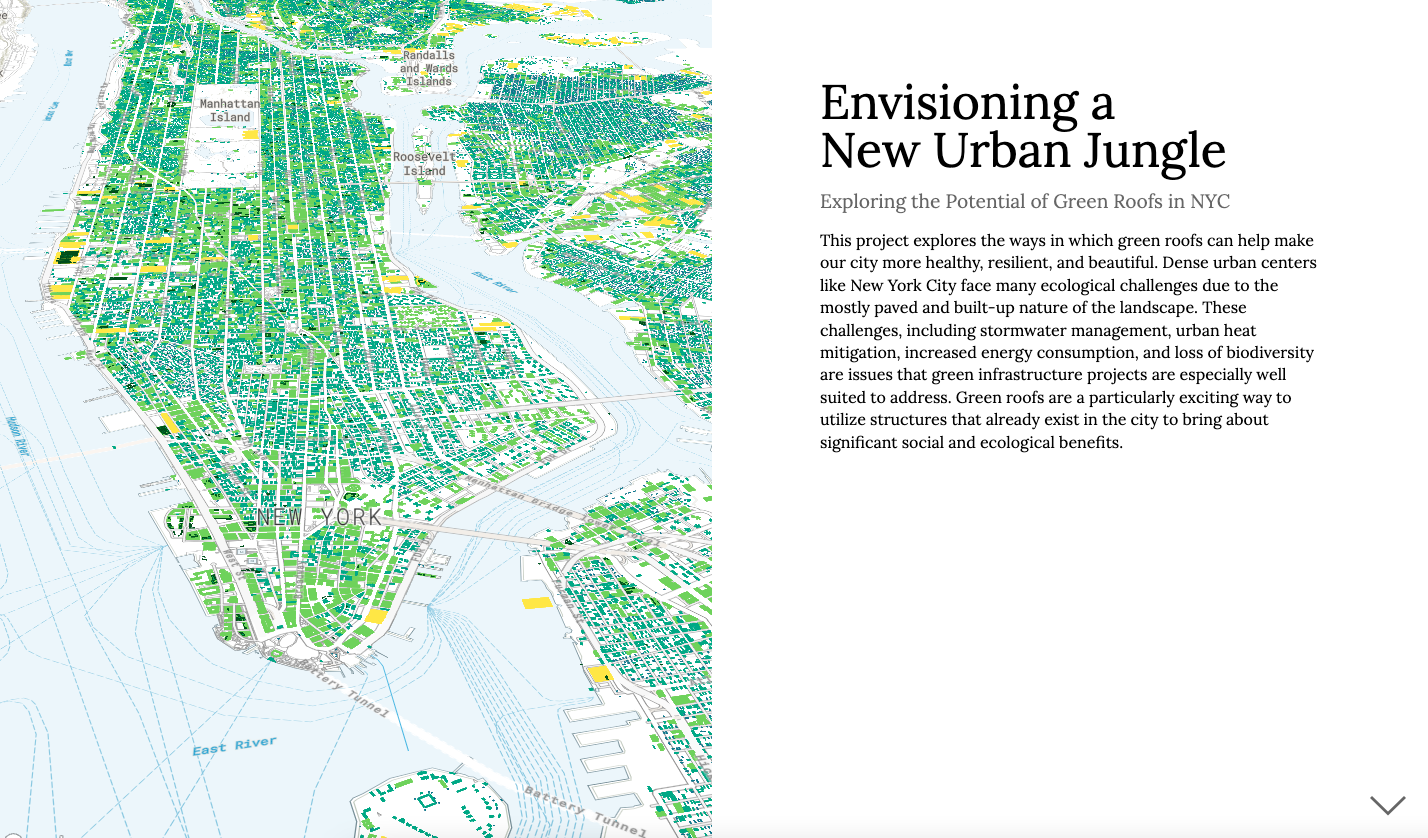
Envisioning a New Urban Jungle

Eurovision
Reuters
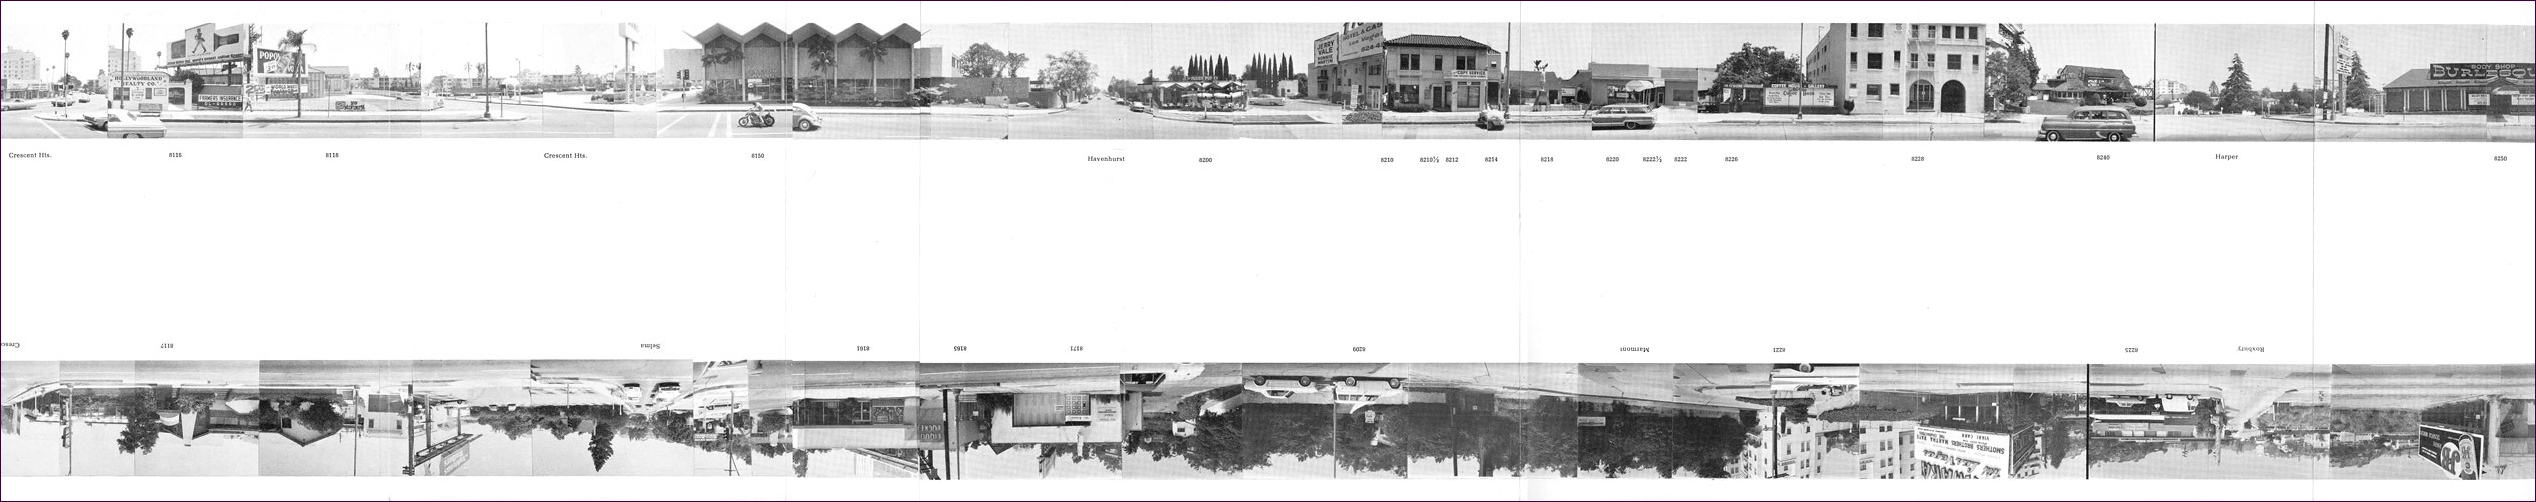
Every Building on the Sunset Strip
Ed Ruscha
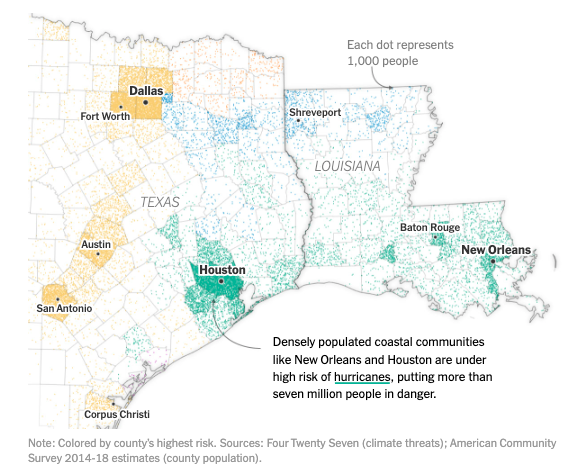
Every Place Has Its Own Climate Risk. What is IT Where You Live?
The New York Times
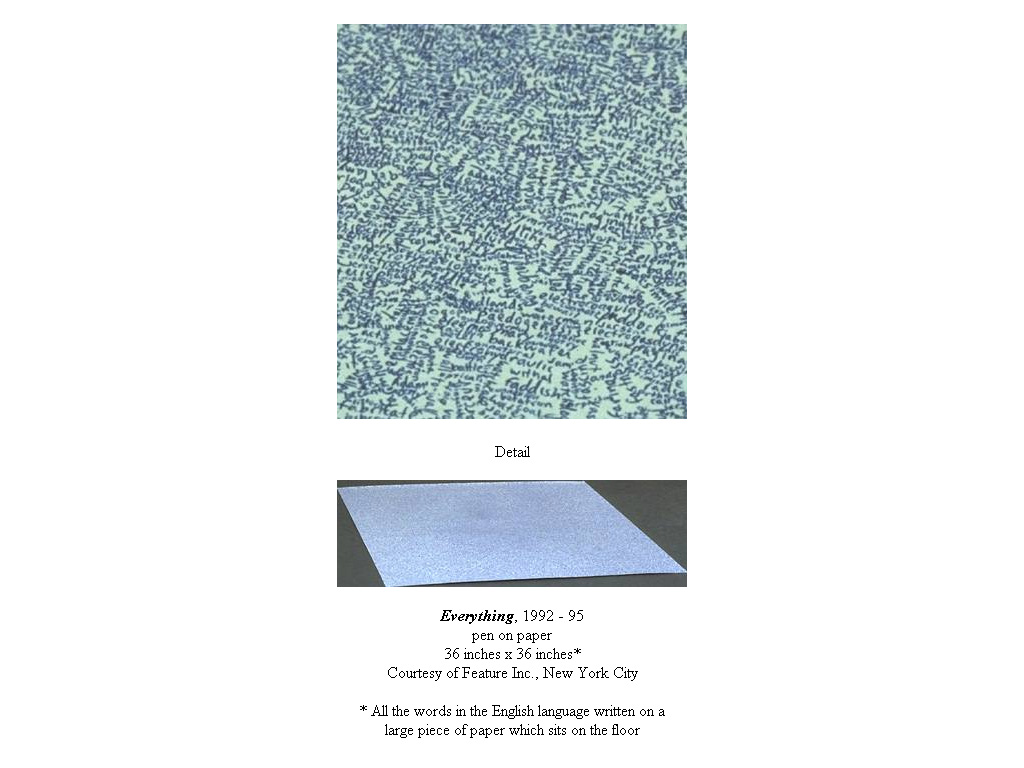
Everything
Tom Friedman
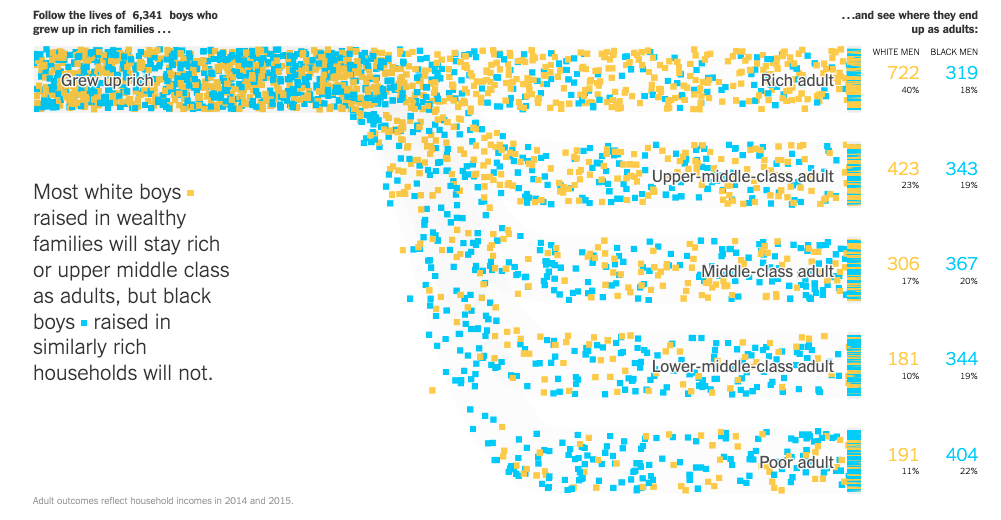
Extensive Data Shows Punishing Reach of Racism for Black Boys
The New York Times
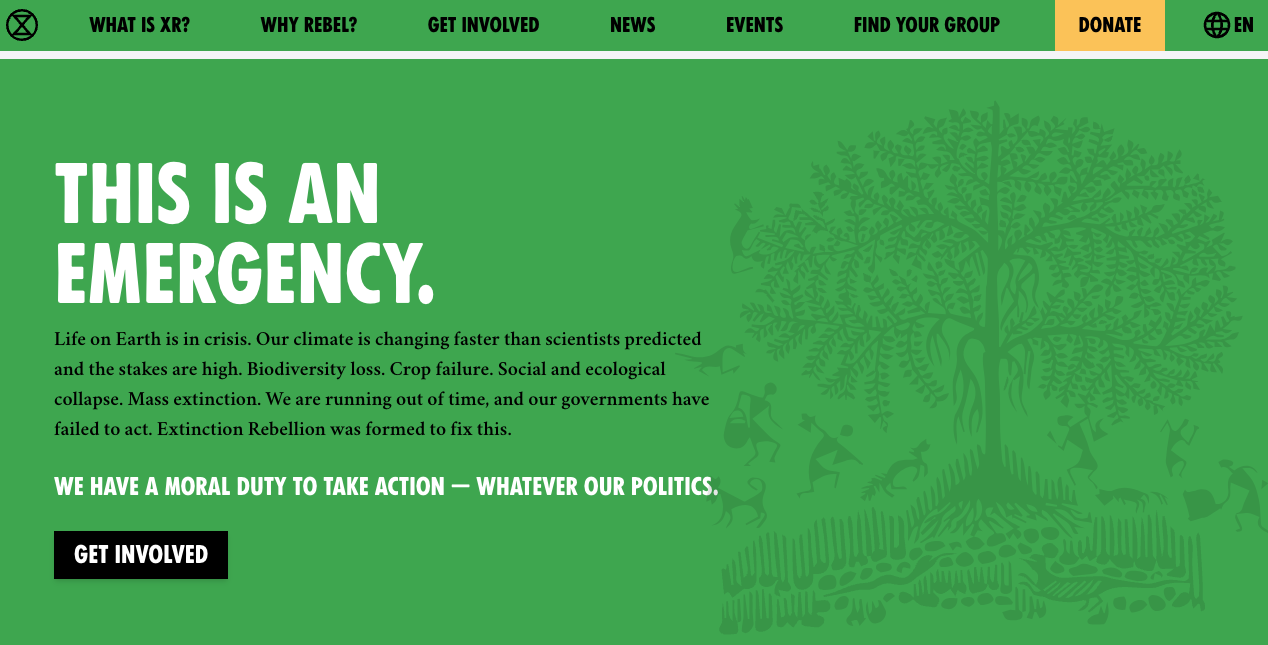
Extinction Rebellion
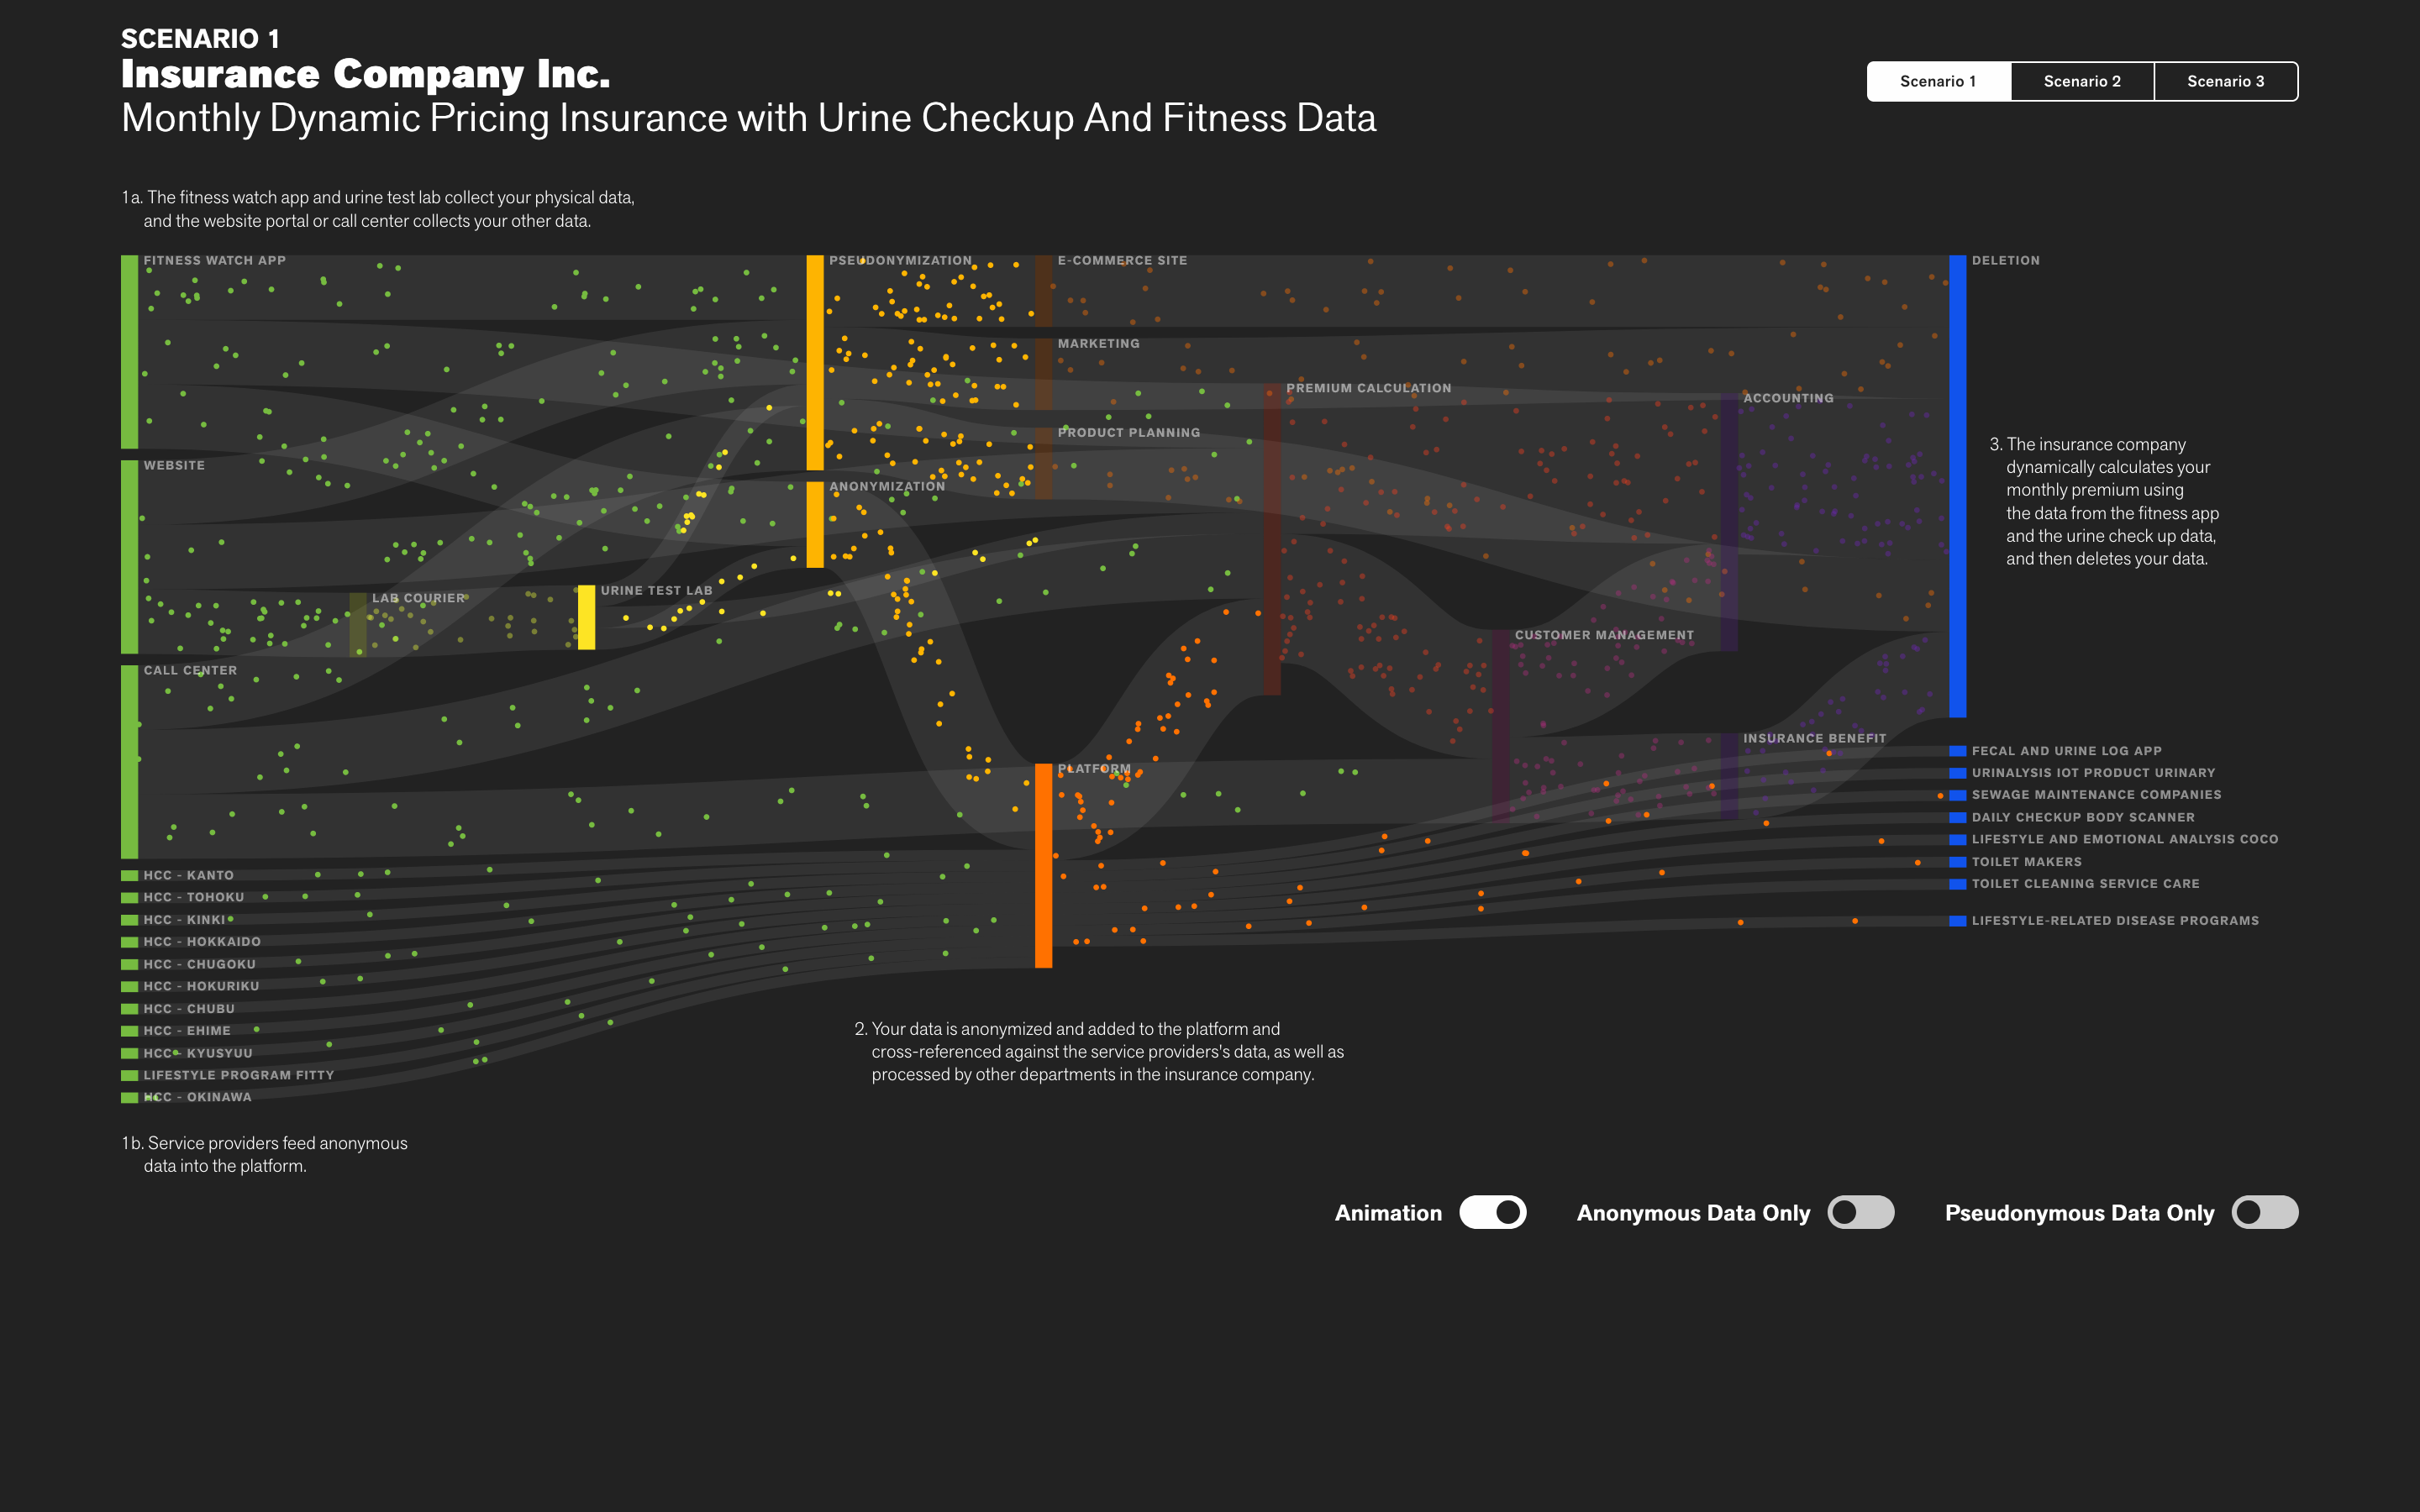
Eyes, Japan Privacy Visualization
Schema Design
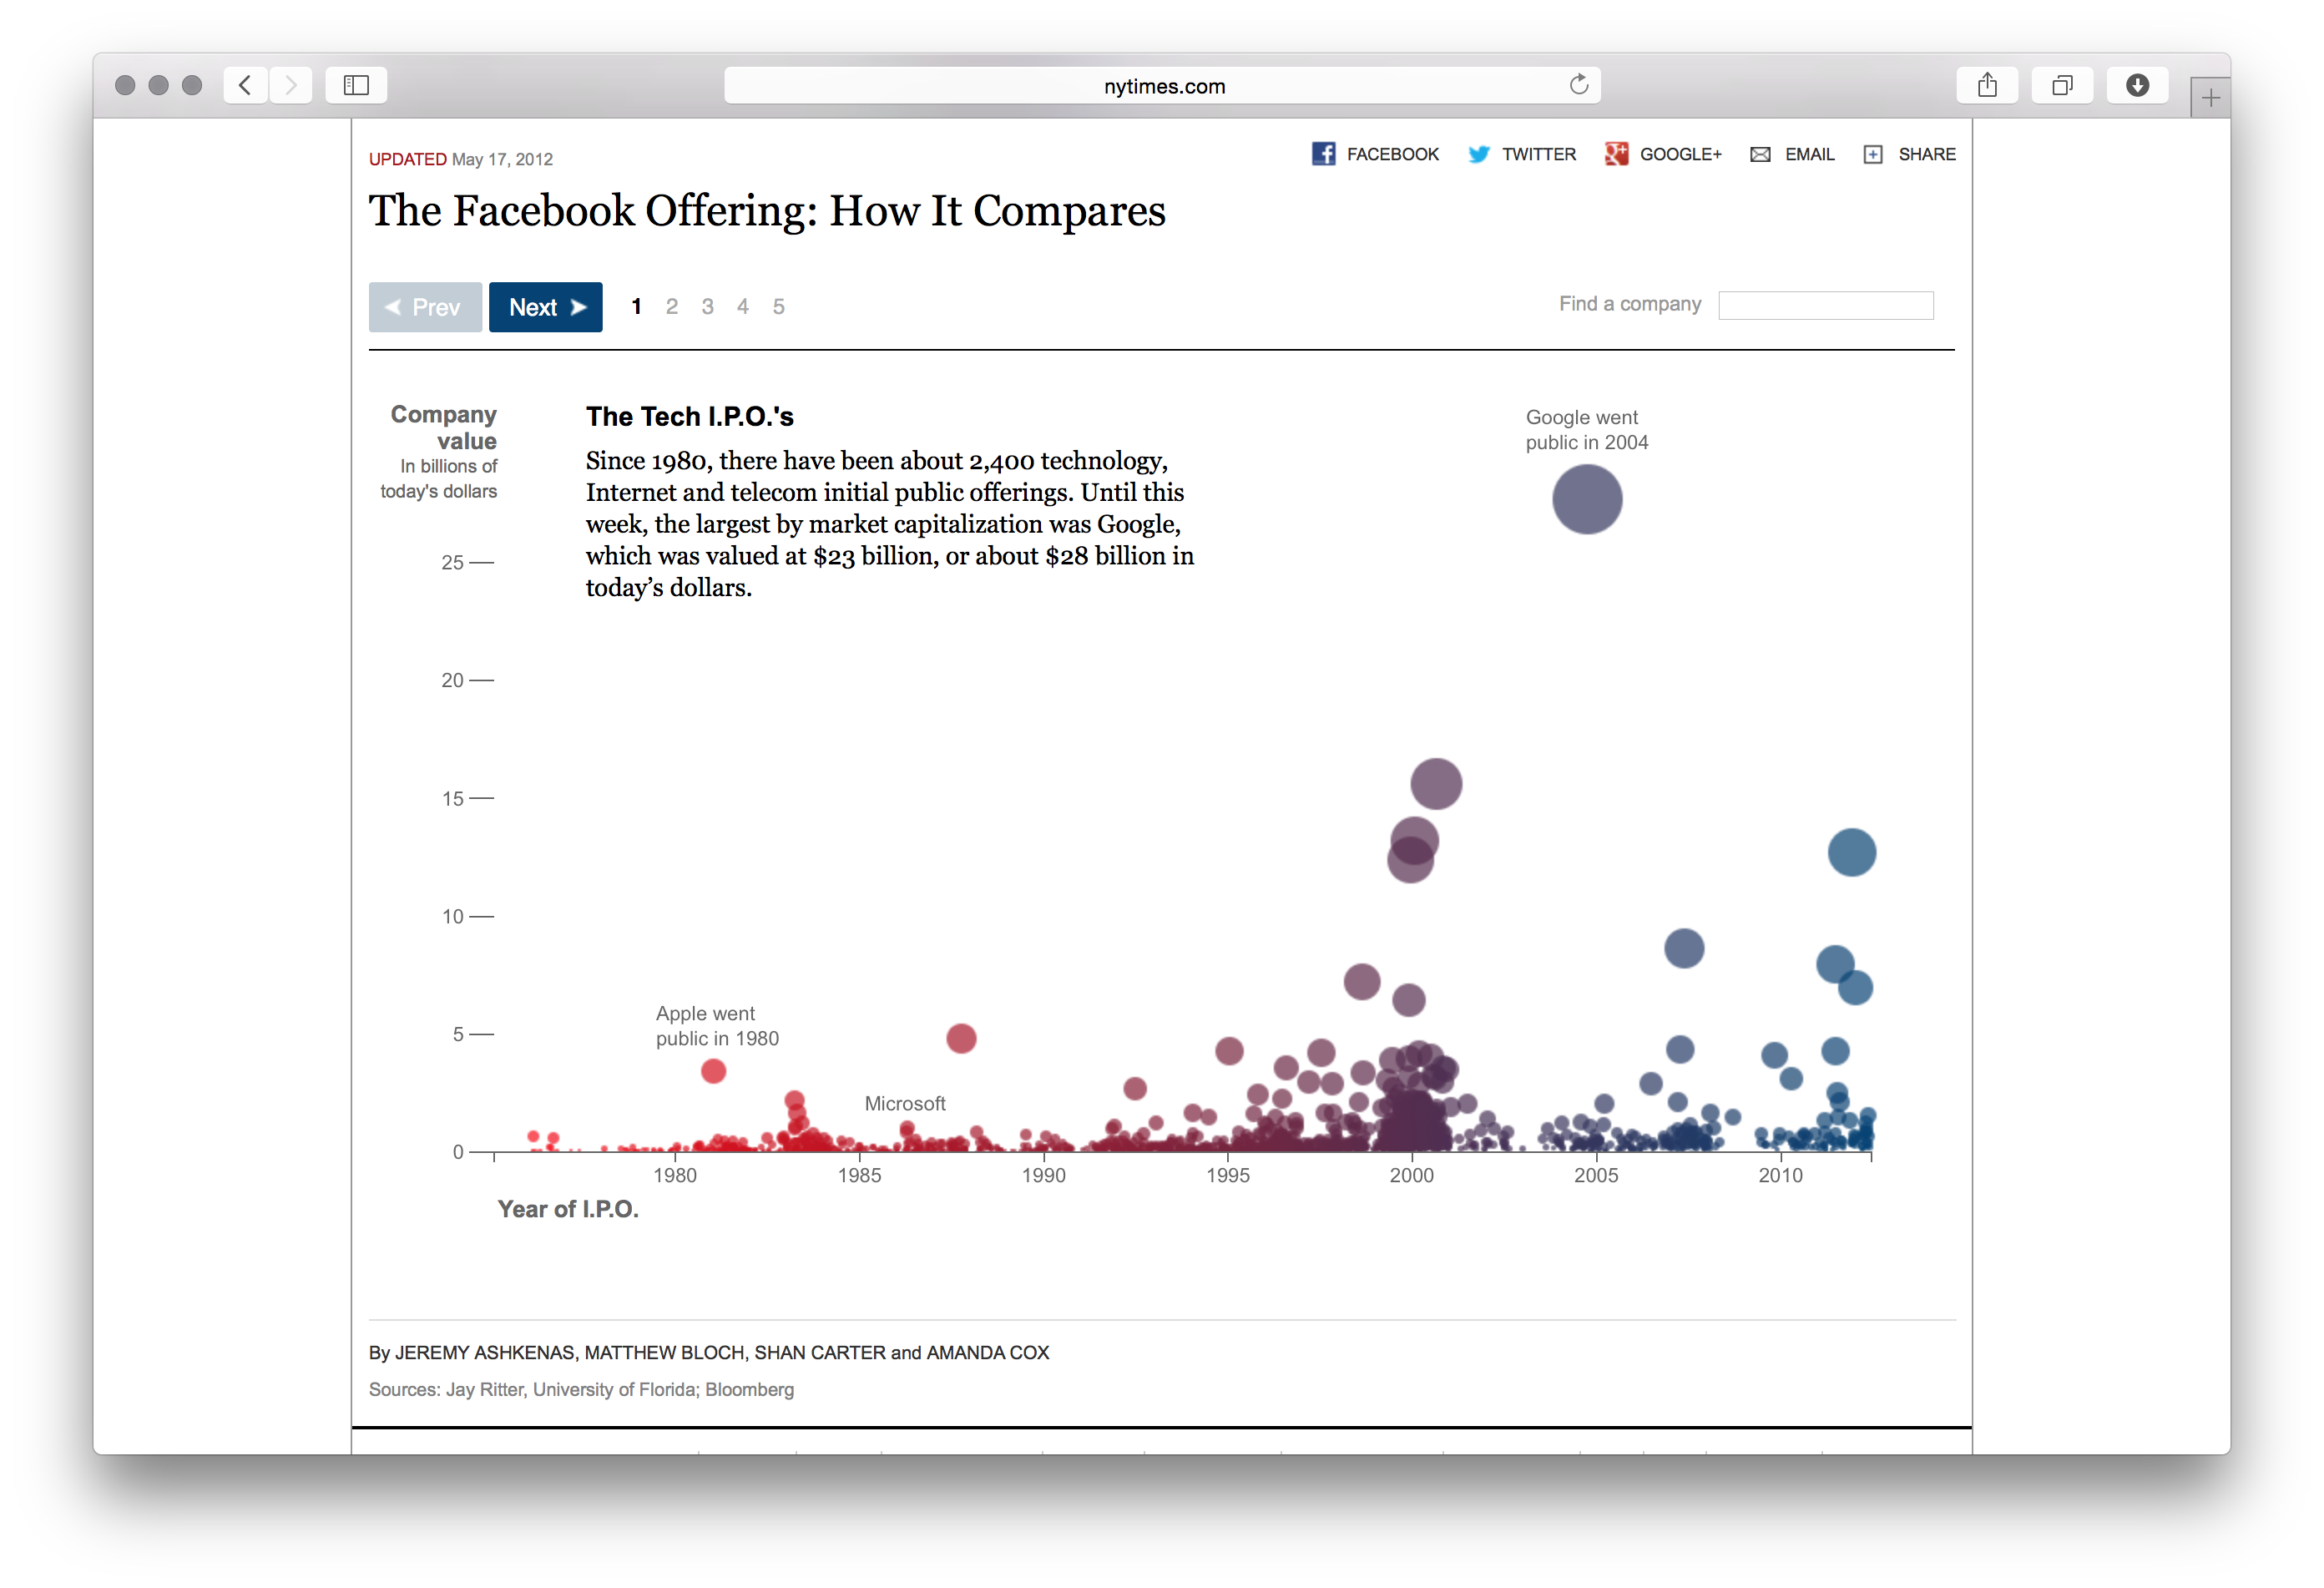
Facebook IPO
New York Times Graphics
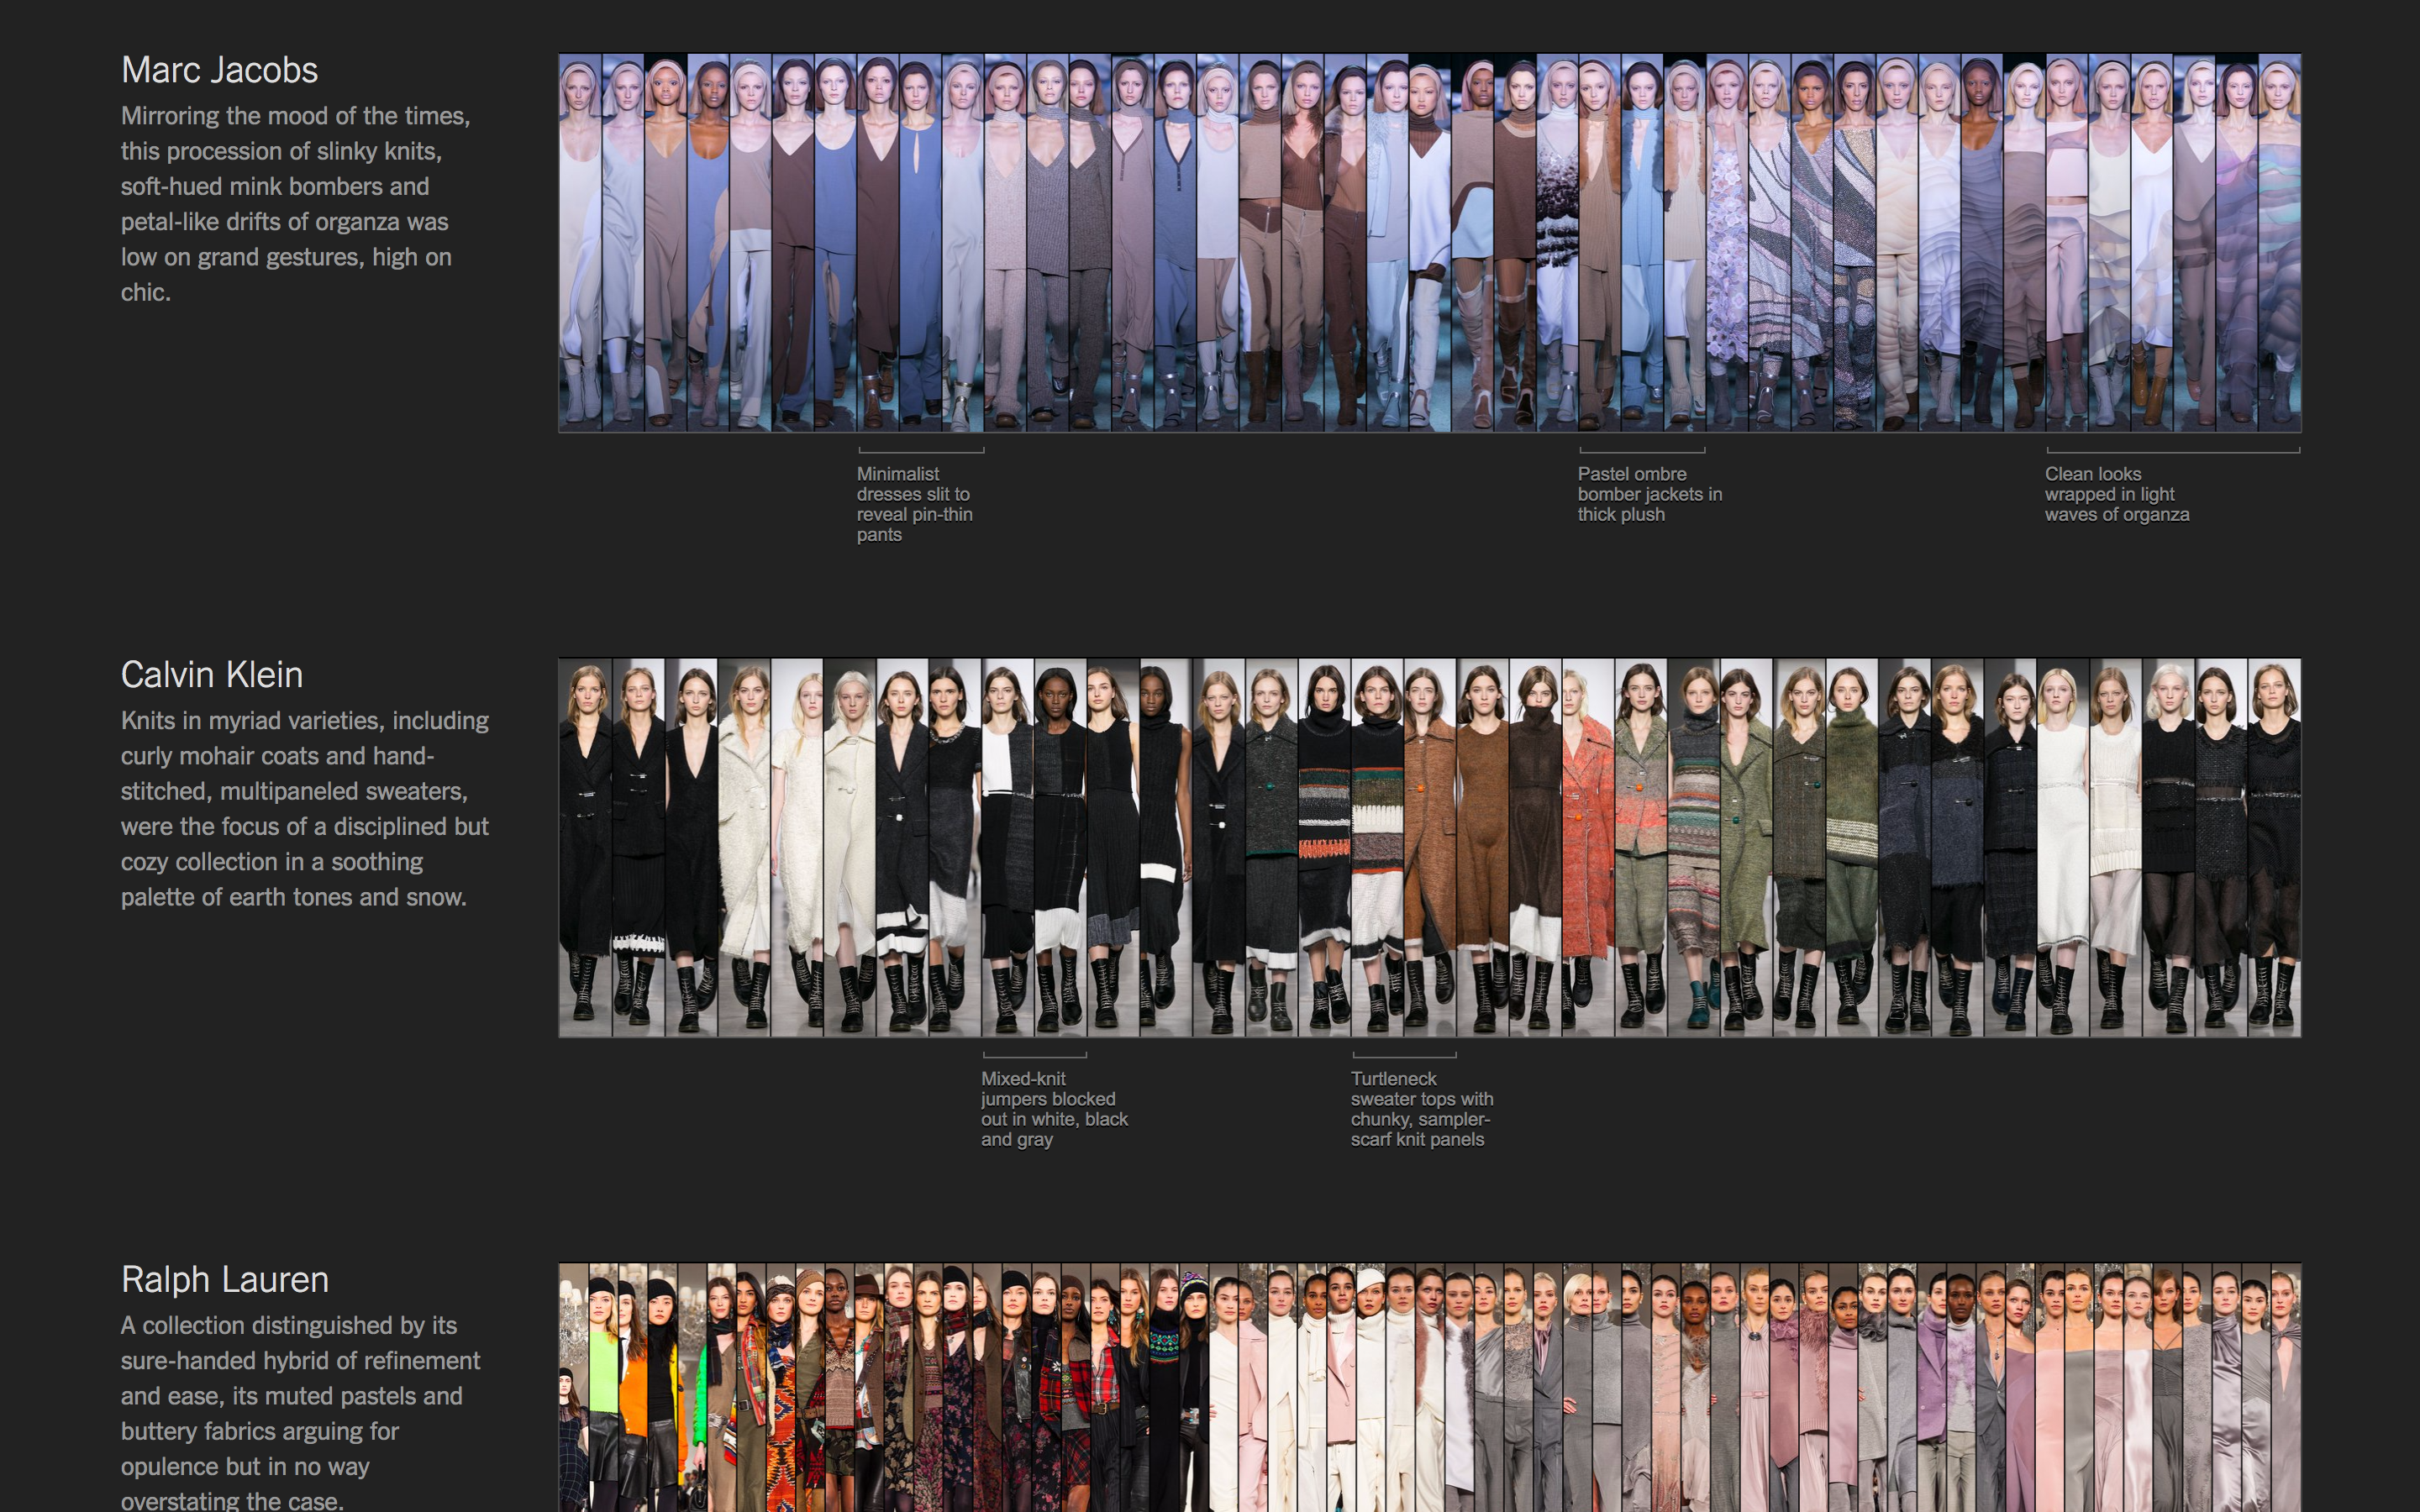
Fashion Week
New York Times Graphics
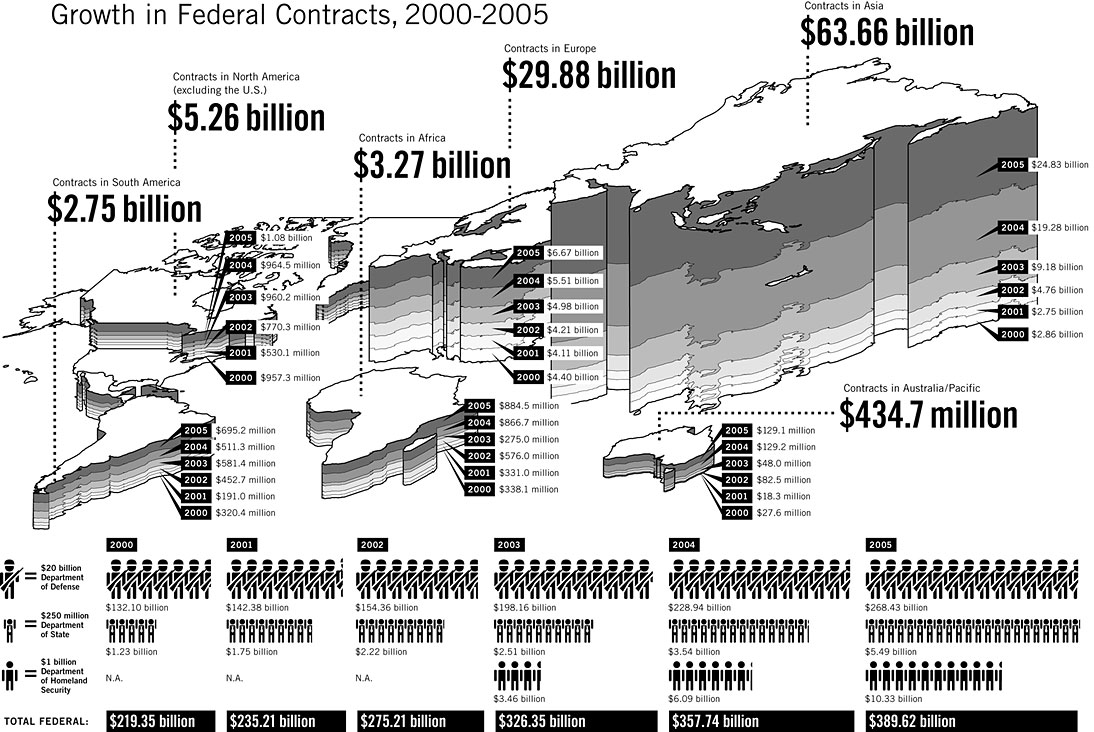
Federal Contracts Growth
Omnivore
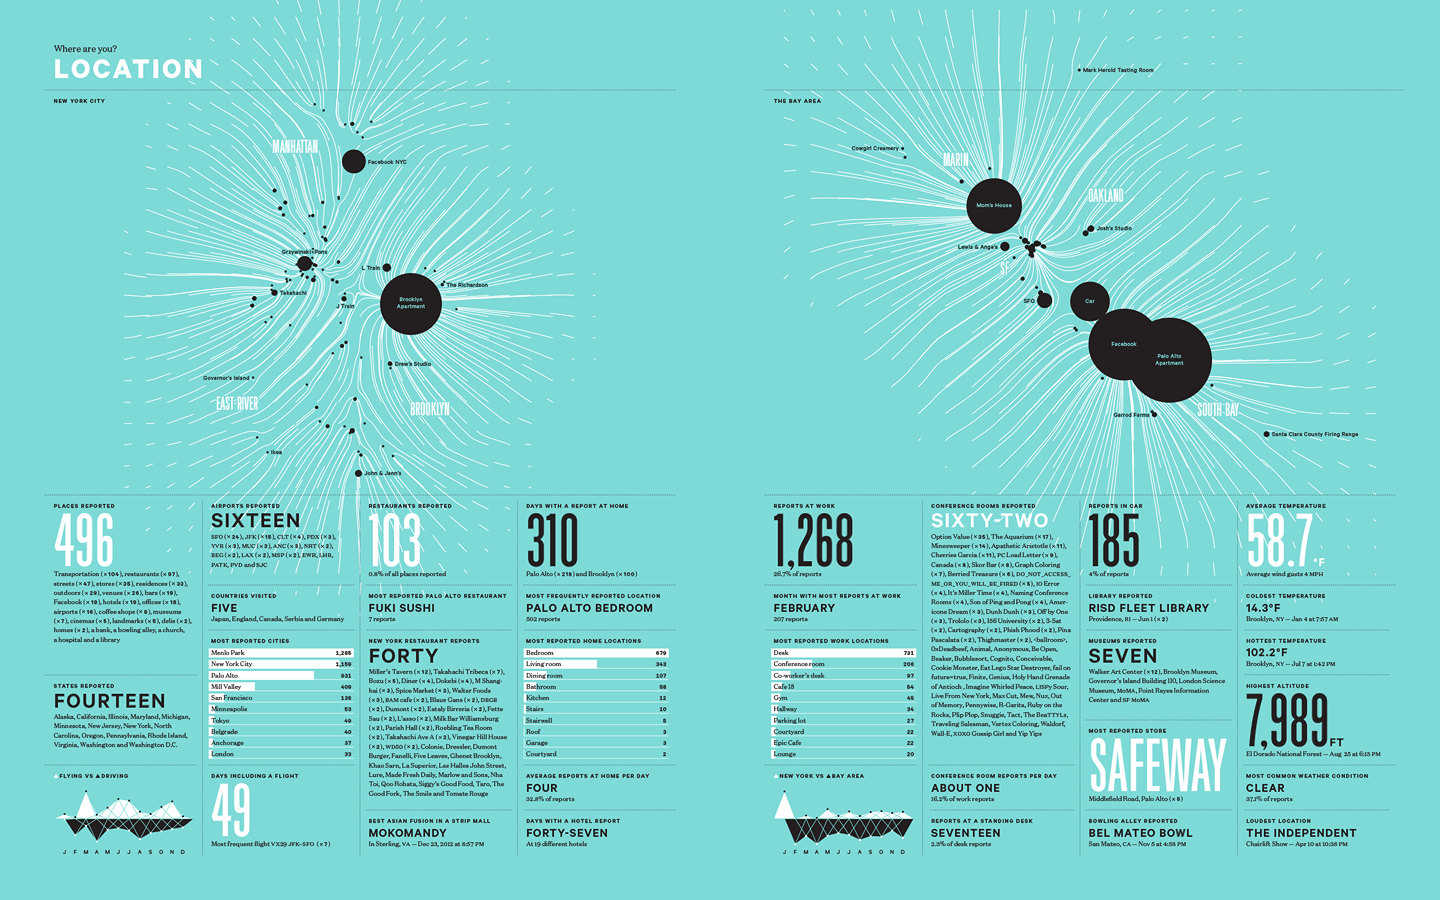
Feltron Annual Report
Nicholas Felton
Film or Digital?
Pudding
Financial Terms Ribbon Visualization

Finding Ctrl: Visions for the Future Internet
First Sankey Diagram
Matthew Henry Phineas Riall Sankey

Fitbit Dashboard Visualizations
Fitbit
FiveThirtyEight Elections
FiveThirtyEight
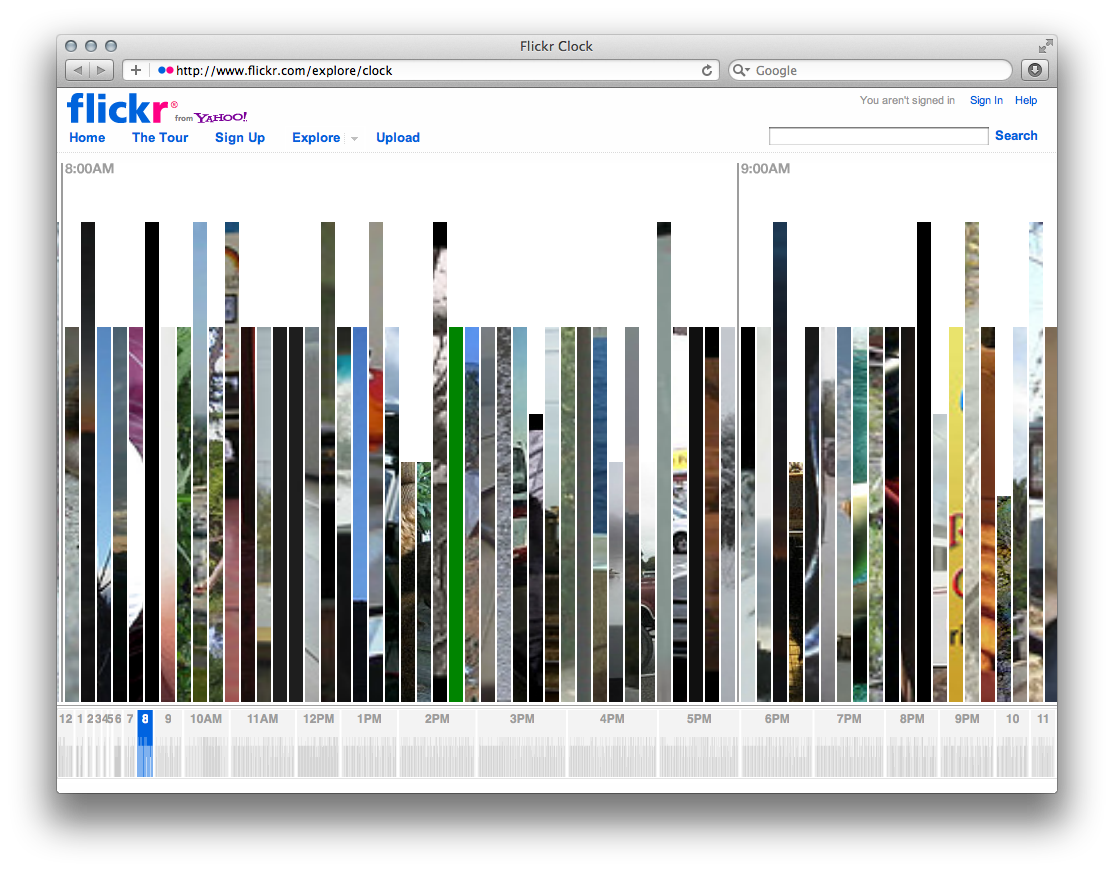
Flickr Clock
Stamen Design

Flight Patterns
Aaron Koblin
FOCUS/Forests Website
Schema Design
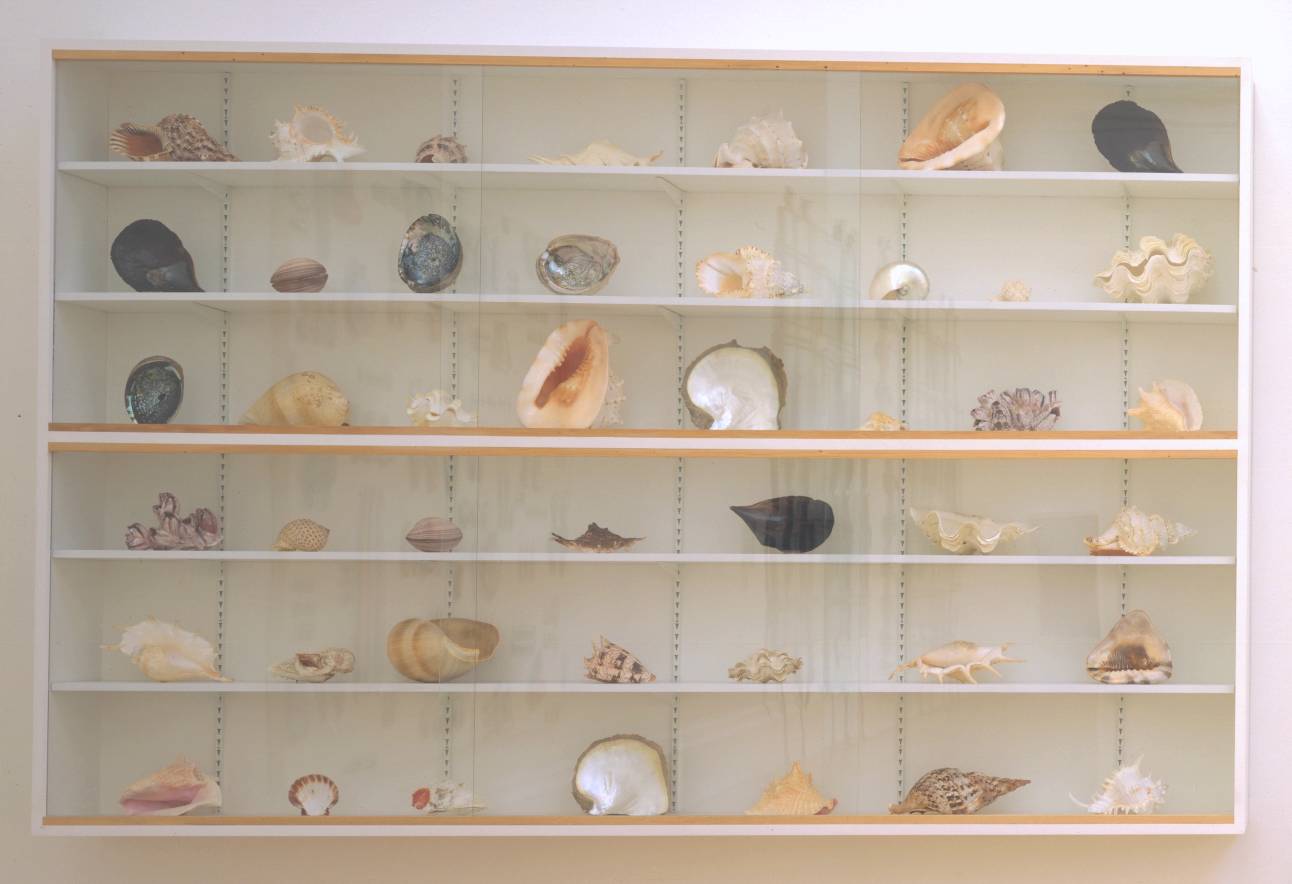
Forms Without Life
Damien Hirst
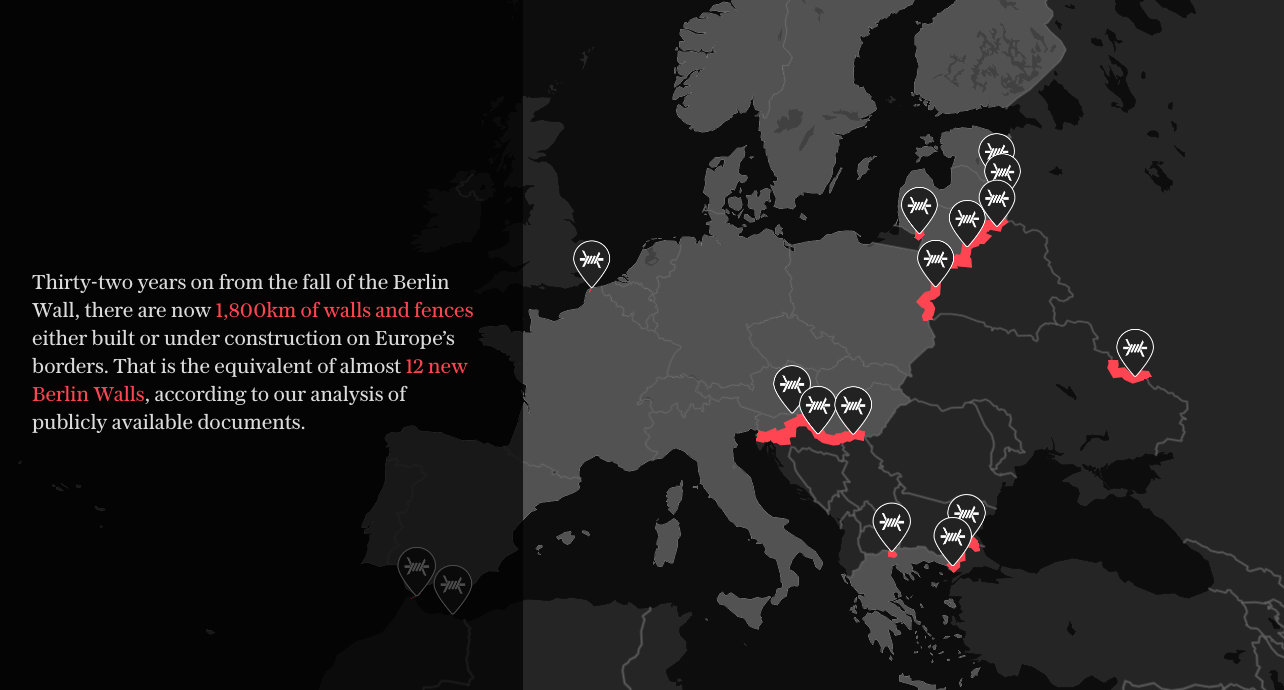
Fortress Europe
Telegraph
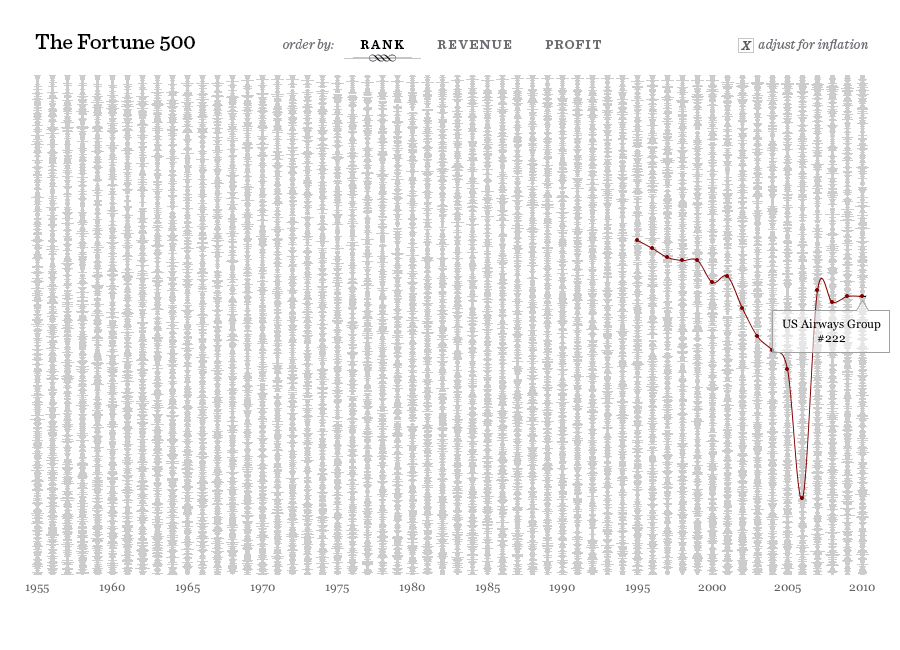
Fortune 500
Fathom Information Design

Forward Festival
Four Seasons
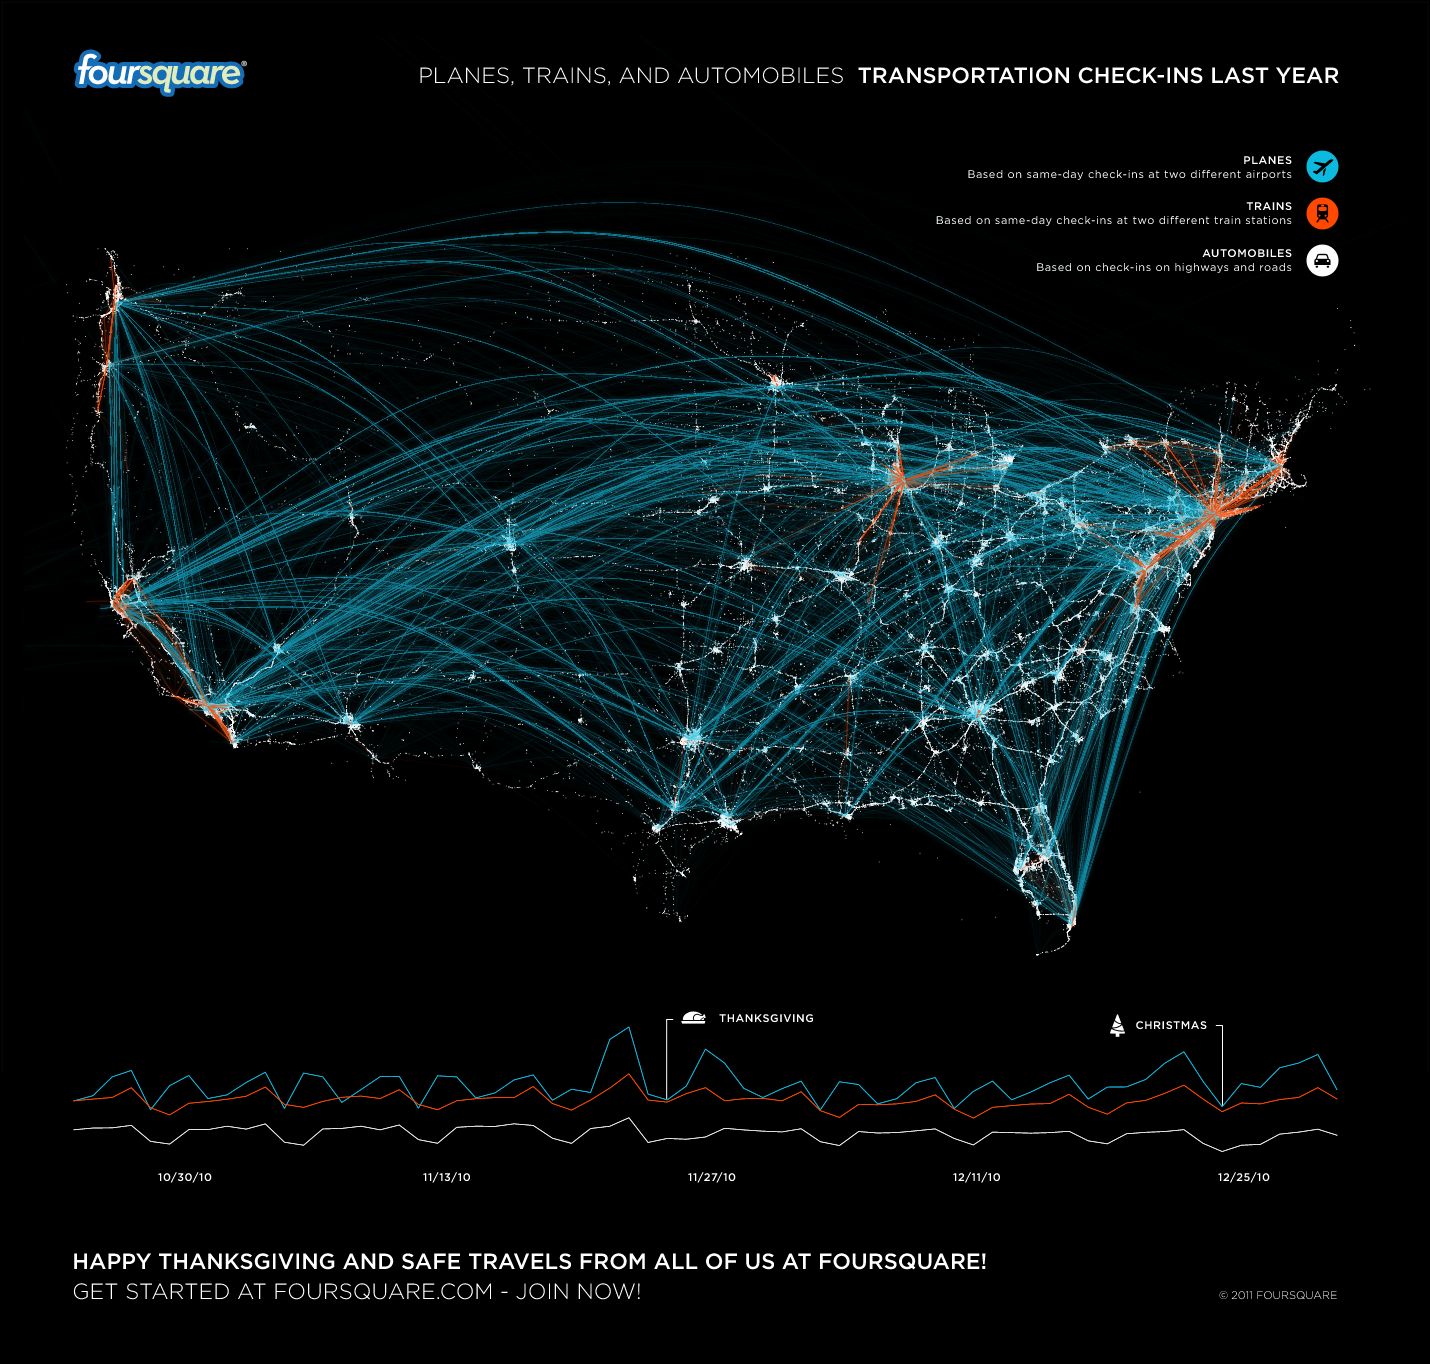
Foursquare Visualizations
Foursquare
Friedman Untitled
Tom Friedman
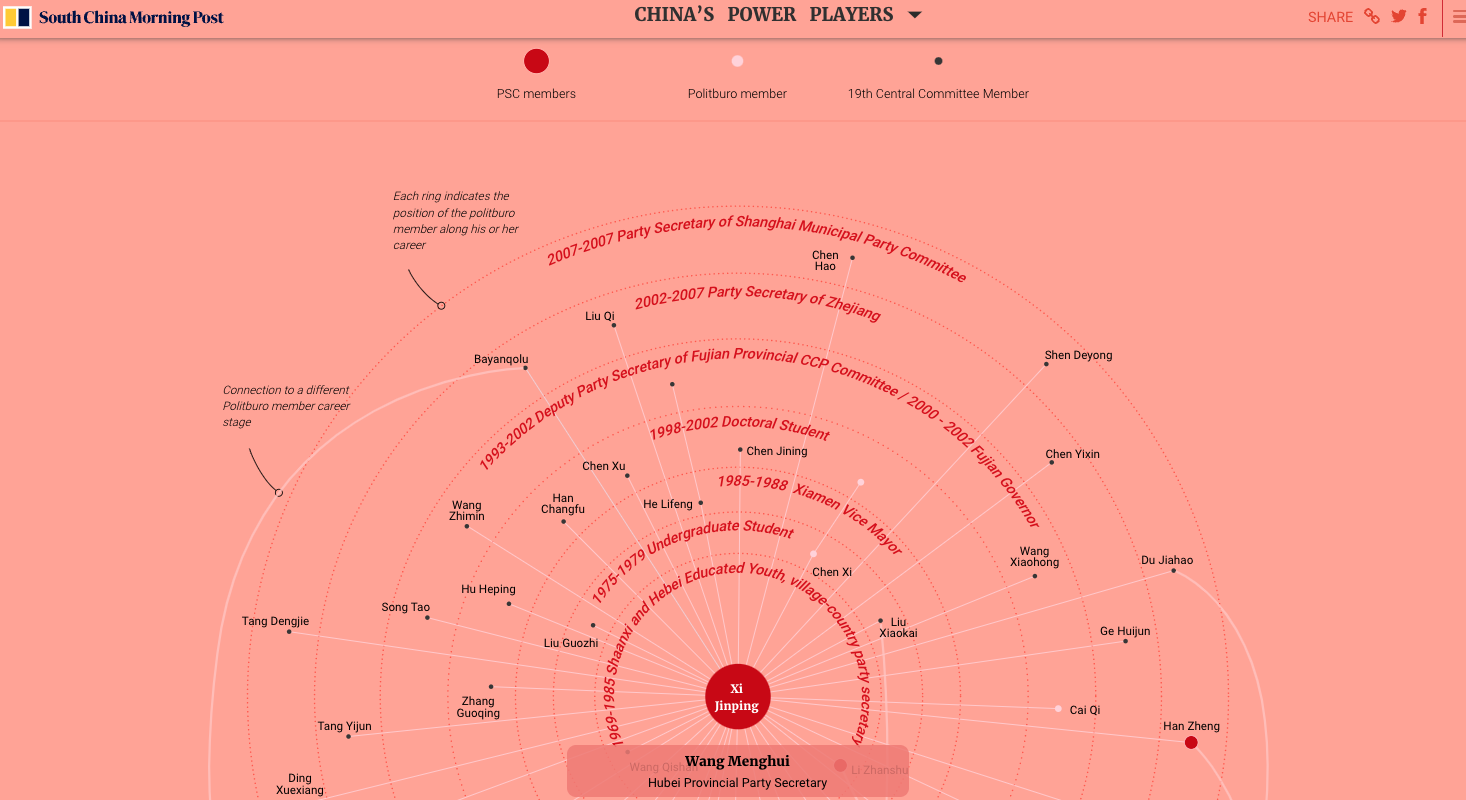
Friends in High Places
South China Morning Post
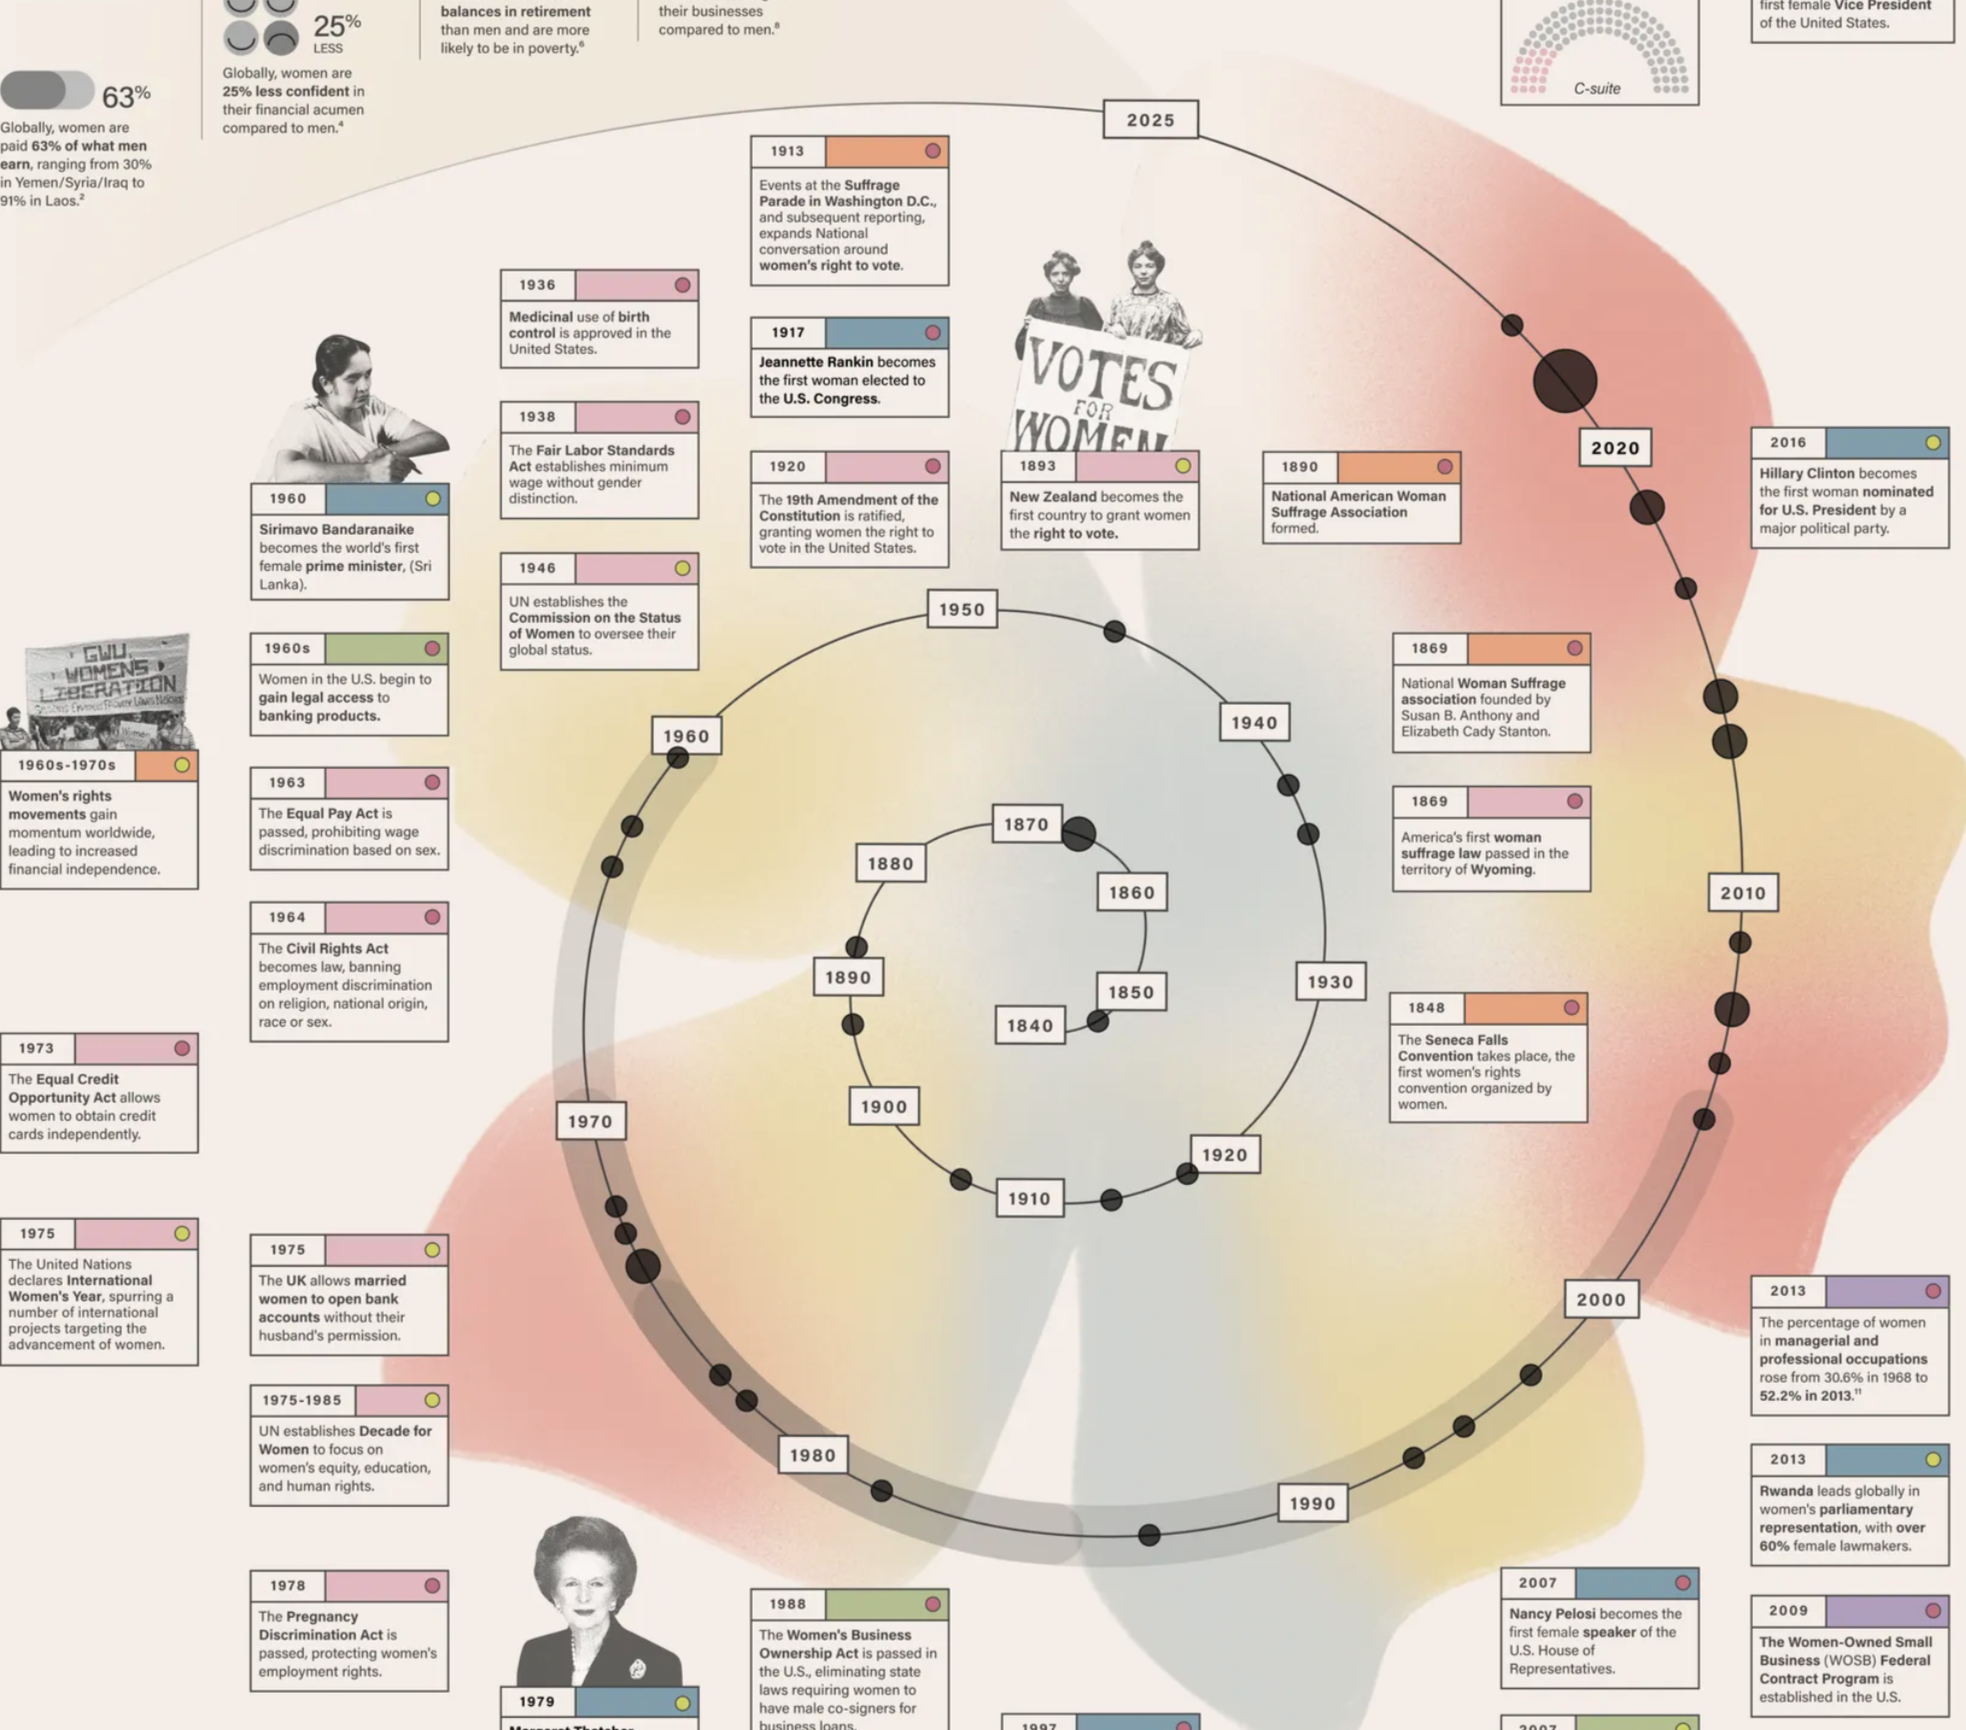
From Women's Suffrage to Financial Freedom
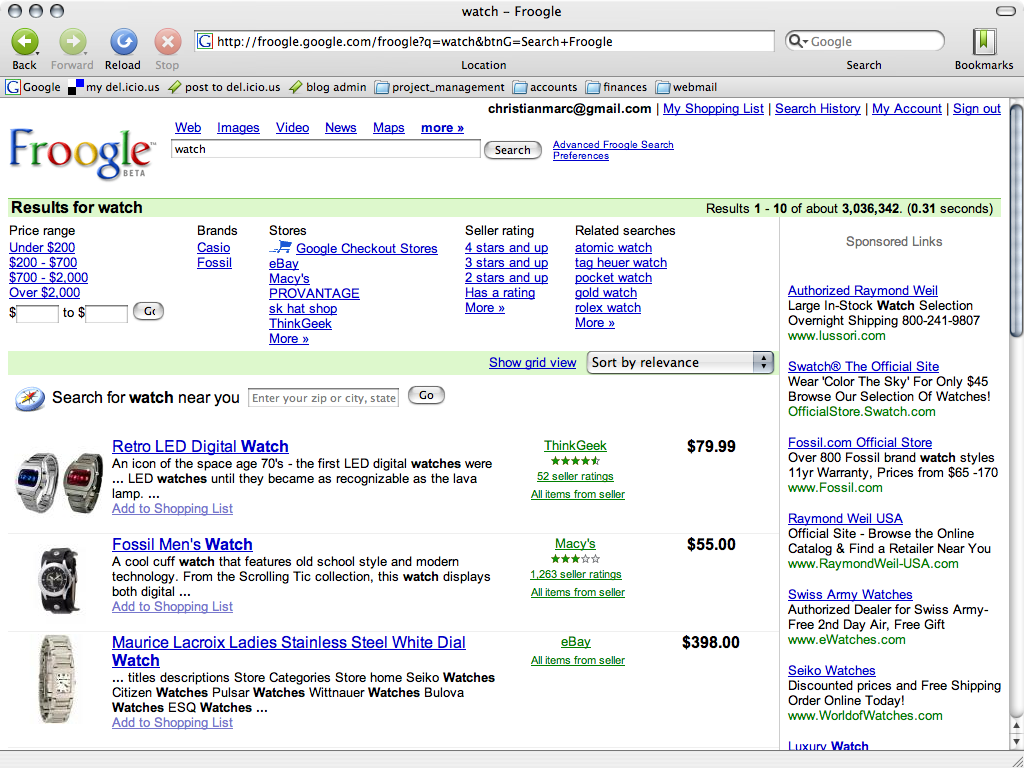
Froogle Visualization

Future Investment Initiative Media Installation

Future Times
Chris O'Leary & Casey Alt
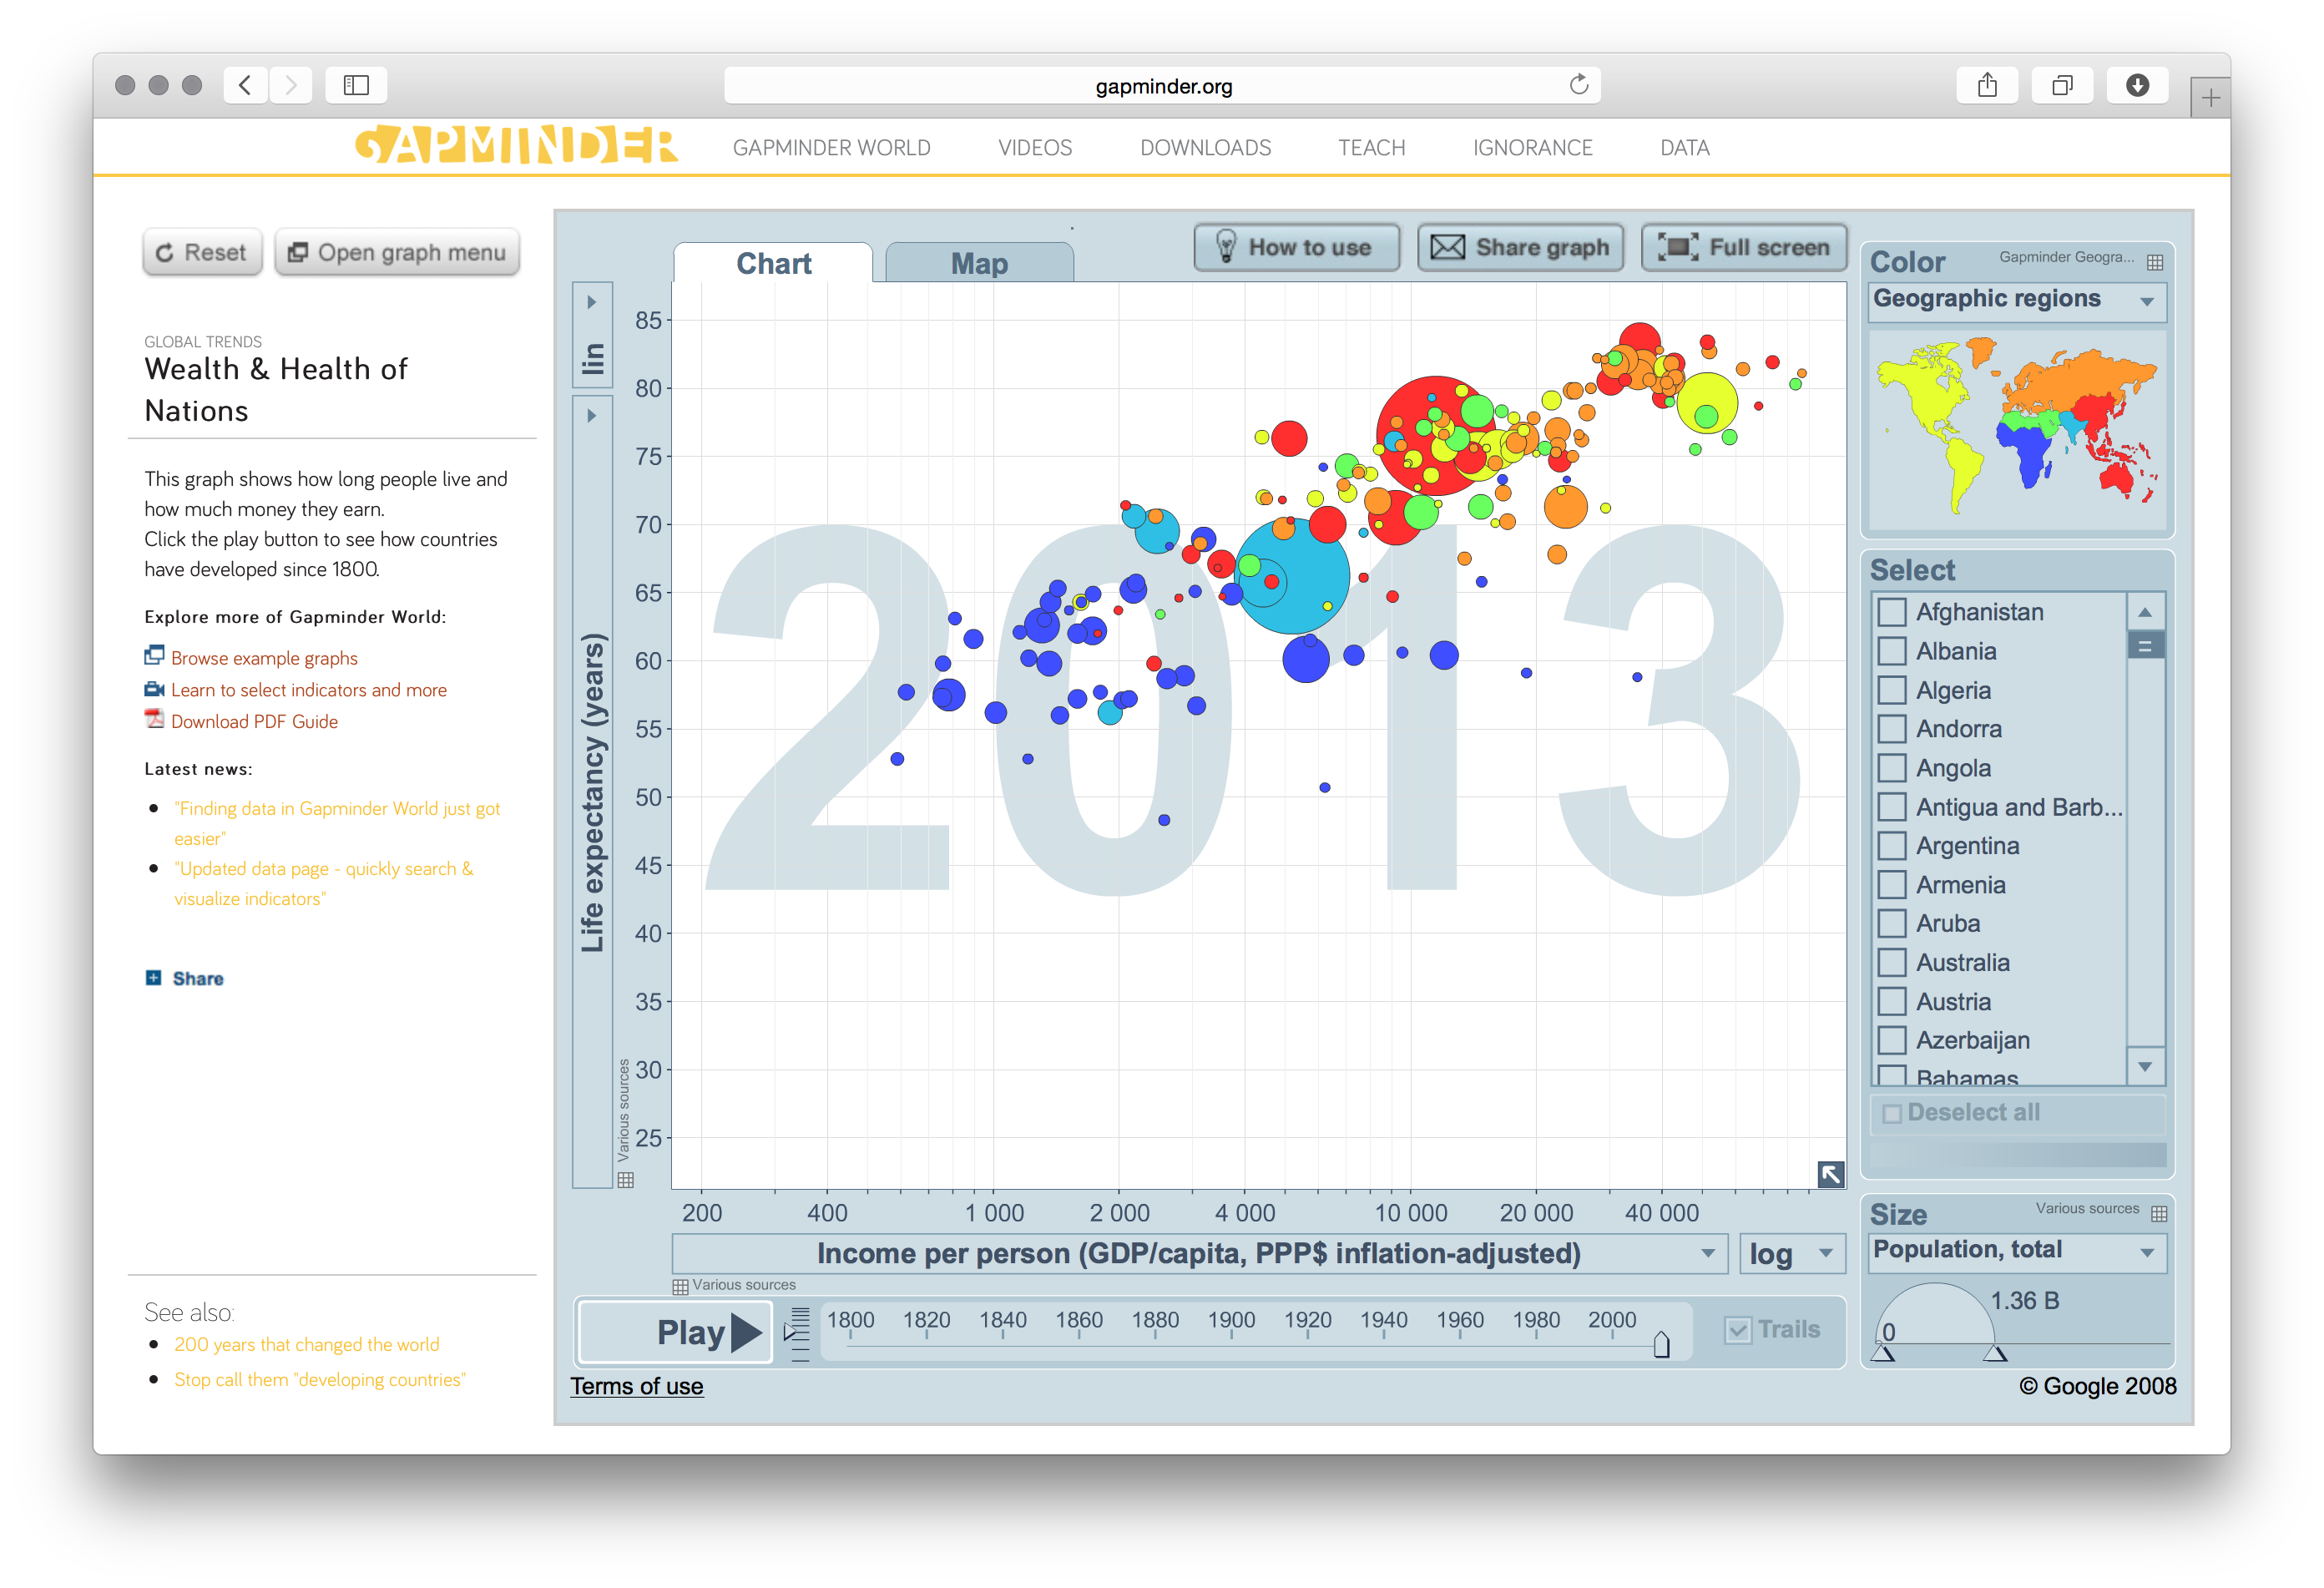
Gapminder
Hans Rosling / Gapminder
Garage Museum Landing Page
Garage Museum
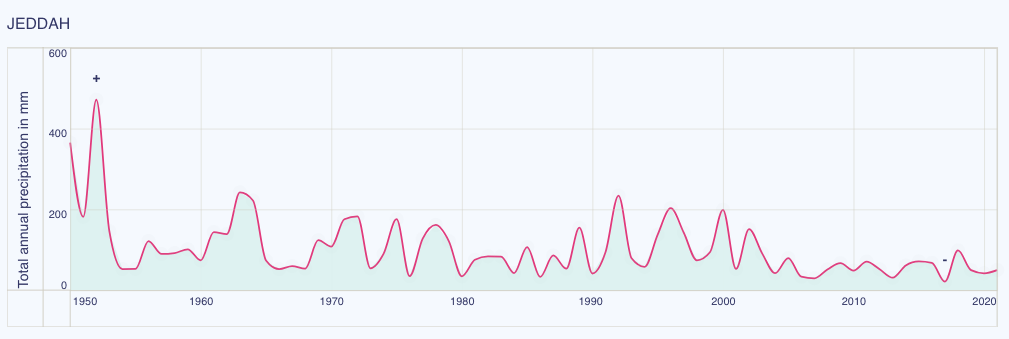
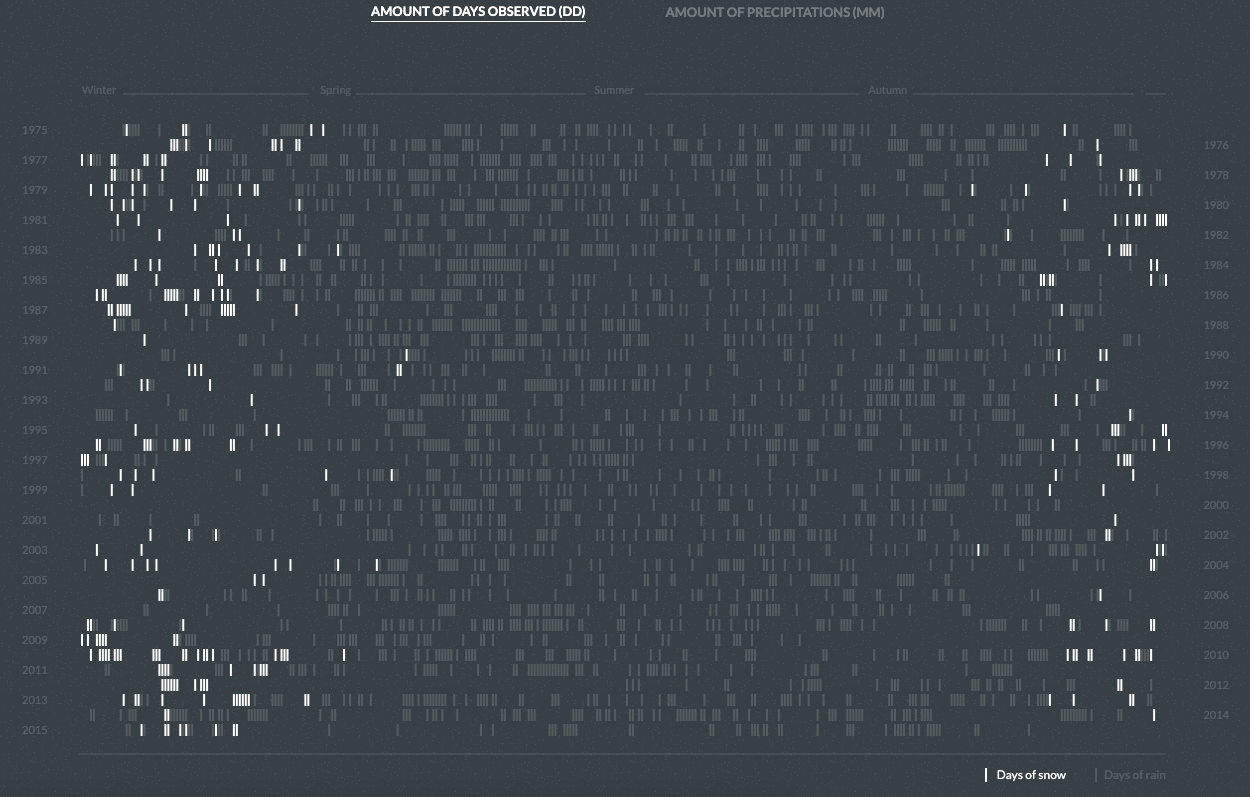
GCC's Changing Climate: a Quantified History of the Last 4 Decades
Kontinentalist
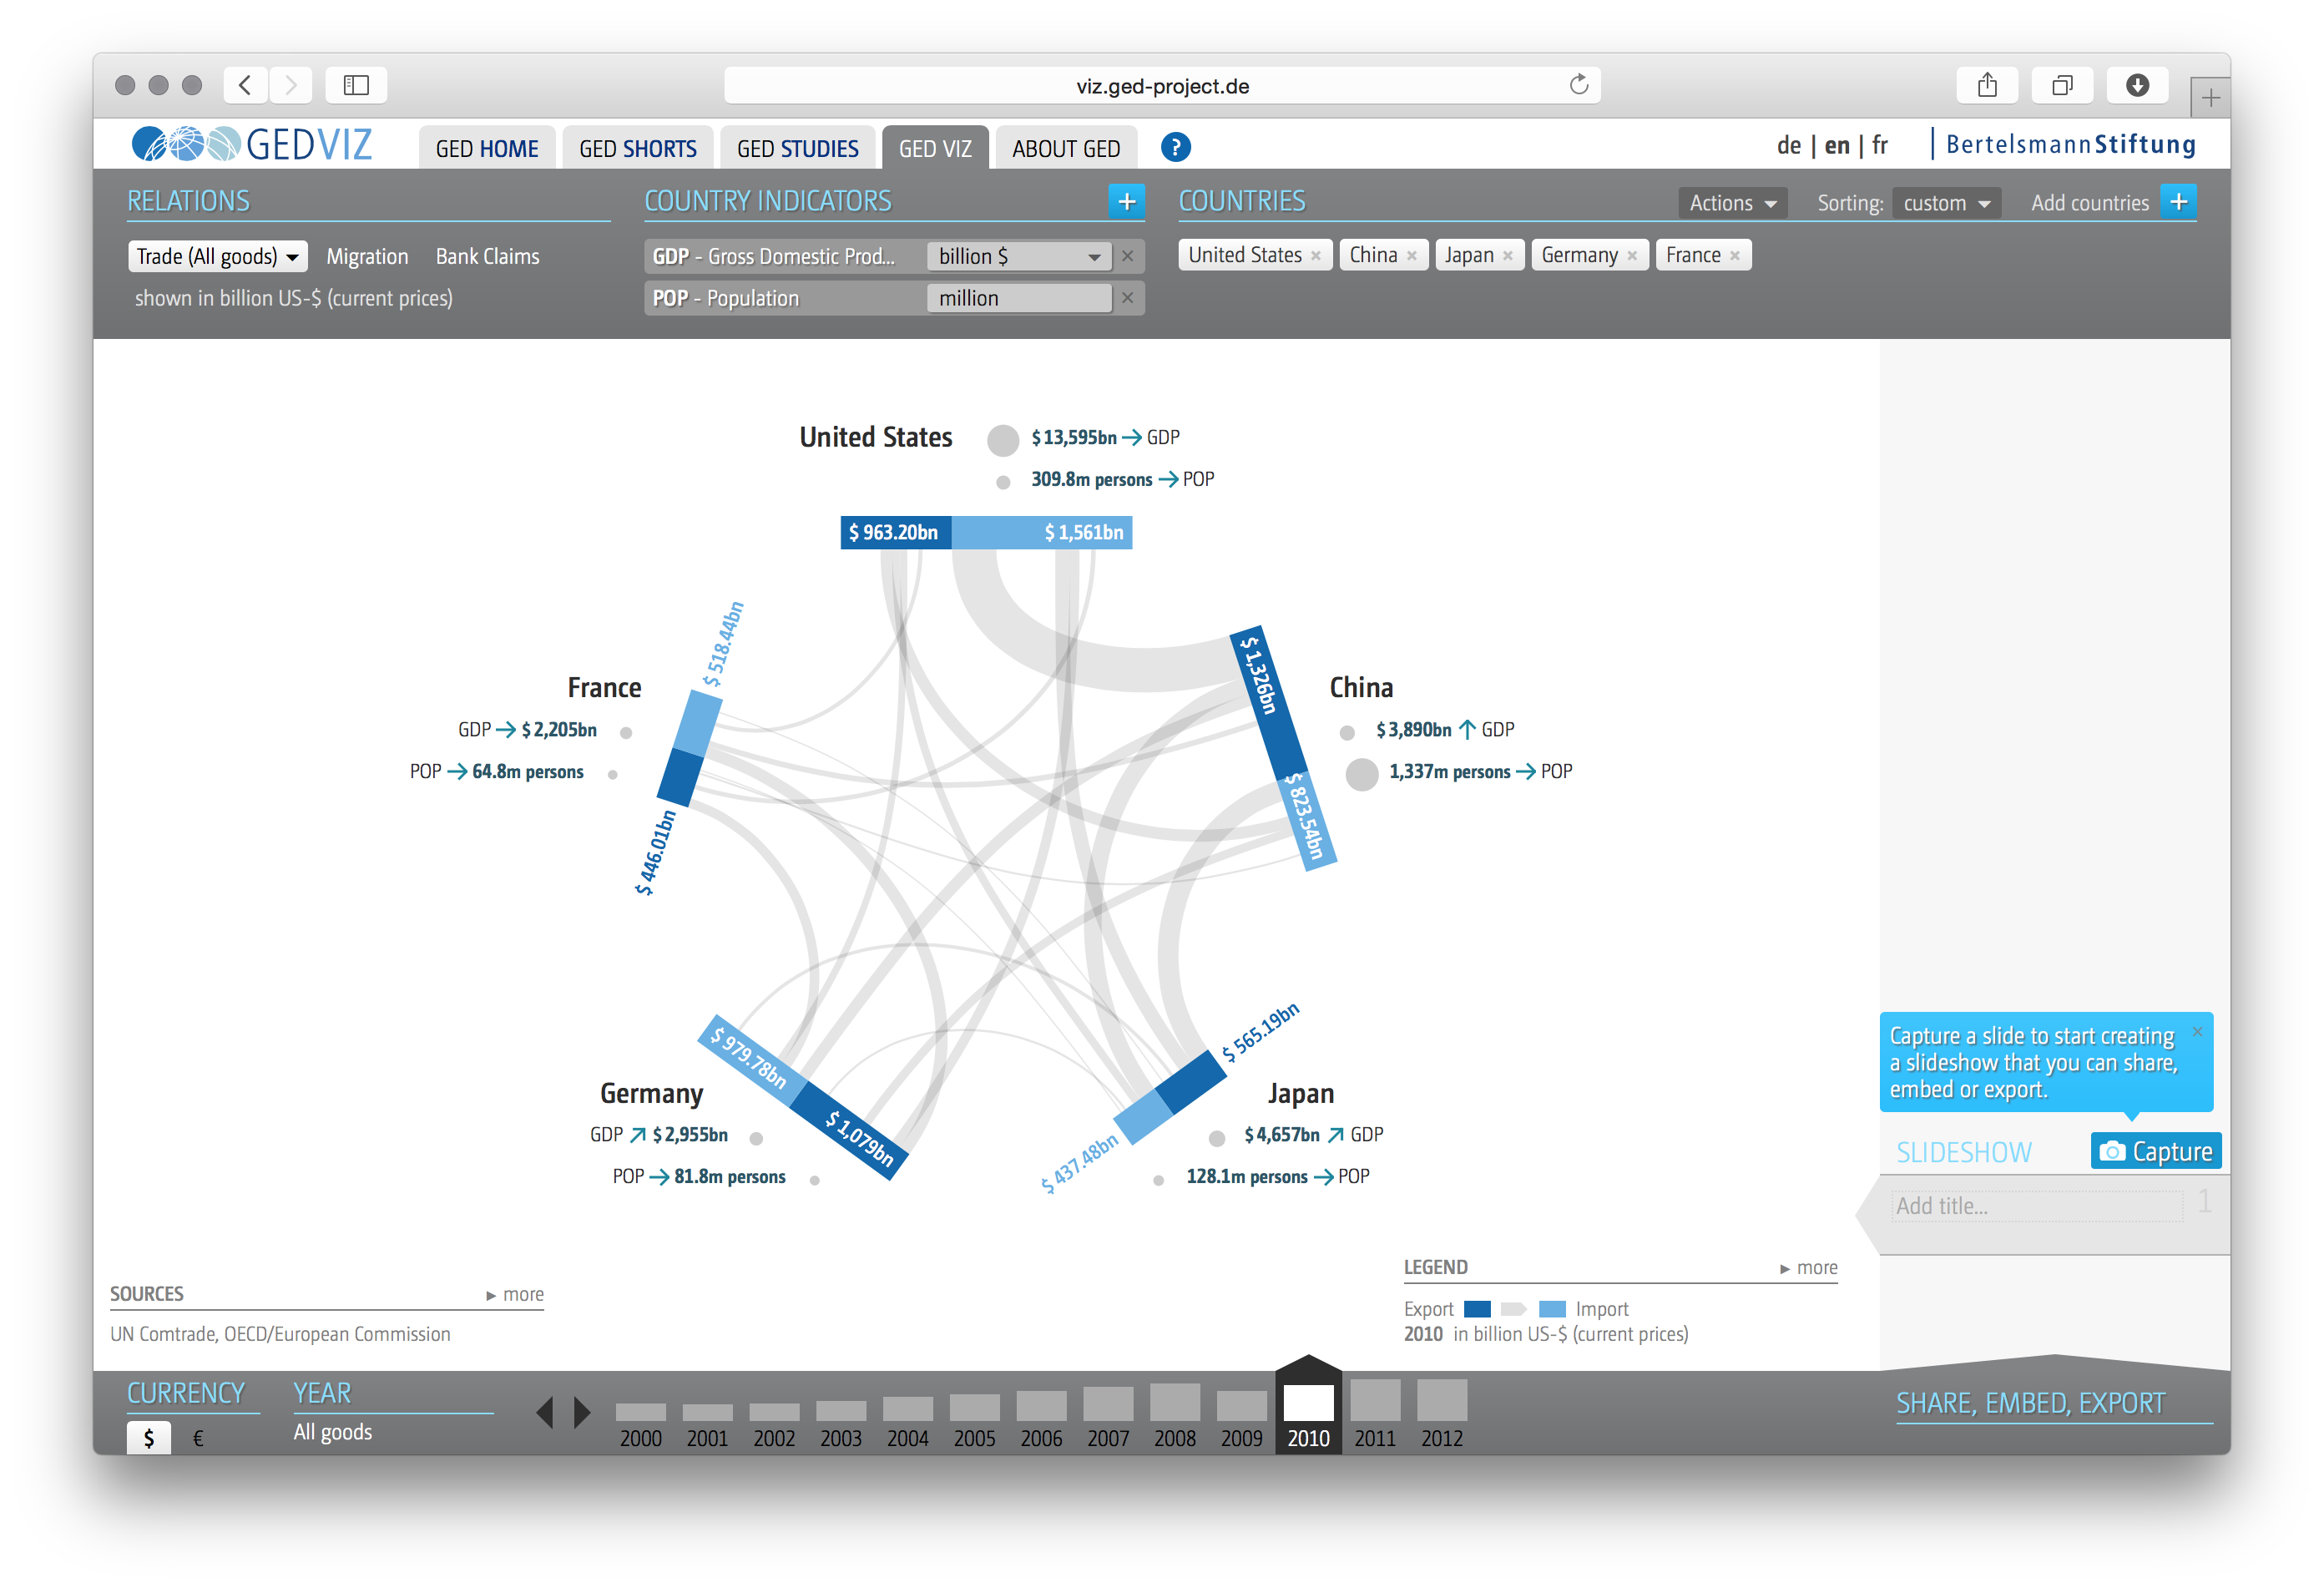
GED VIZ
Bertelsmann Foundation
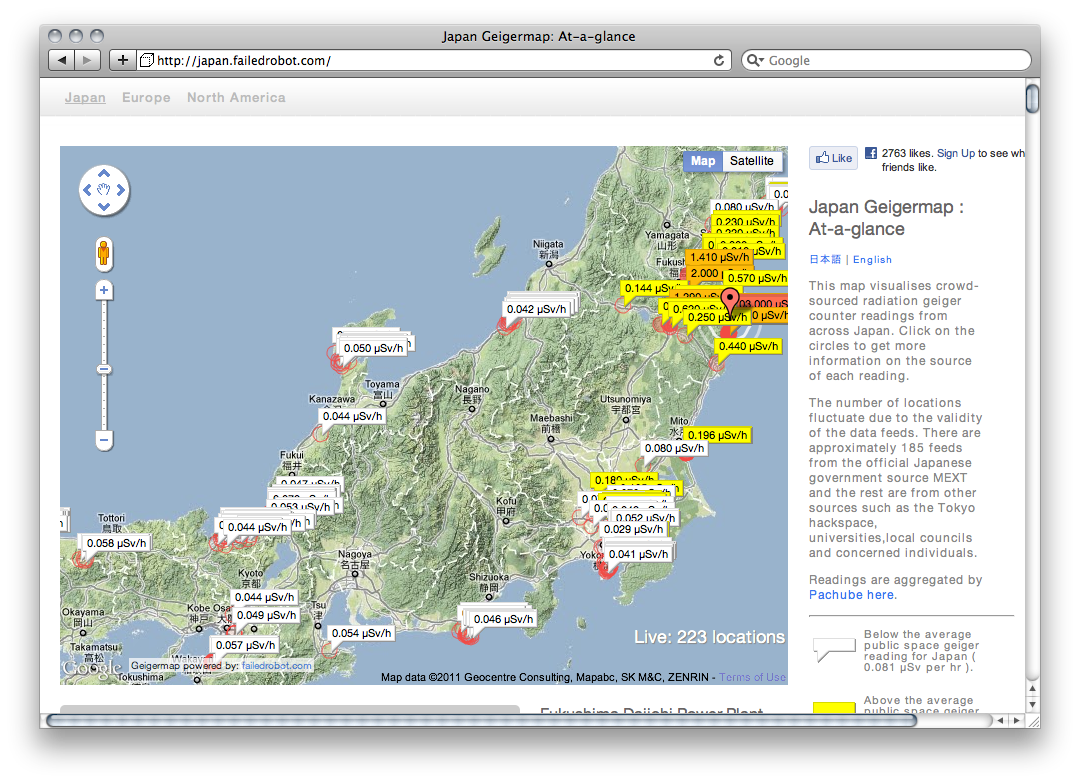
Geiger Map
Haiyan Zhang
Gen Con: Website, Print, and Branding Guide
Schema Design
Generative AI
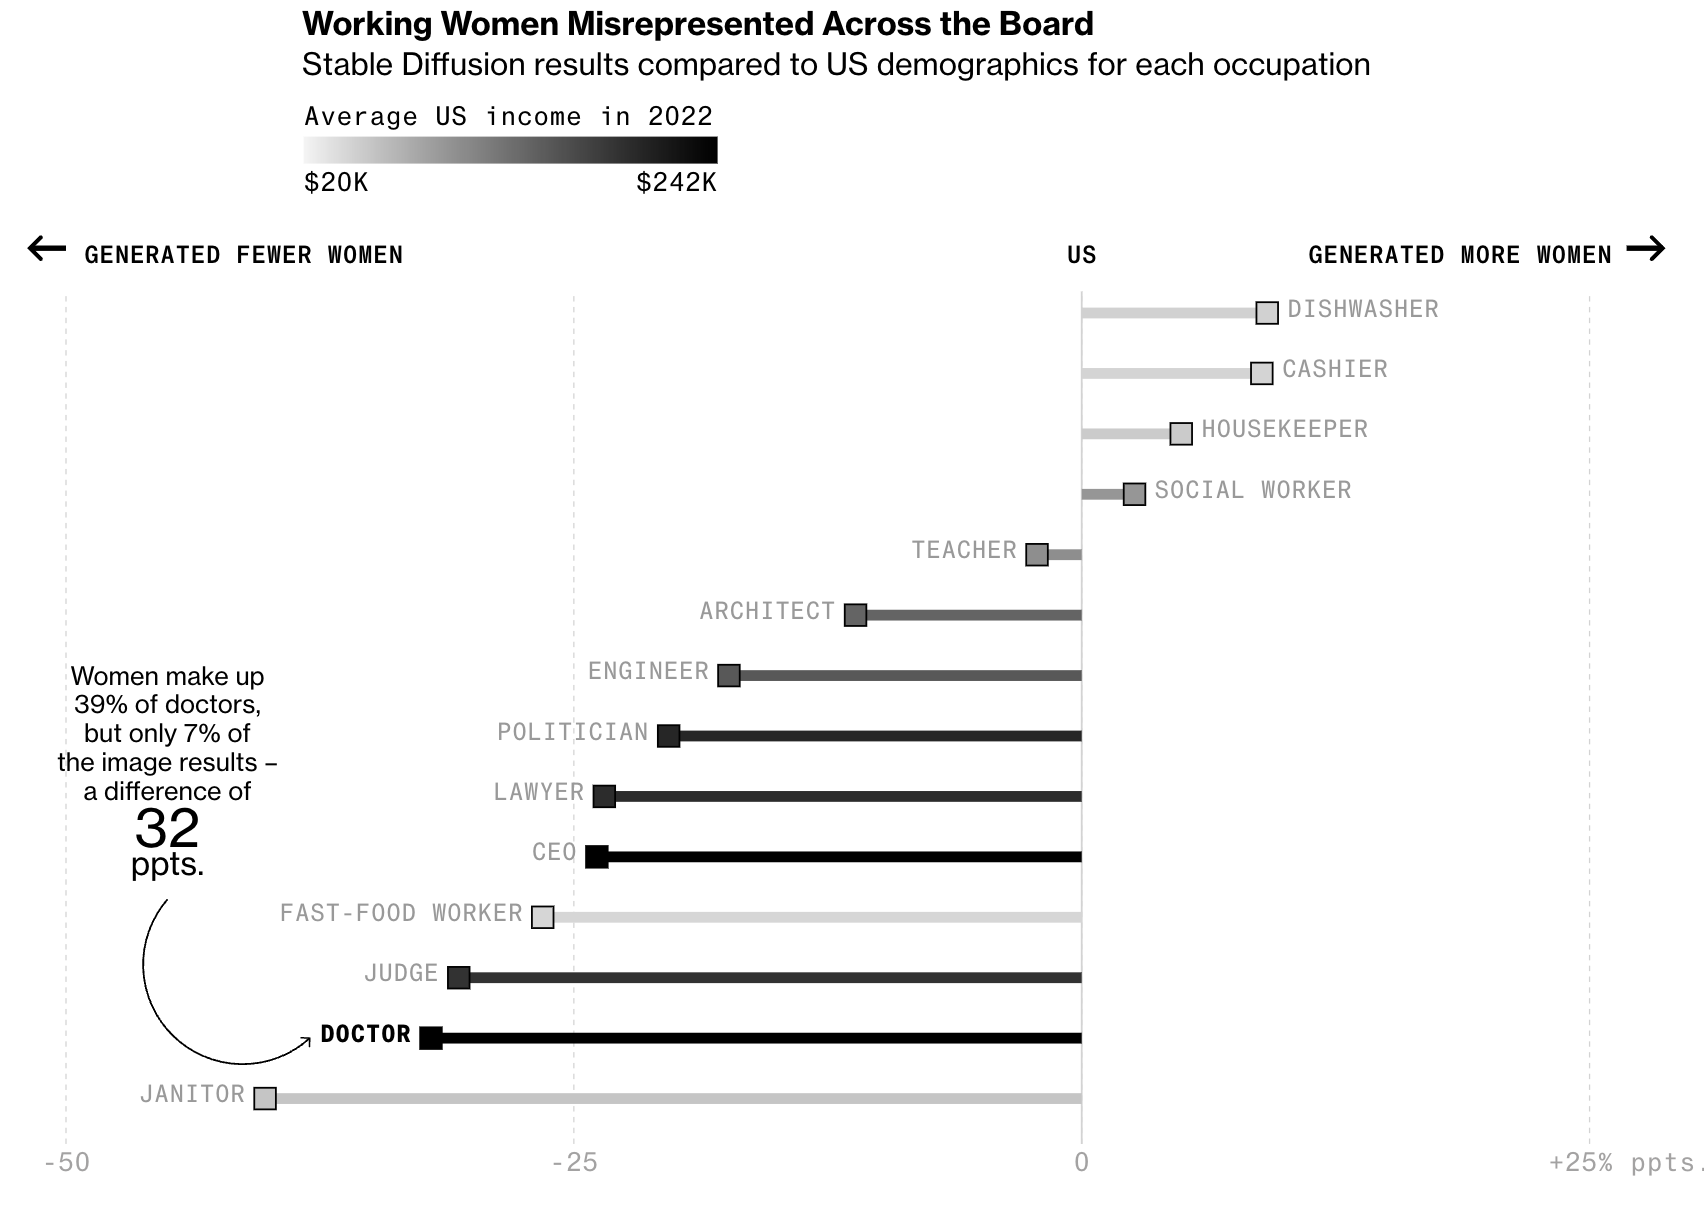
Generative AI Bias
Bloomberg
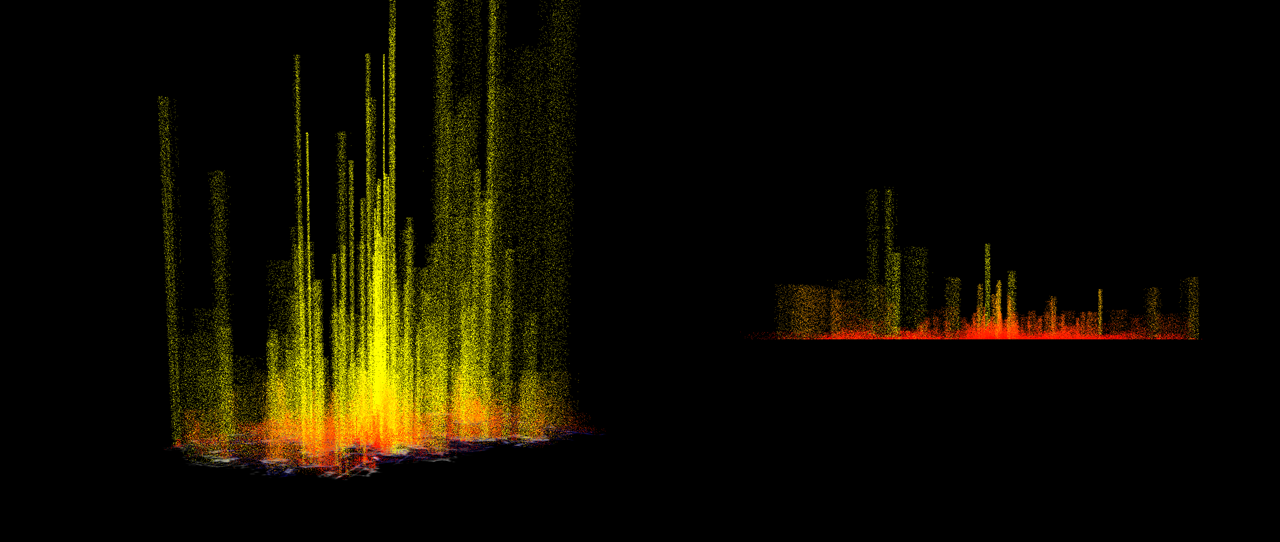
Geotaggers' World Atlas
Eric Fischer
Get Lost Francis Alys
Francis Alÿs
Get Lost Julie Mehretu
Julie Mehretu
Getty Museum Collection Site
Getty
Github Commit History
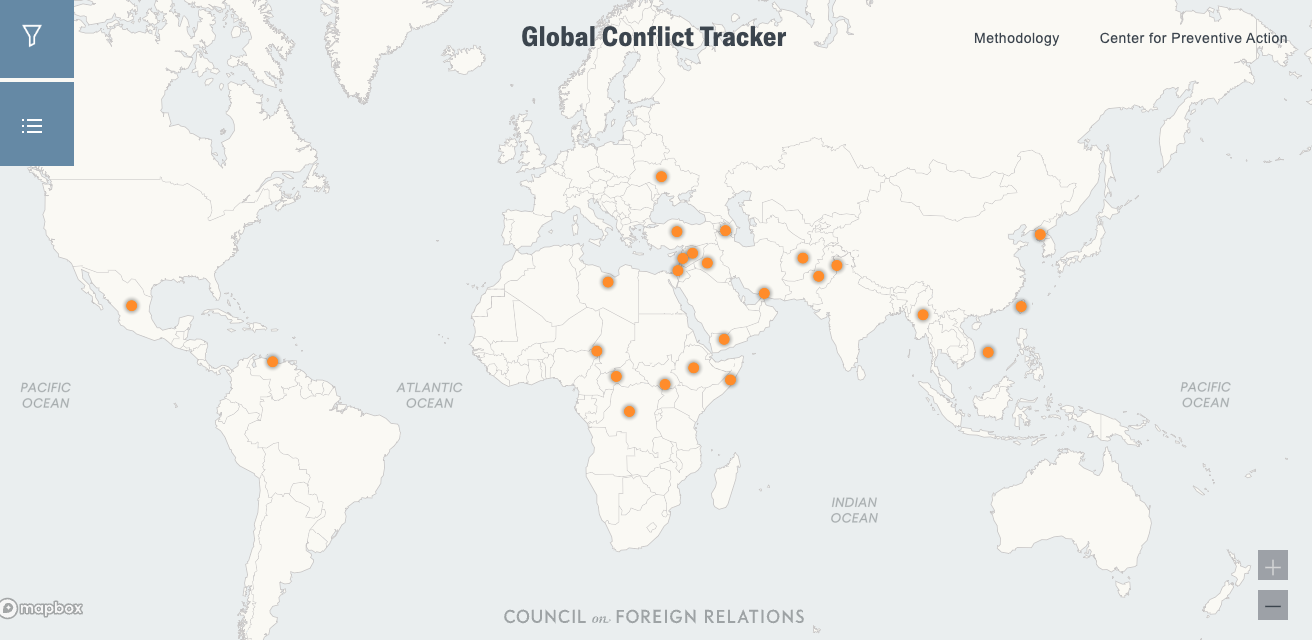
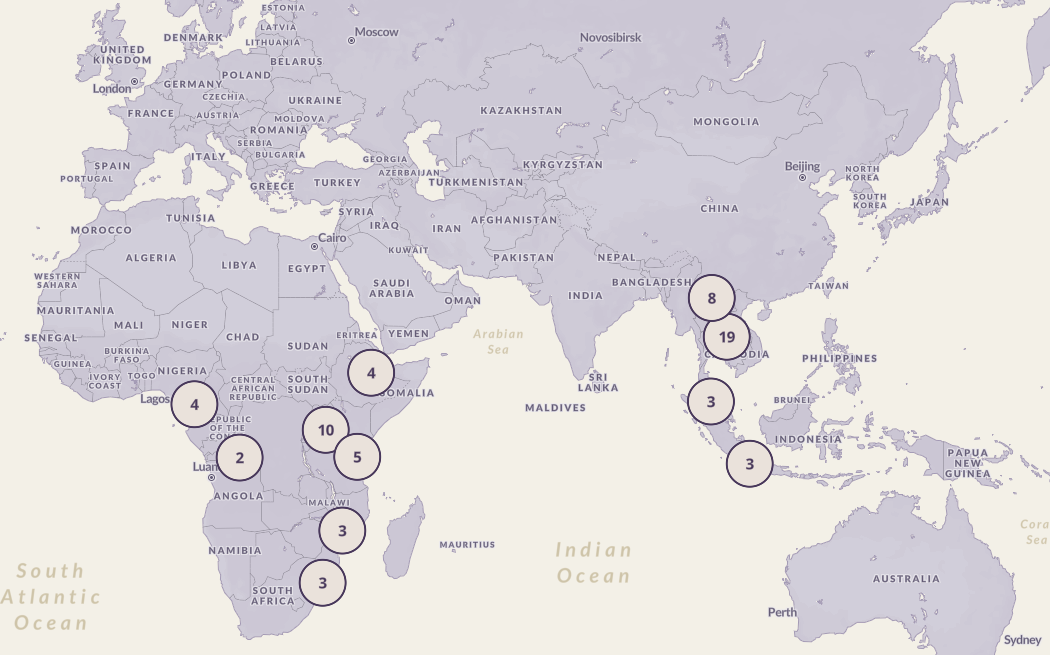
Global Conflict Tracker
Council on Foreign Relations
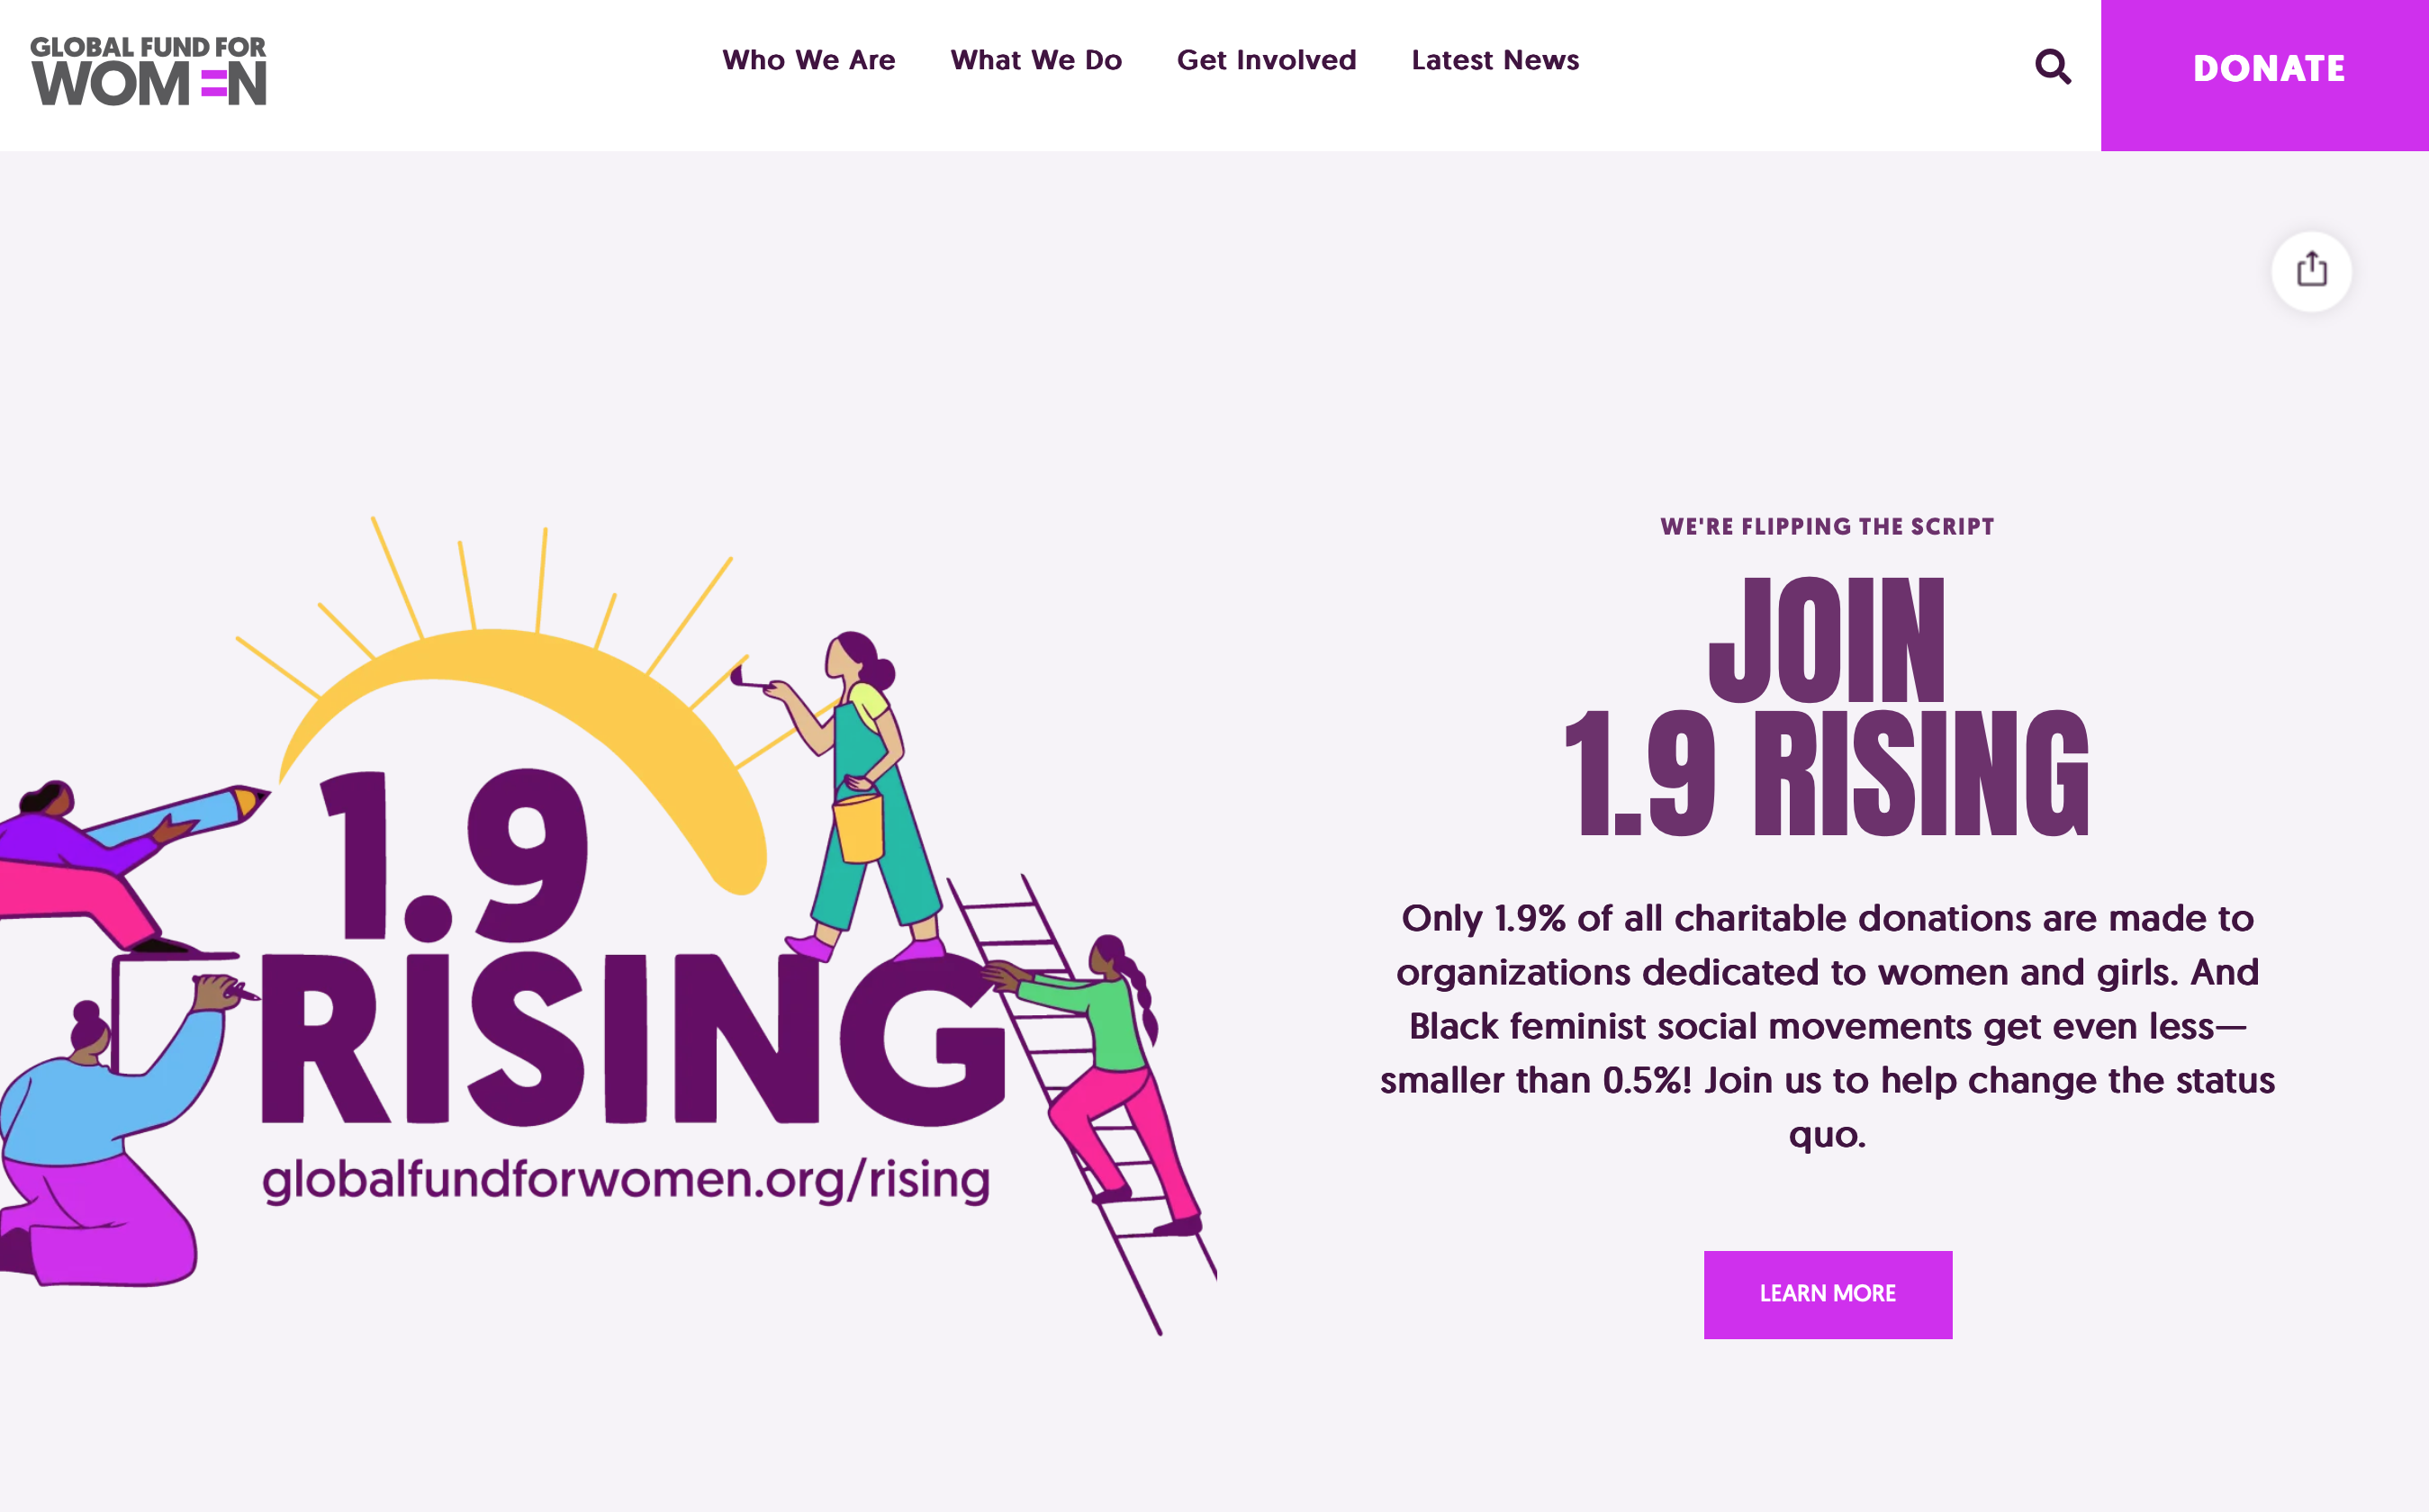
Global Fund for Women
Global Fund for Women

Global Gender Gap Report Browser, World Economic Forum
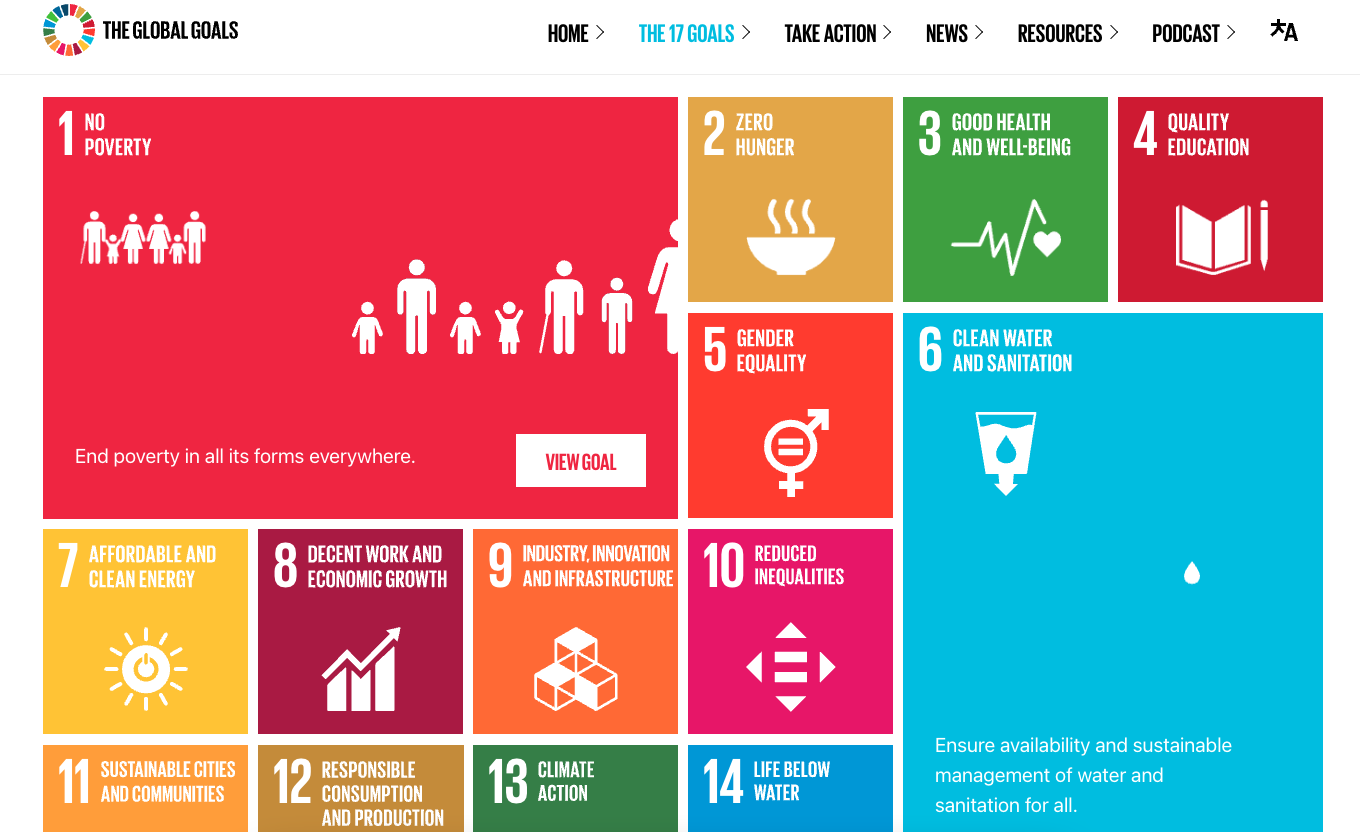
Global Goals
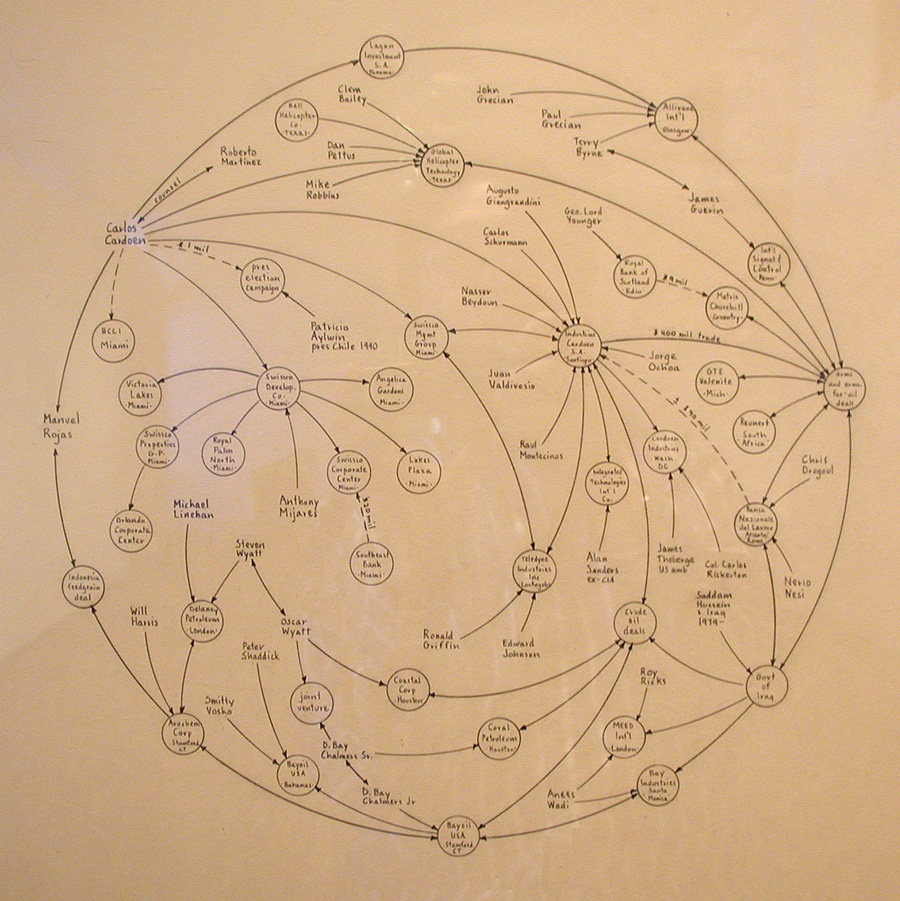
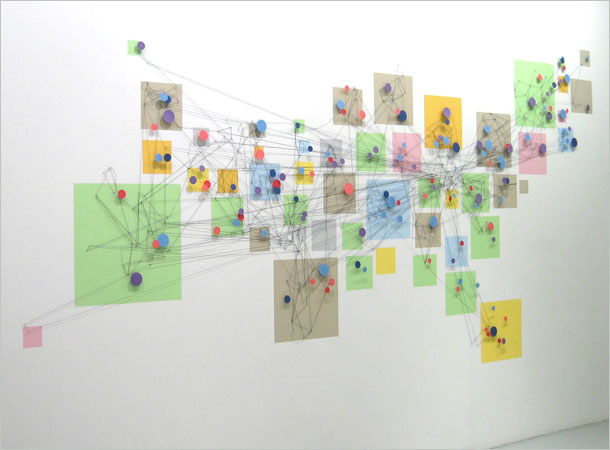
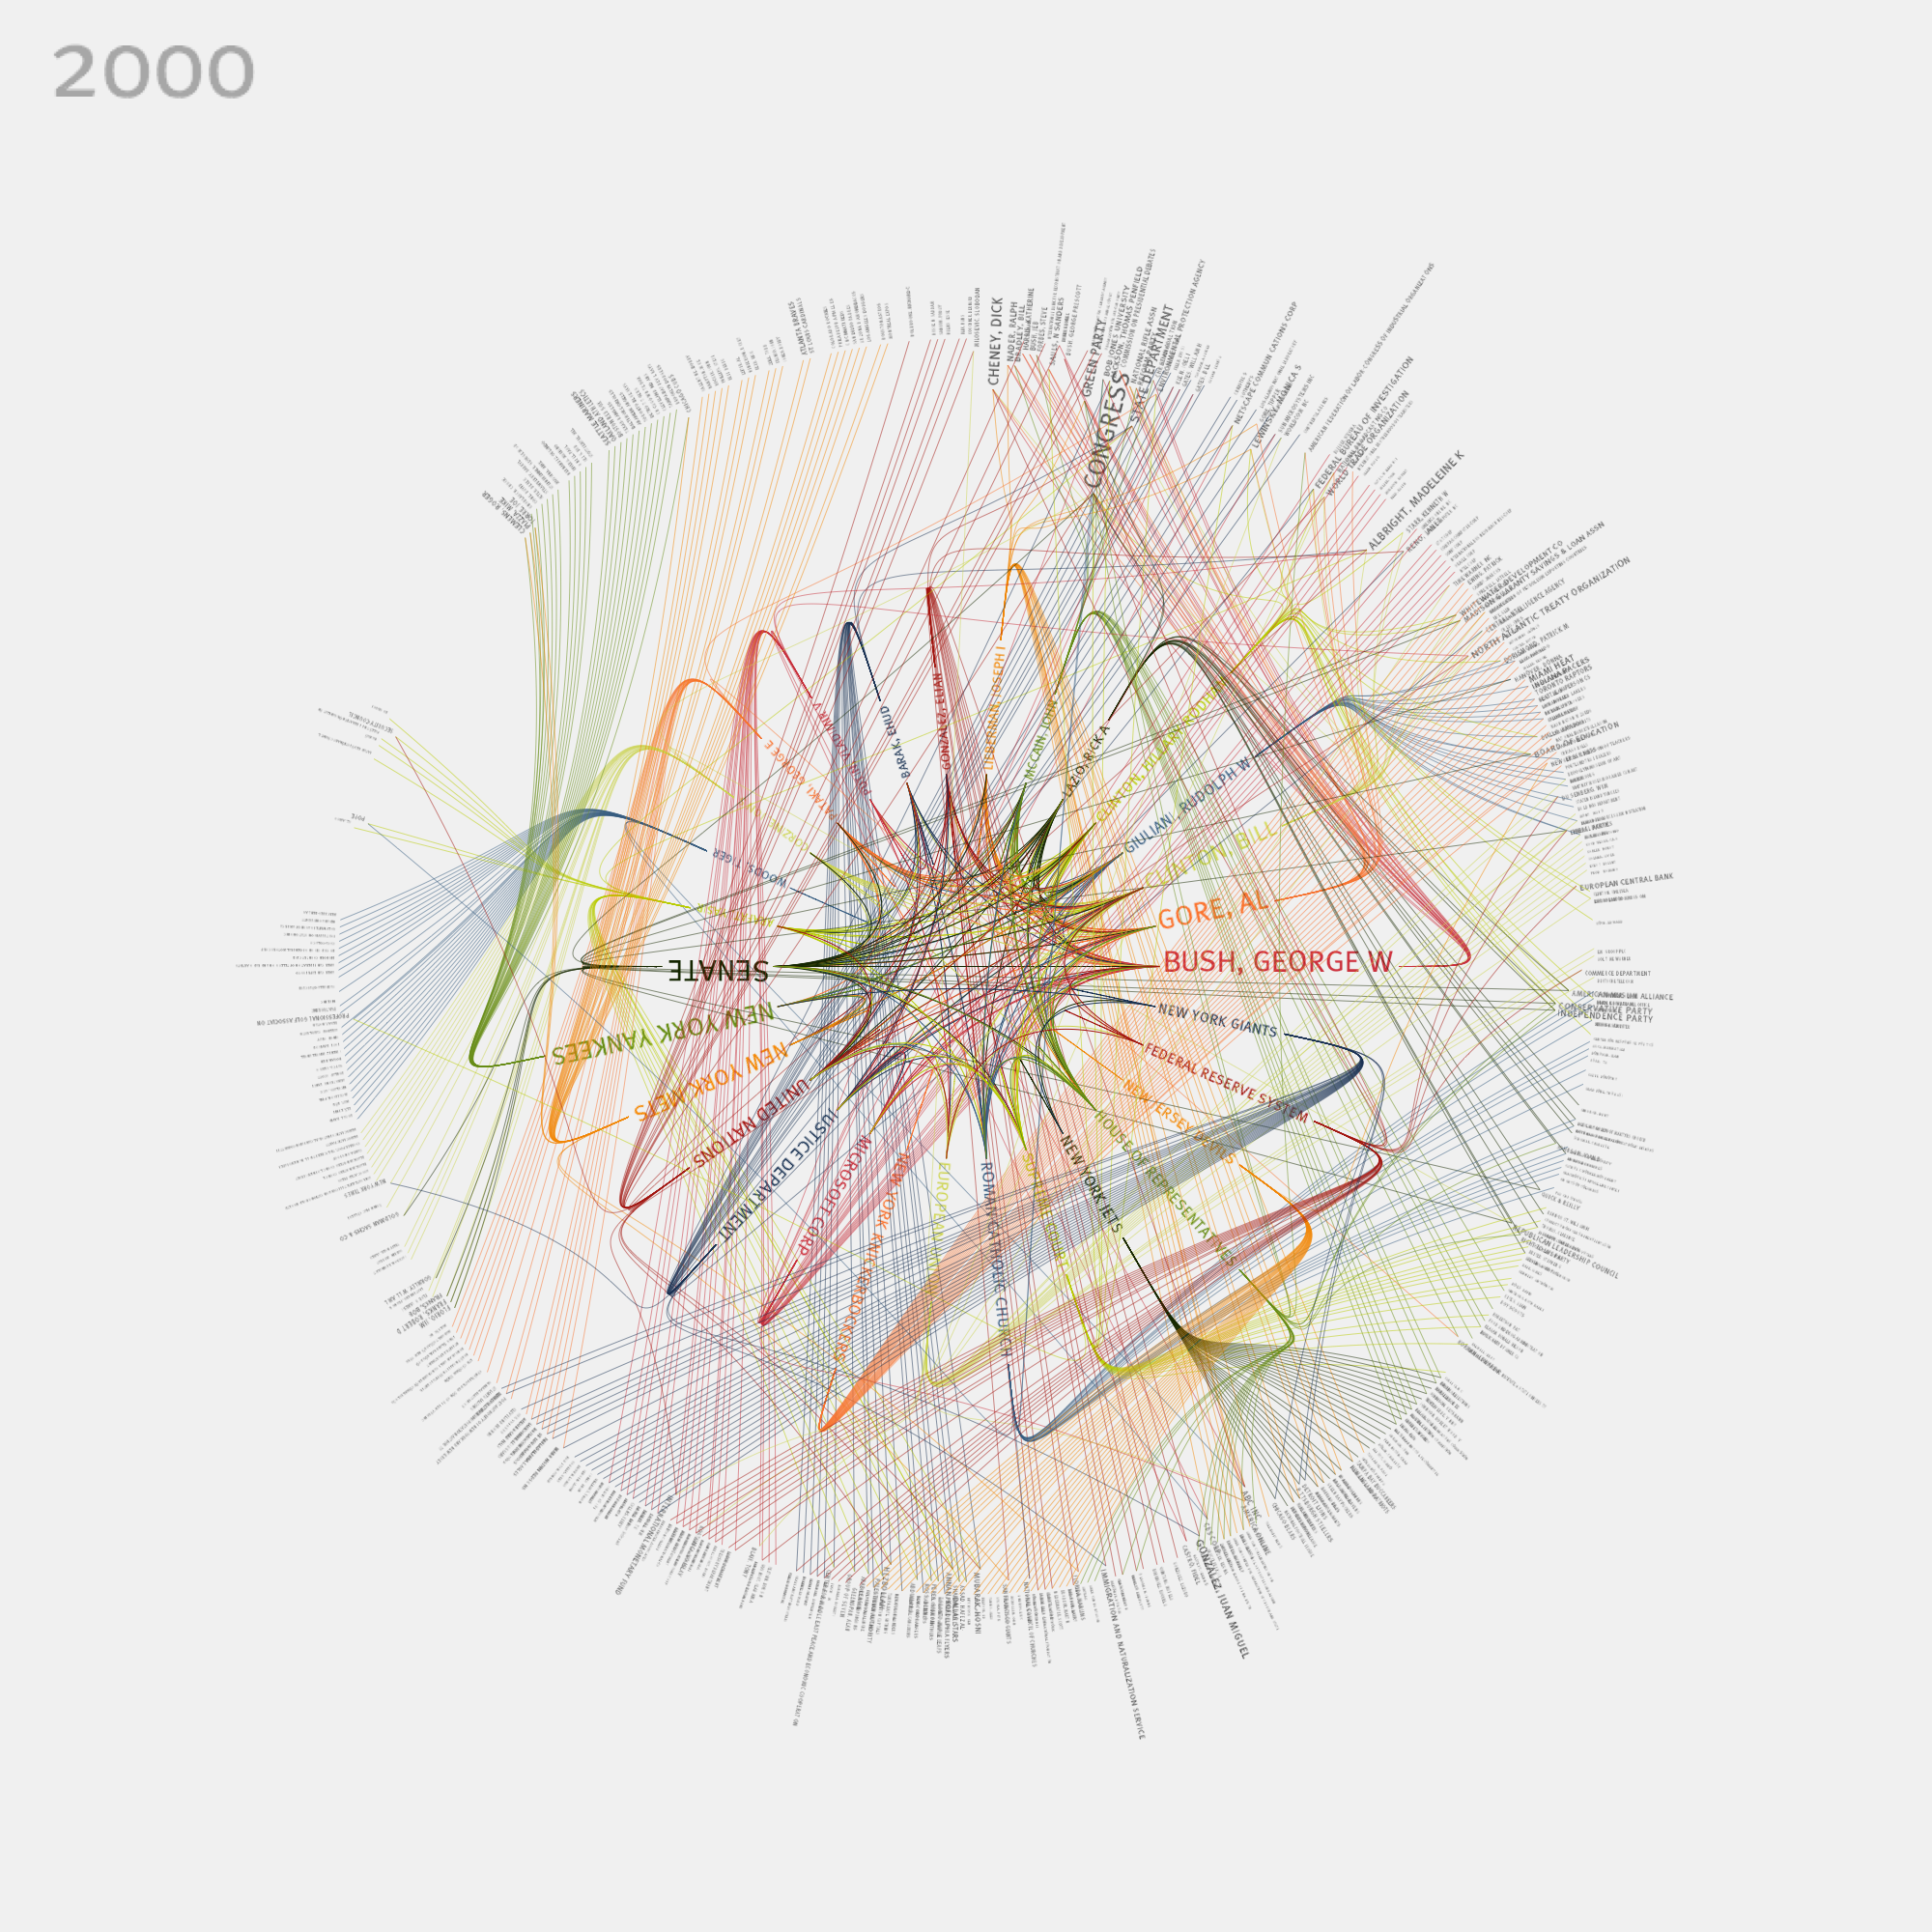
Global Networks
Mark Lombardi
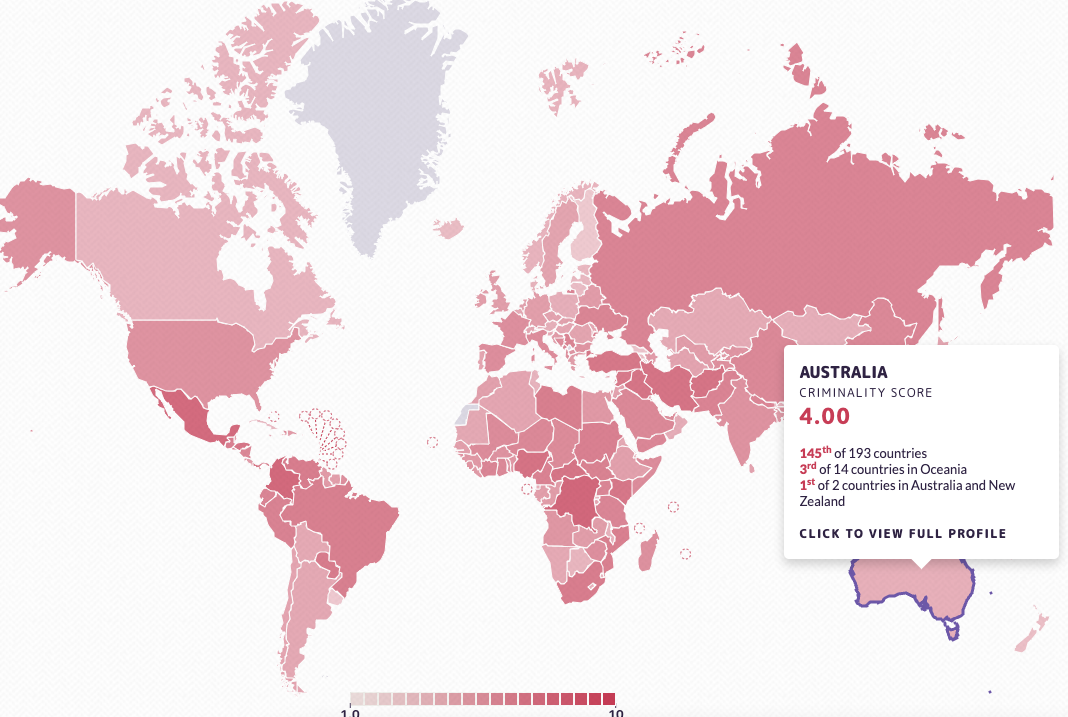
Global Organized Crime Index
Global Initiative
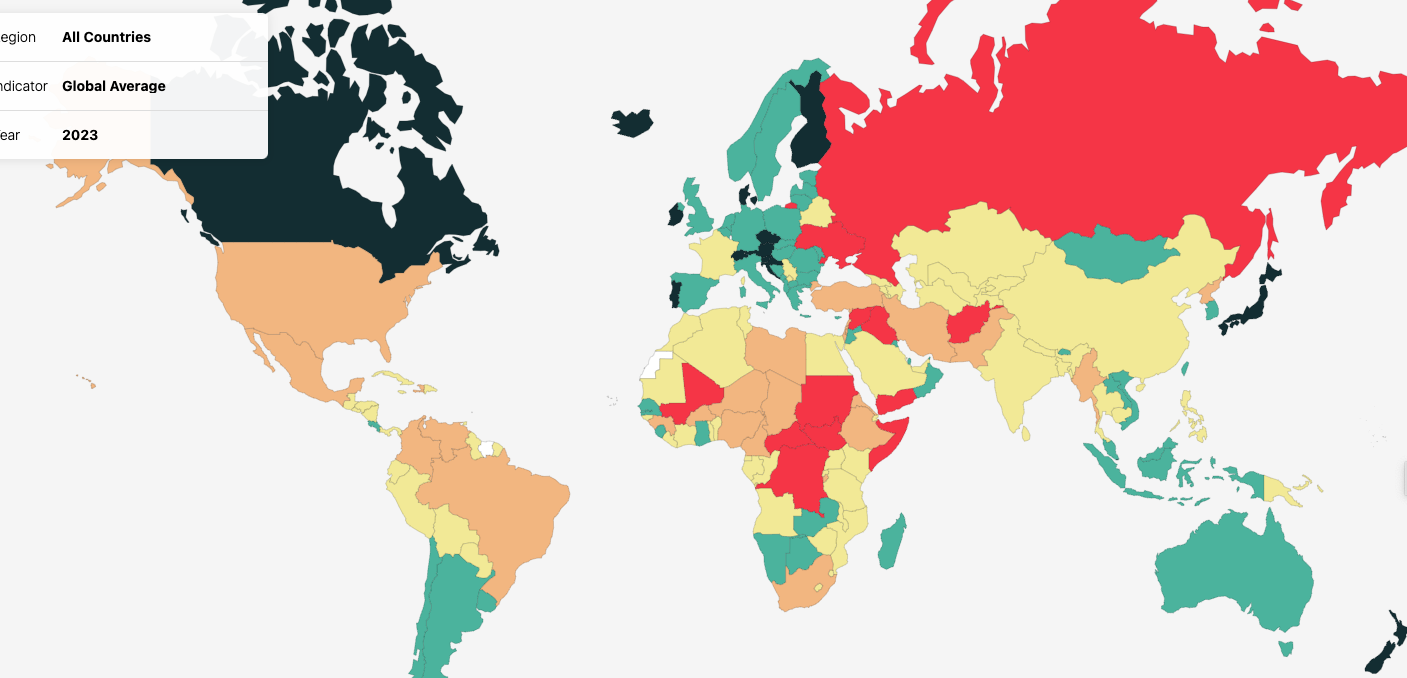
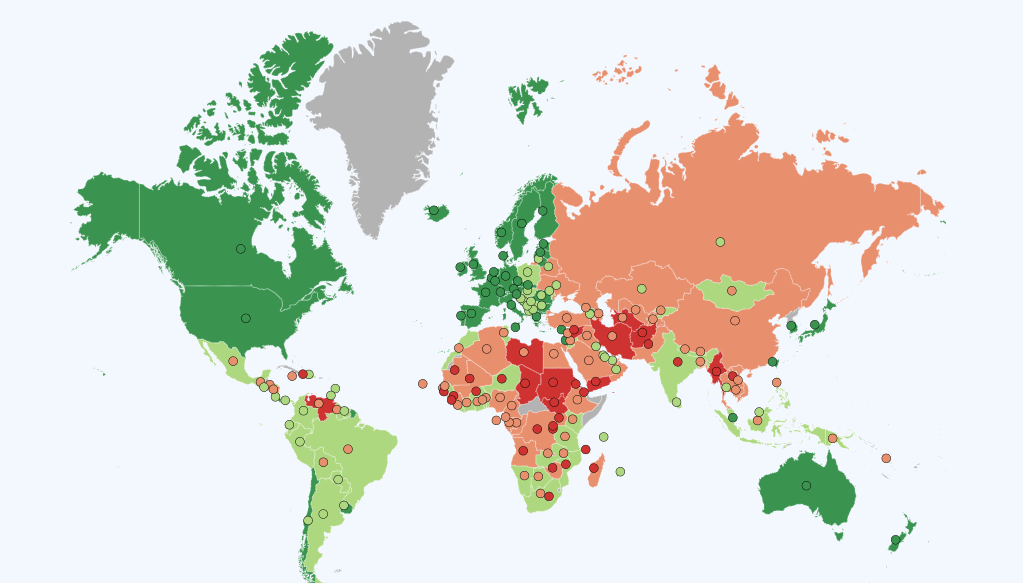
Global Peace Index
Vision of Humanity
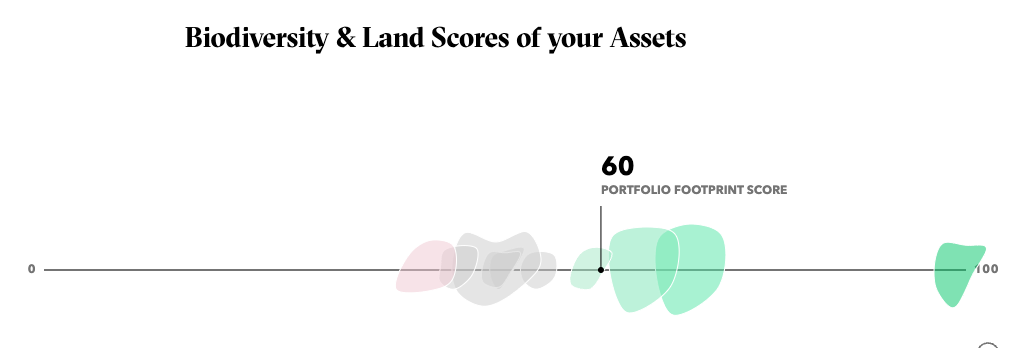
Globance World Footprint
Golan Axis
Golan Levin
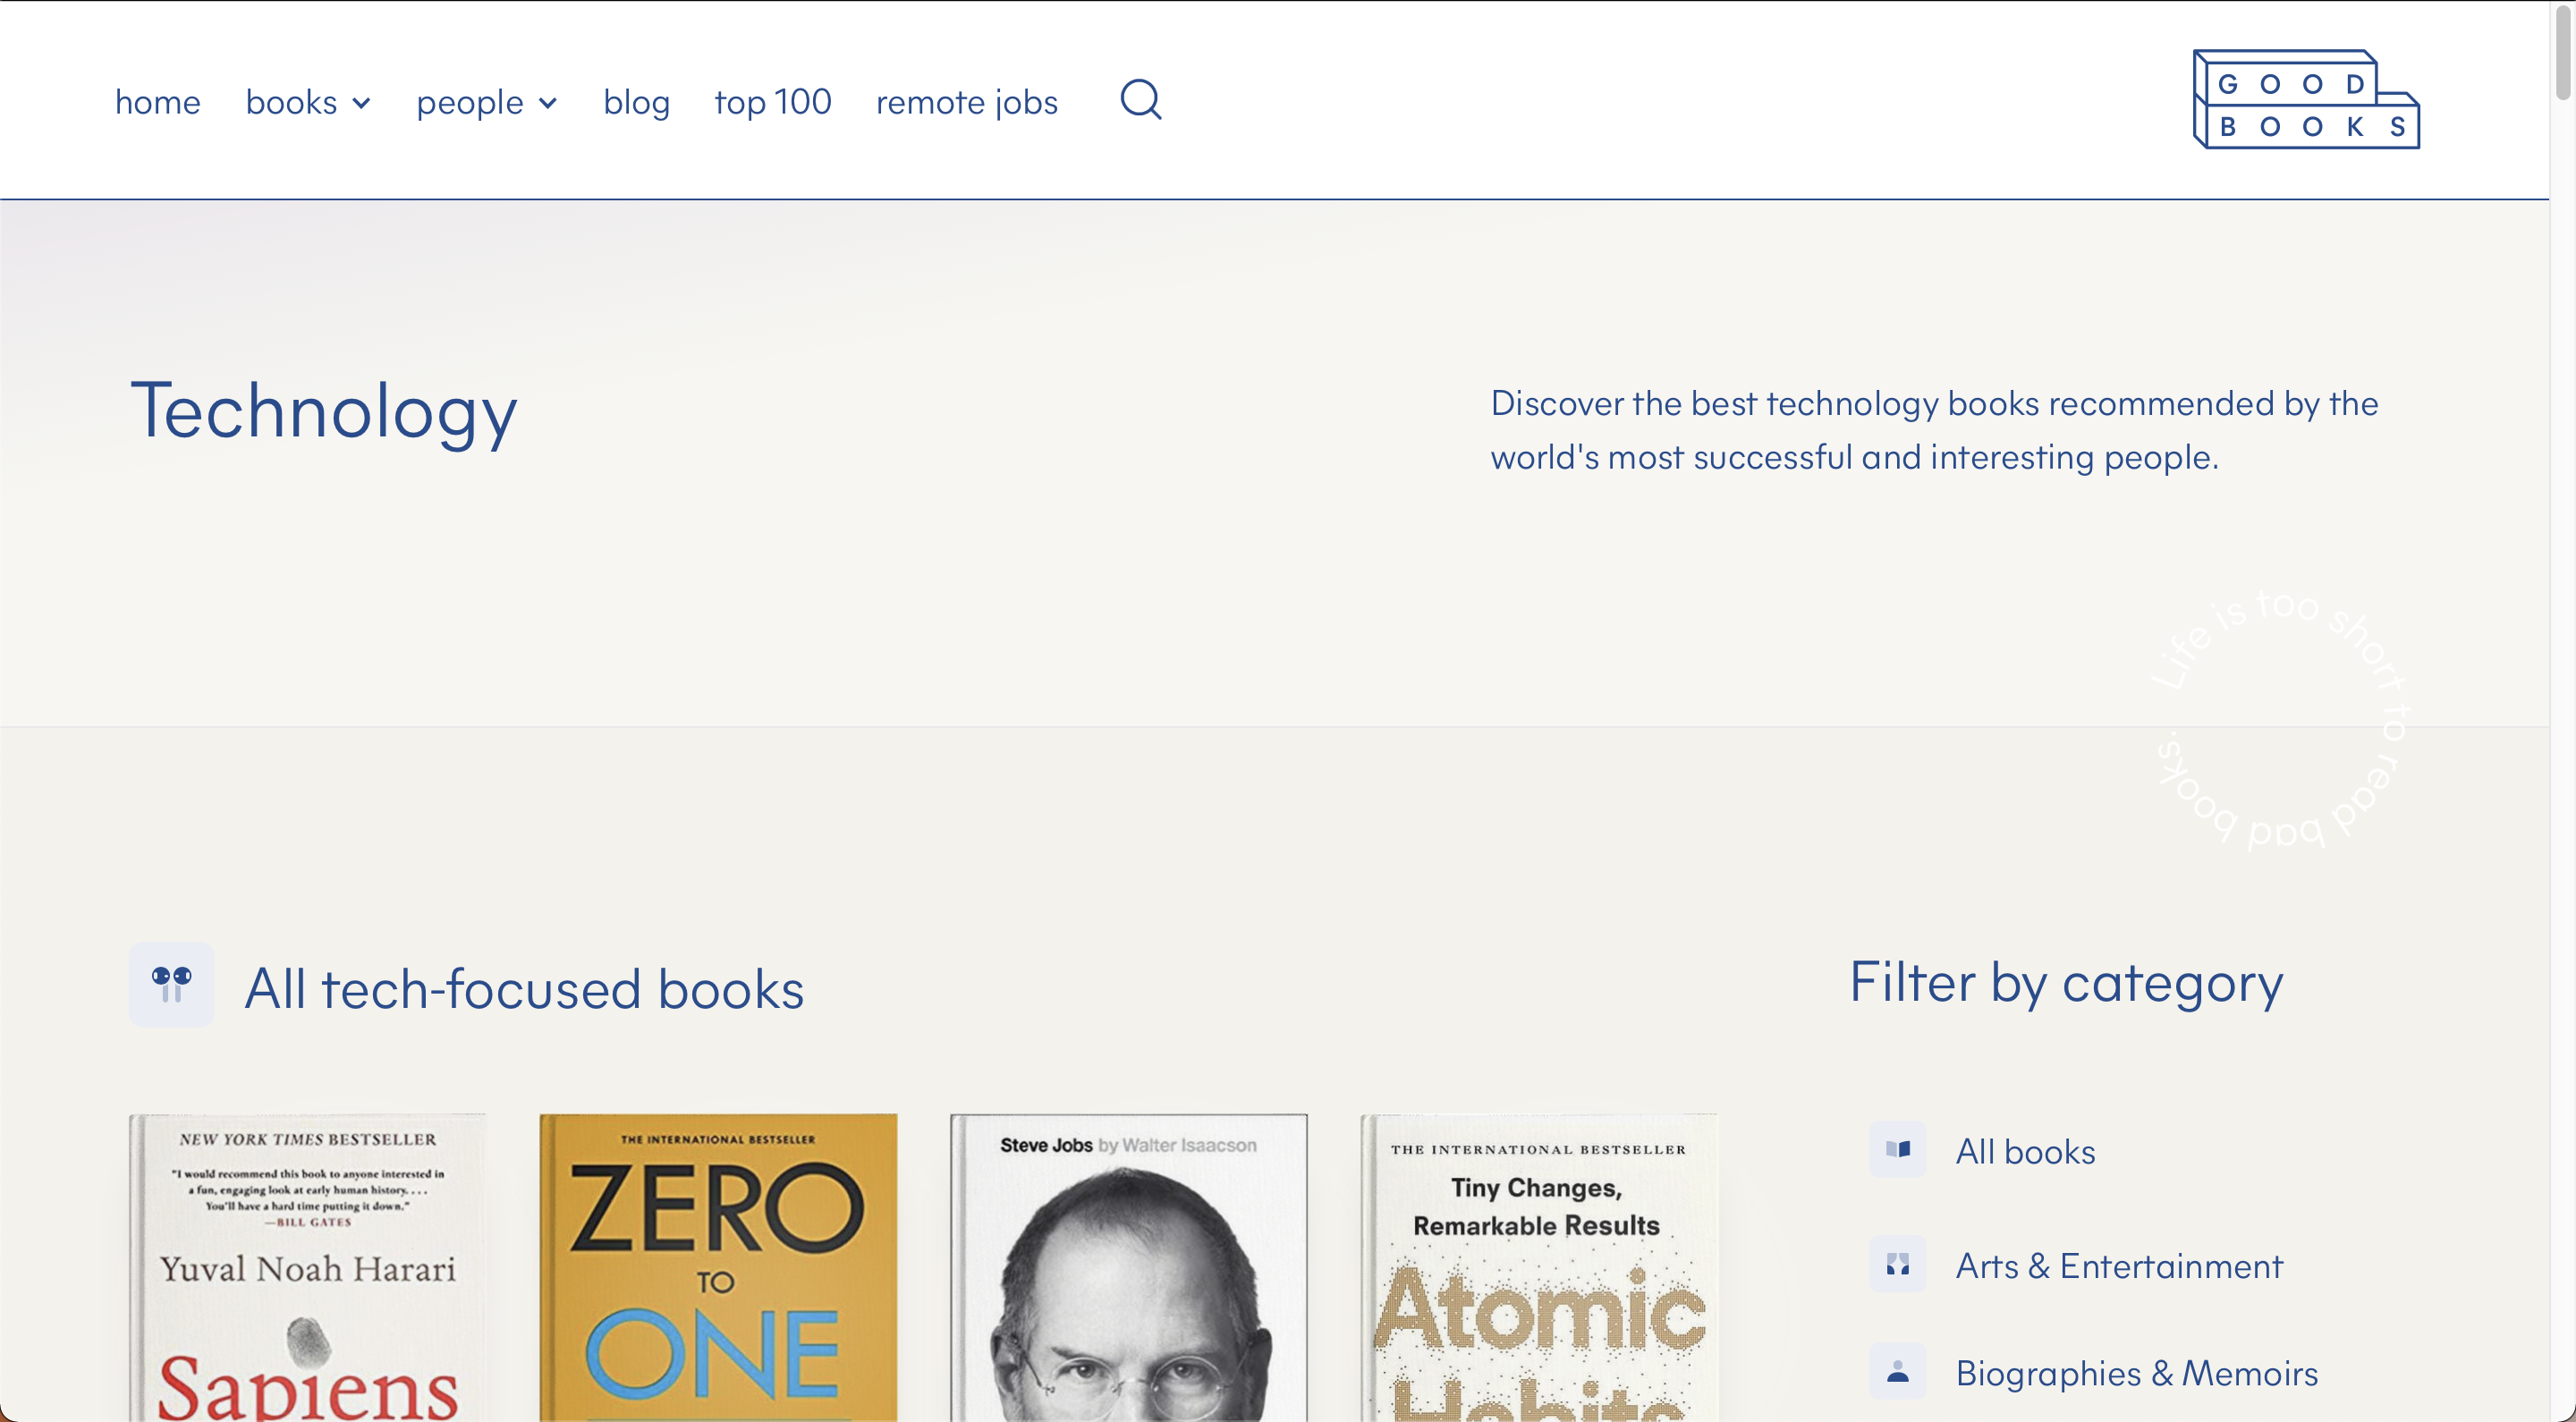
Good Books
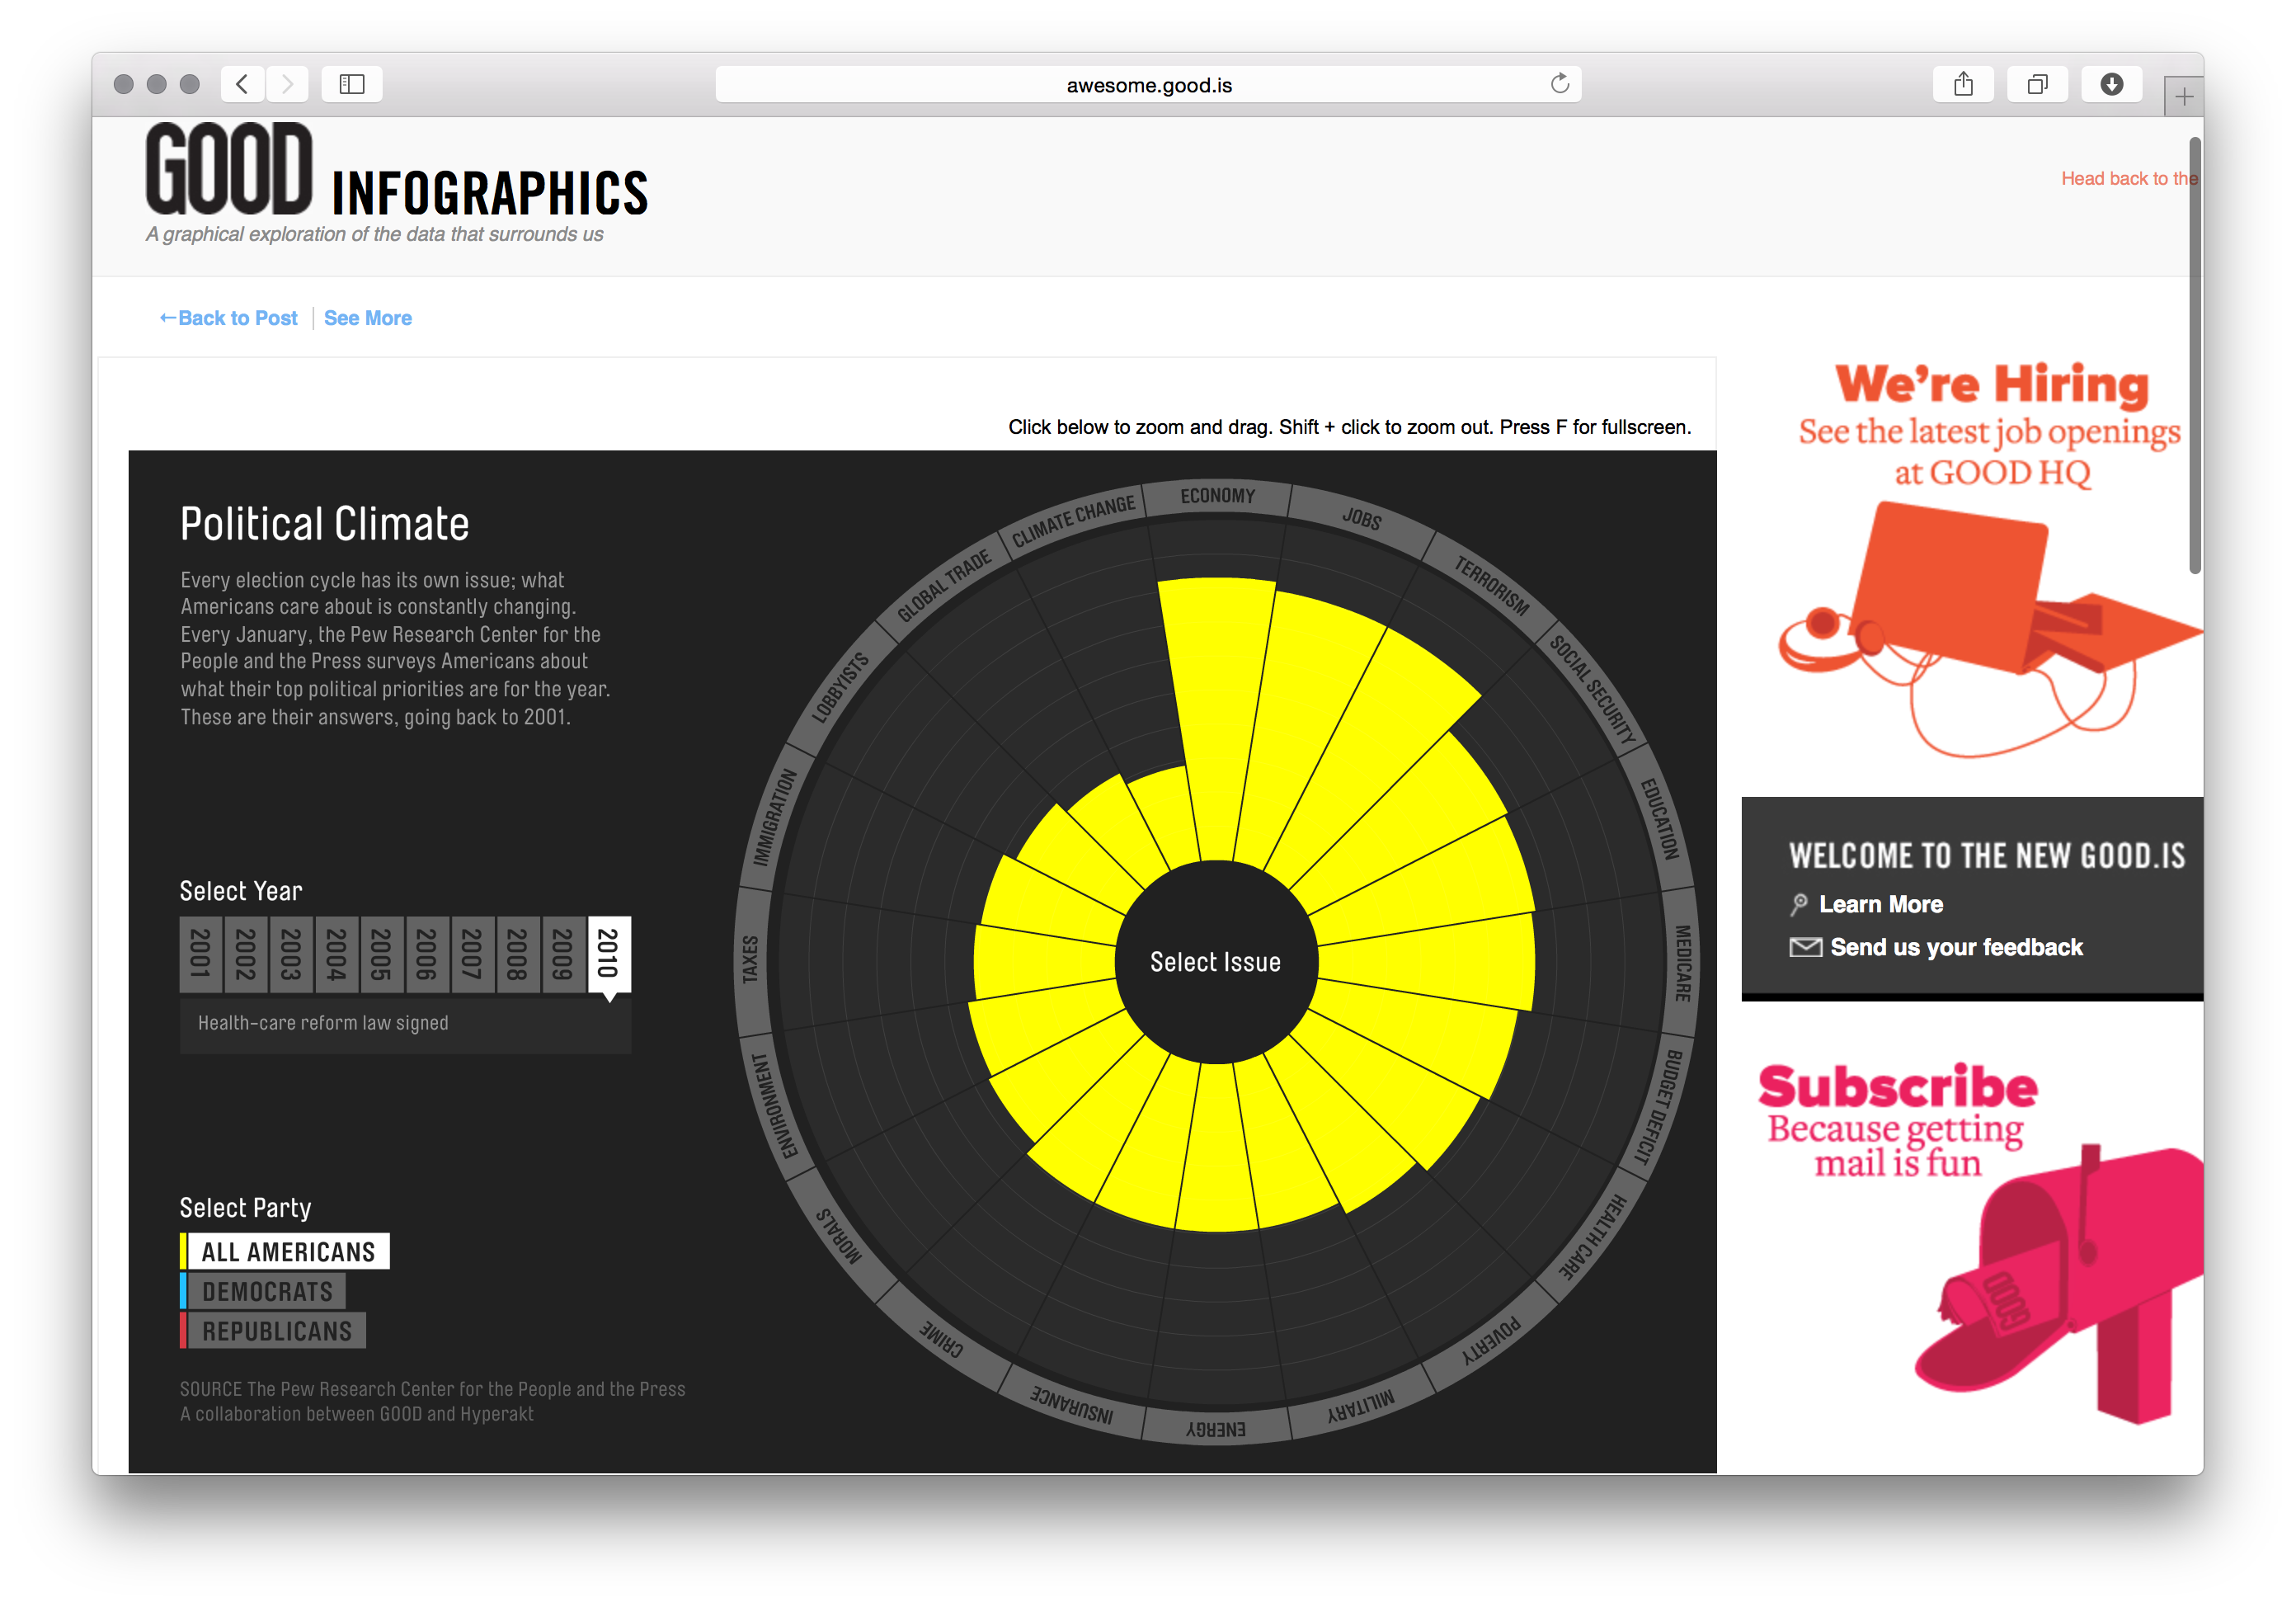
GOOD Magazine Infographics
GOOD Magazine
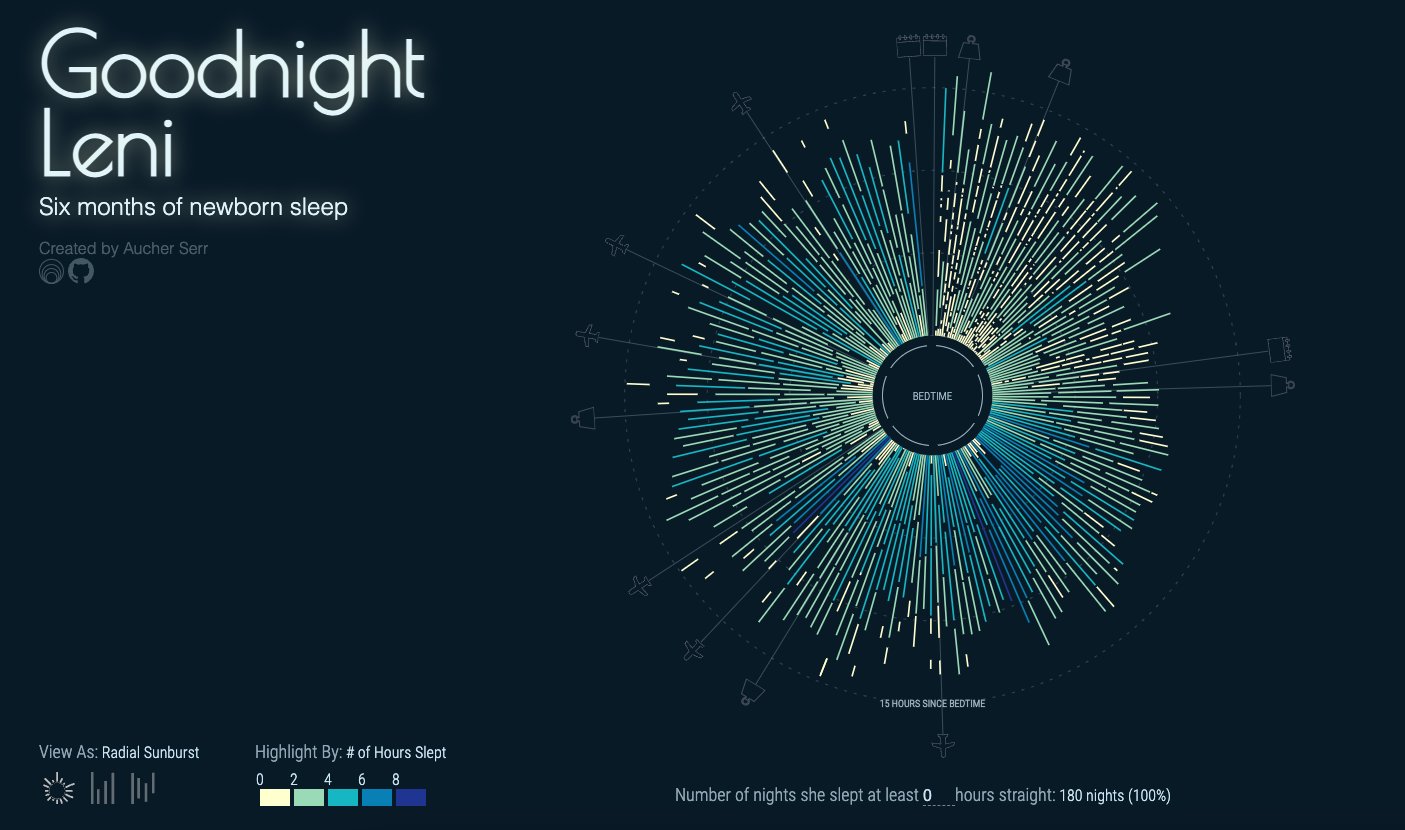
Goodnight Leni

Google AI - Our AI Journey and Milestones
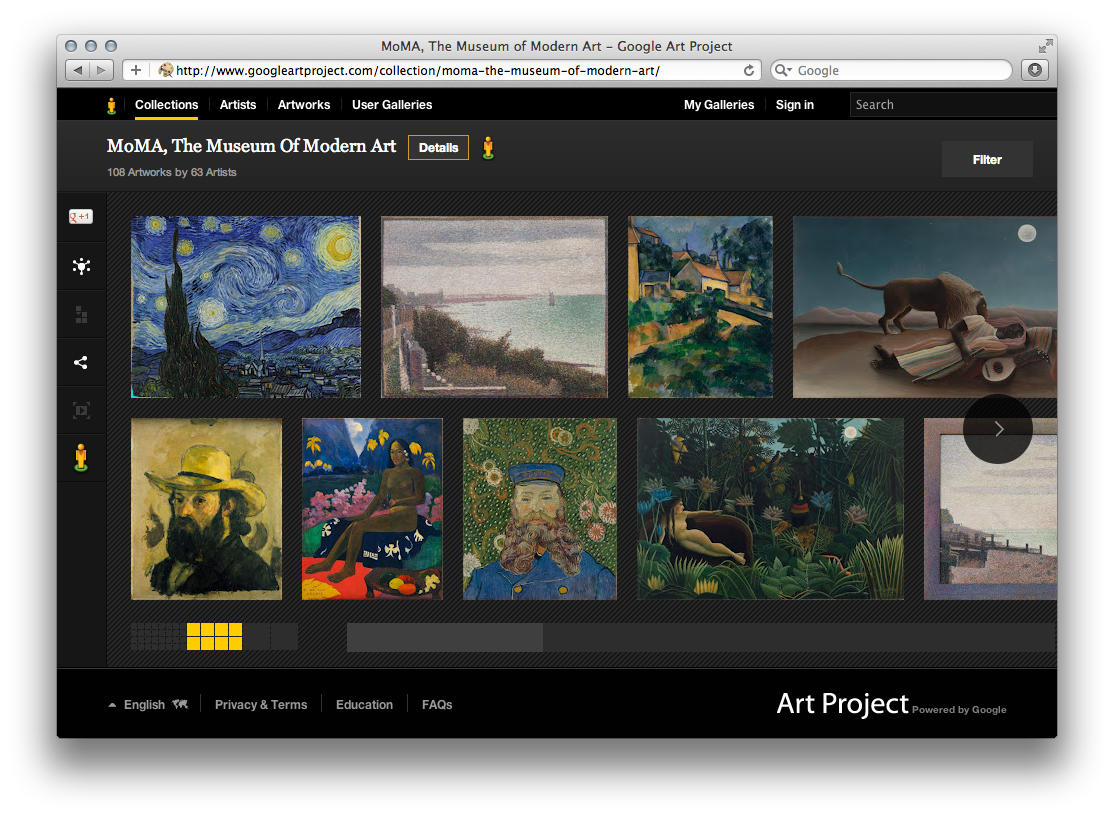
Google Art Project
Google Cultural Institute
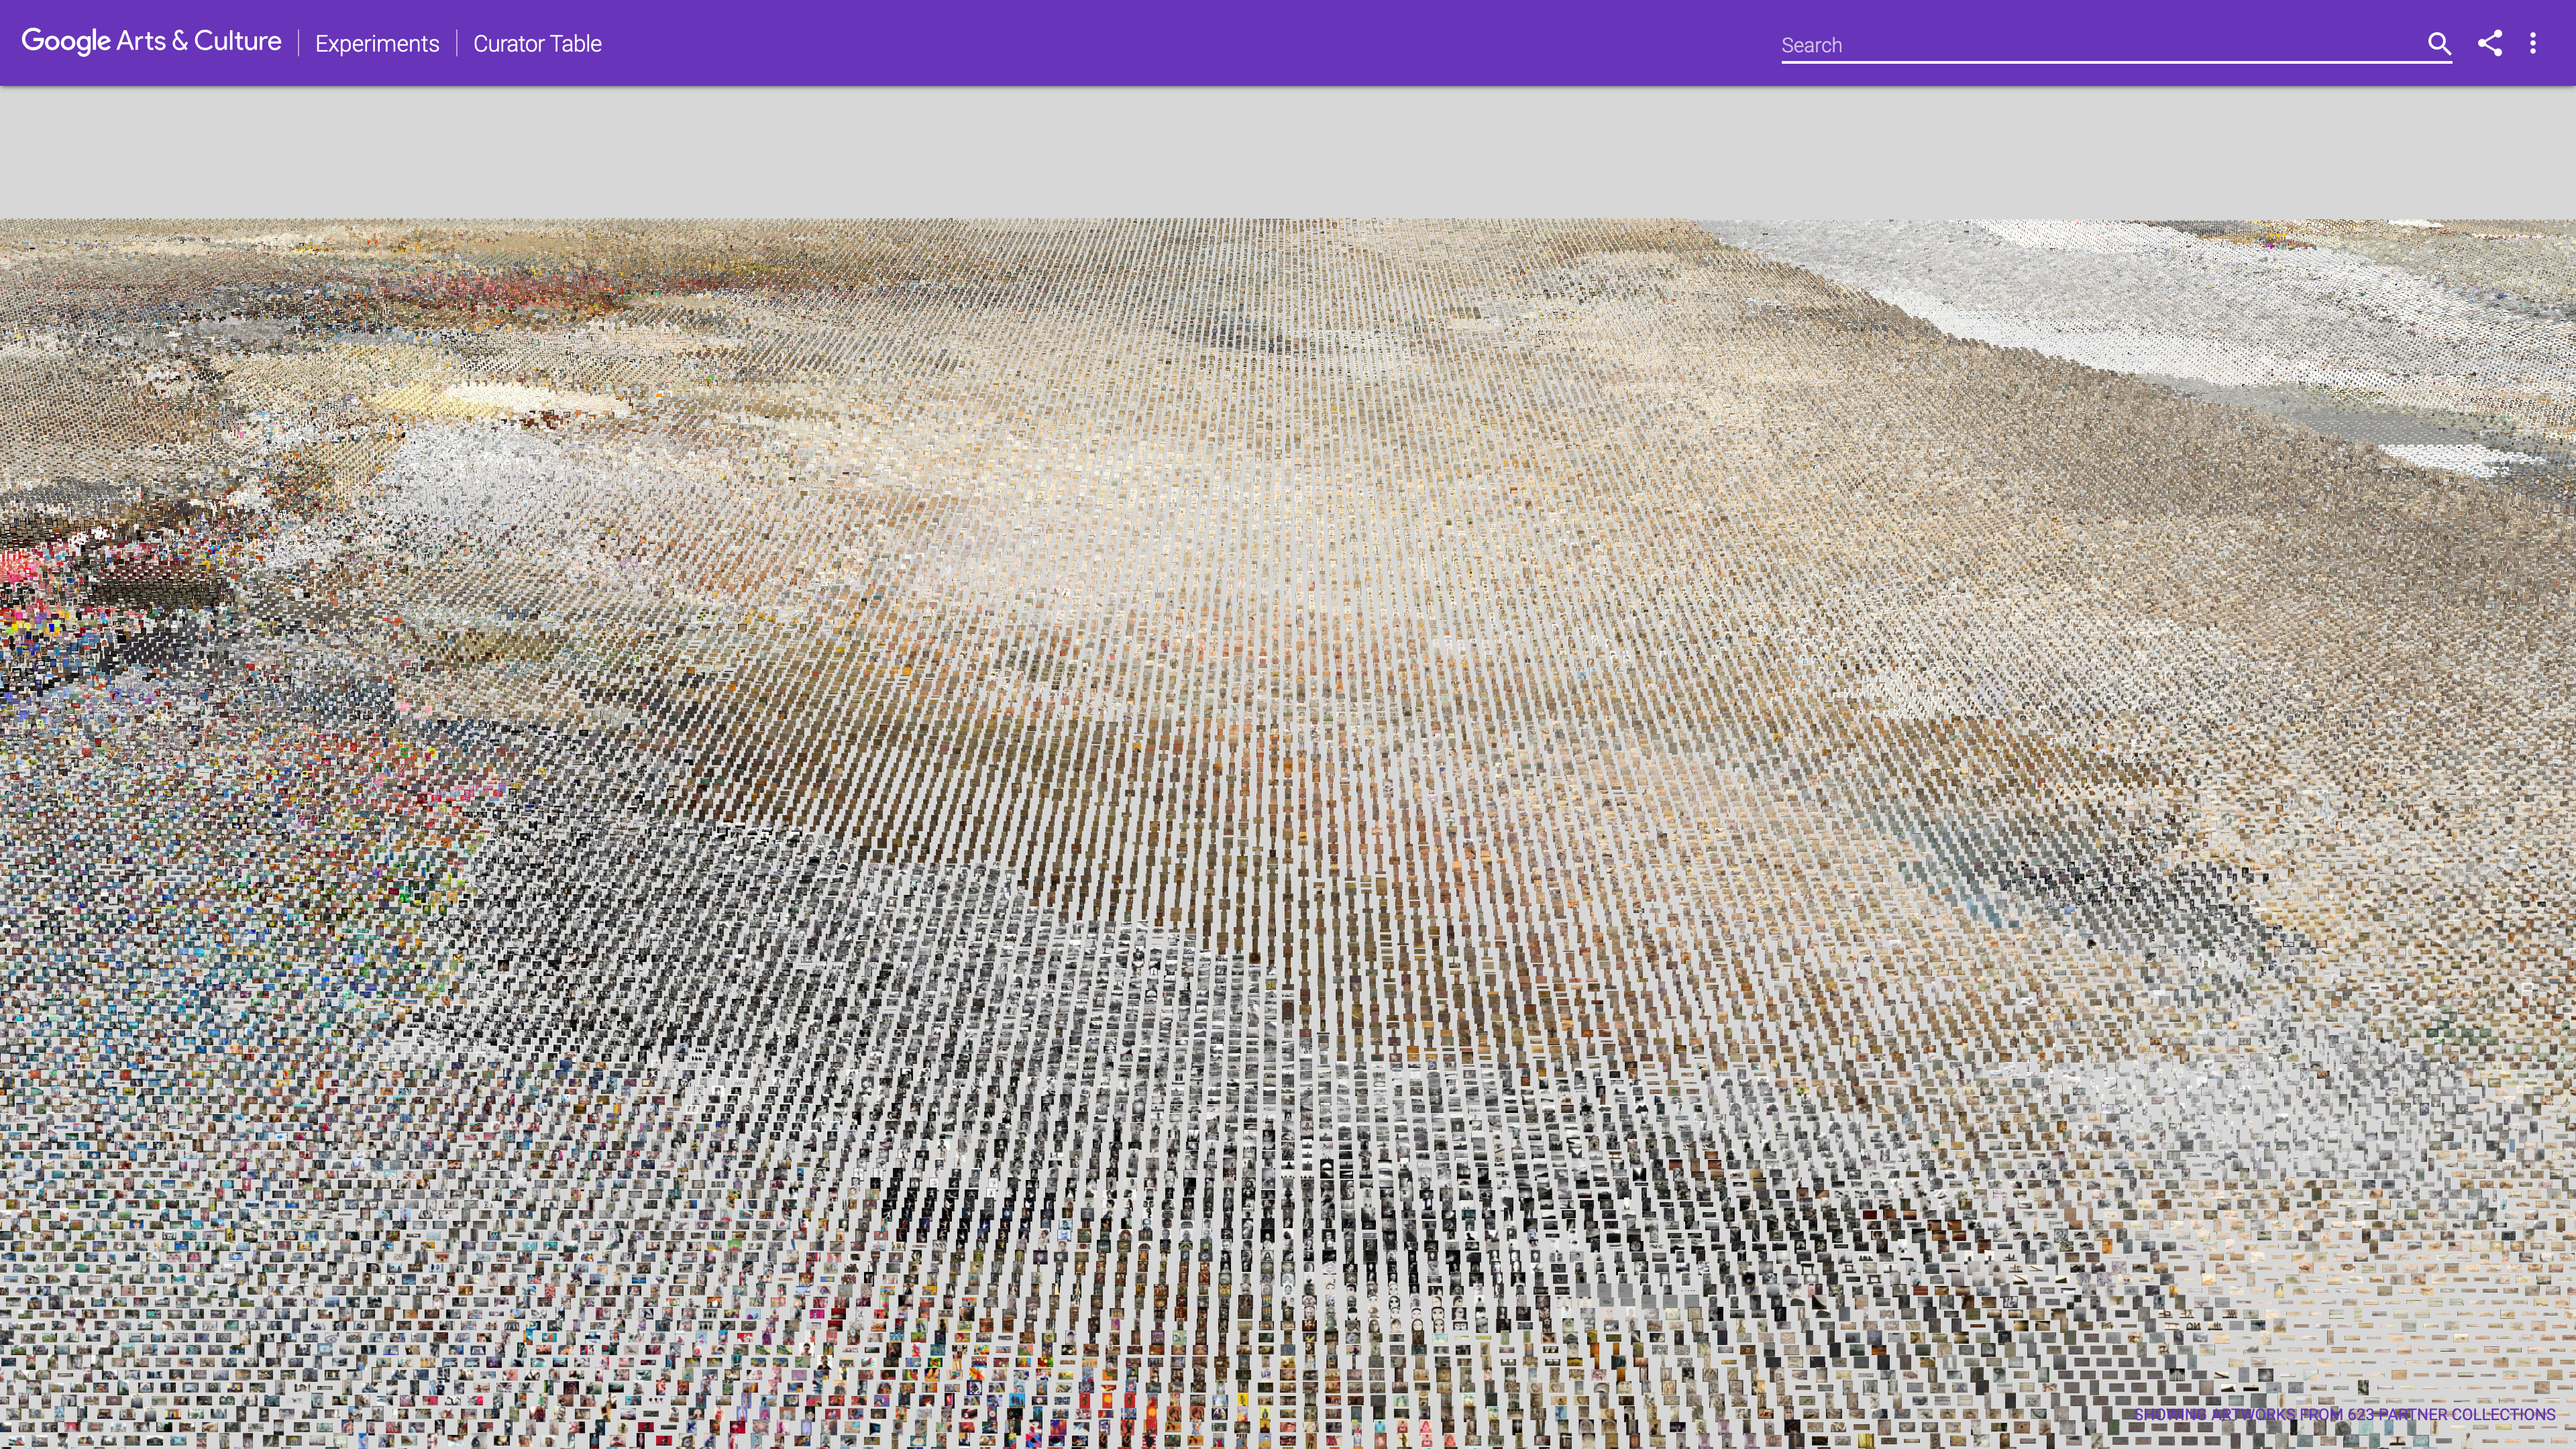
Google Curator Table
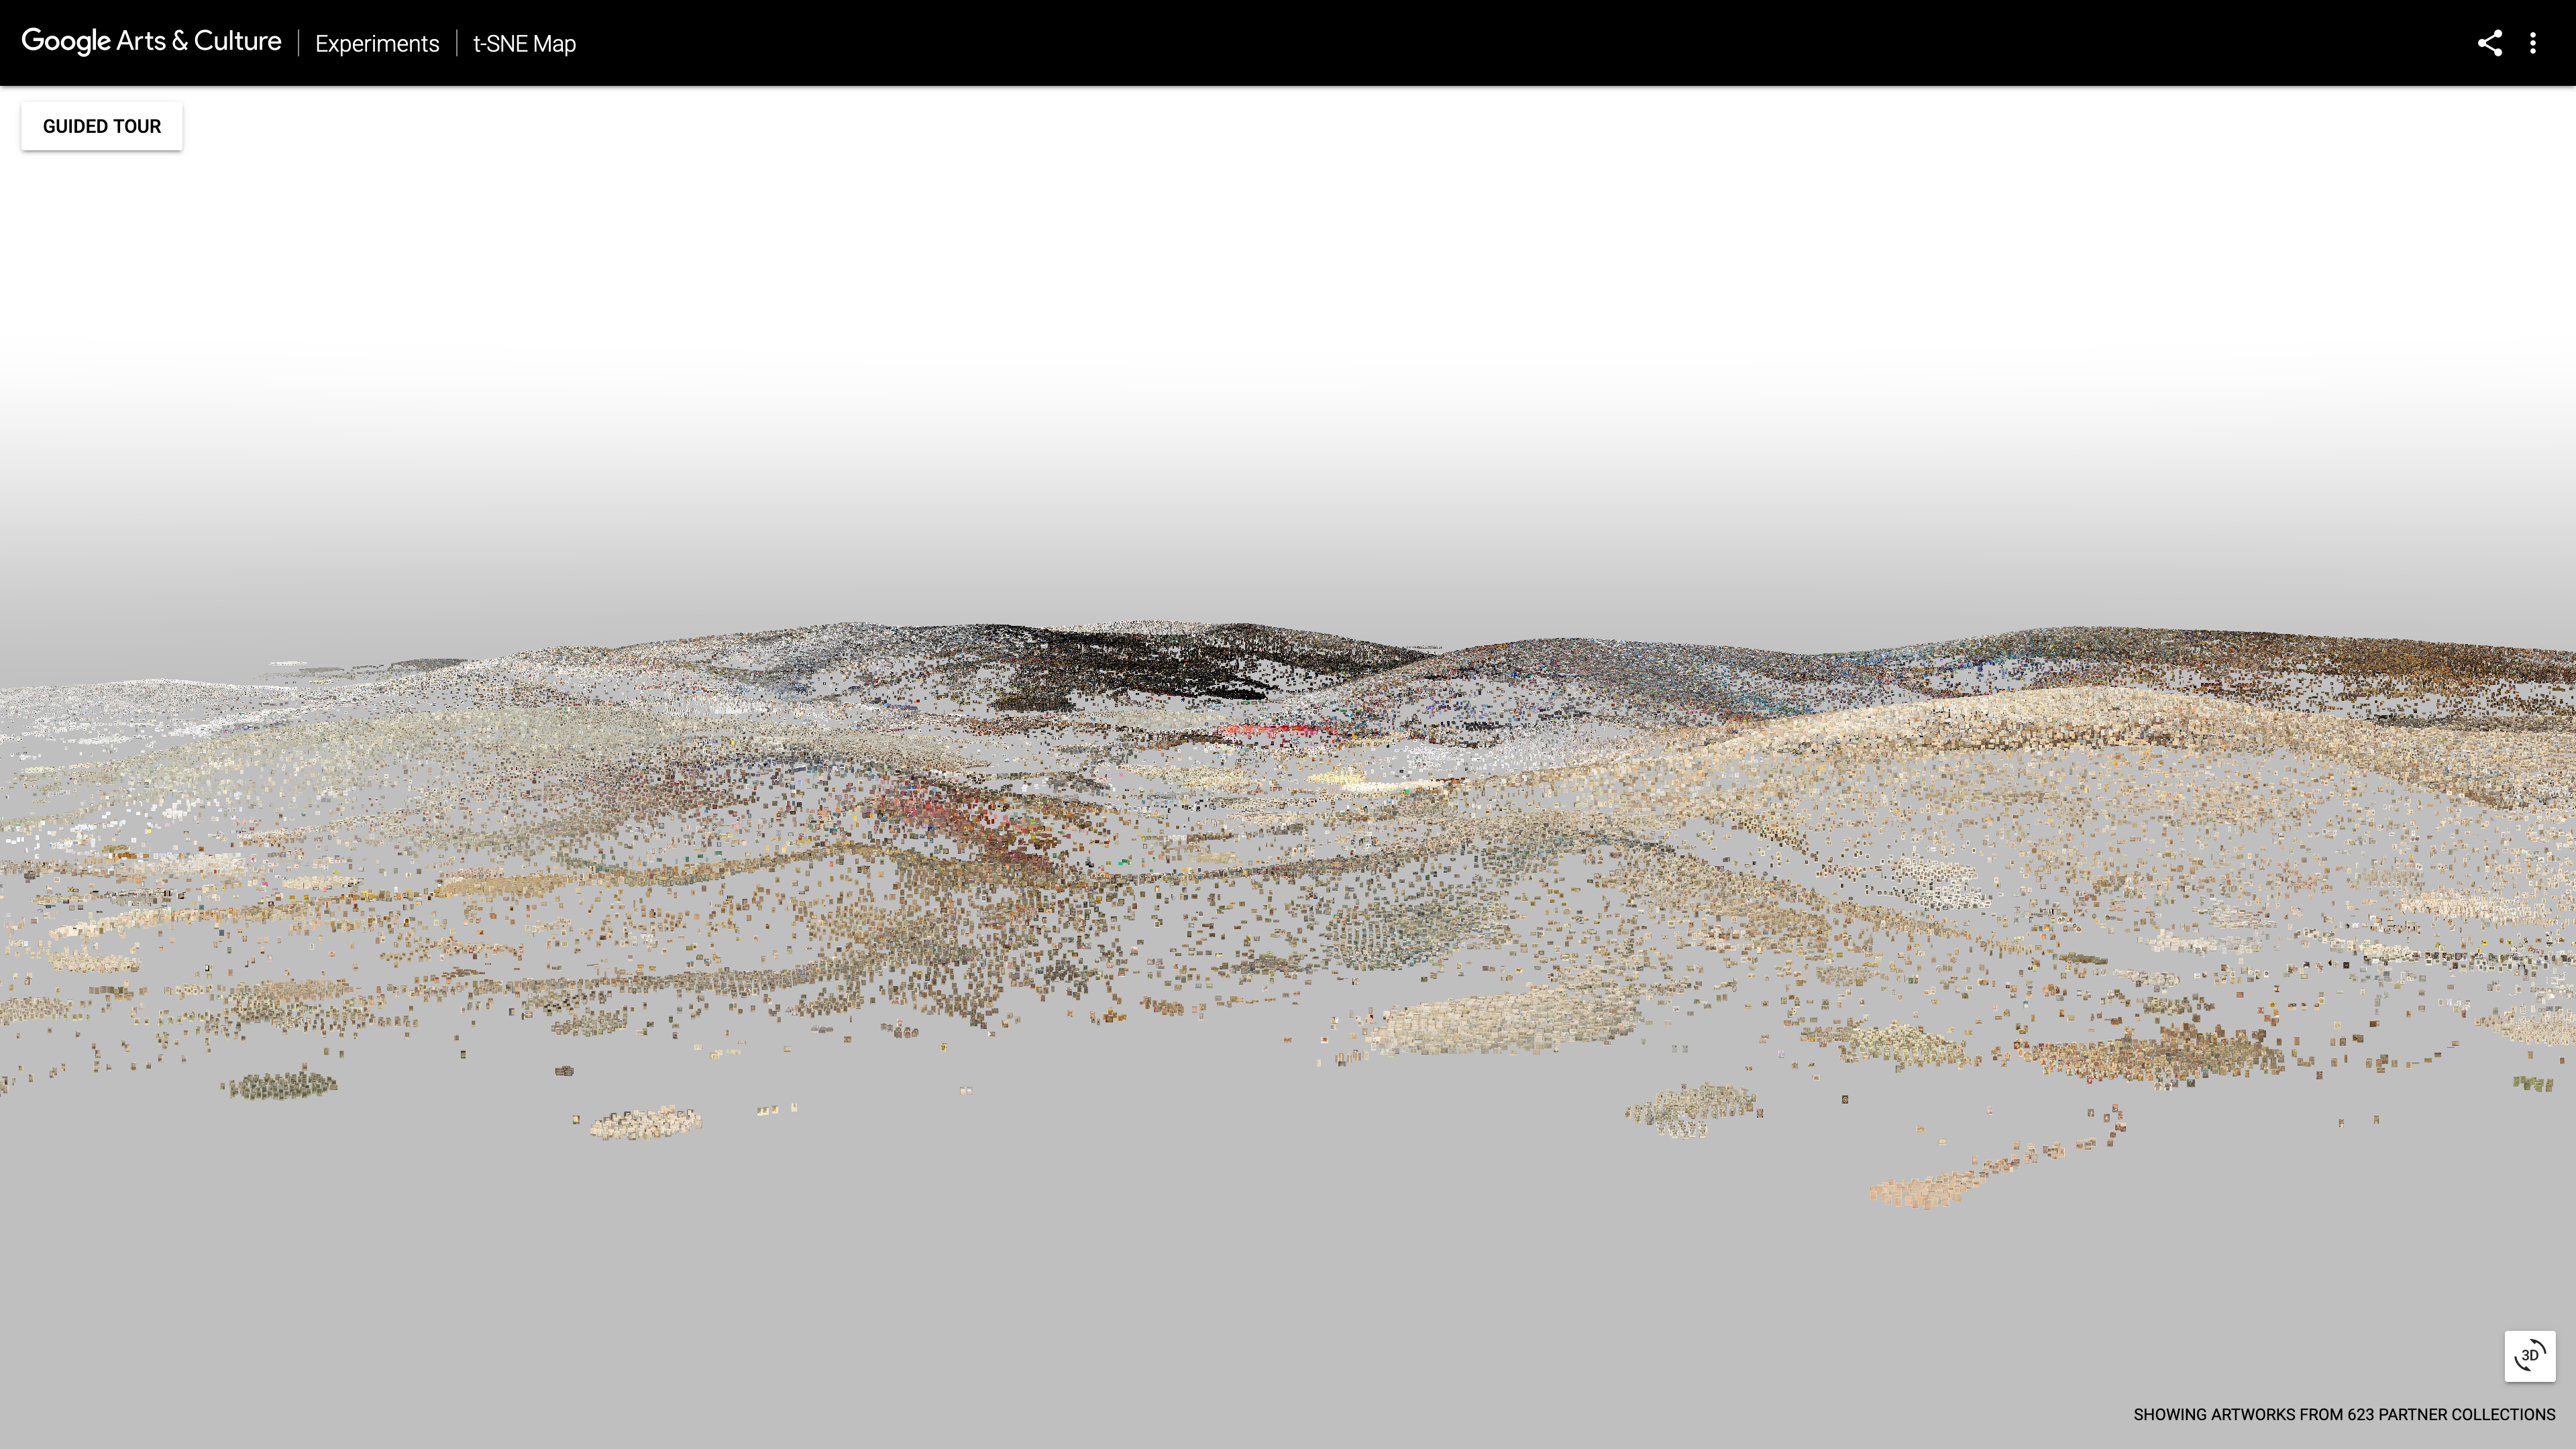
Google TSNA Map
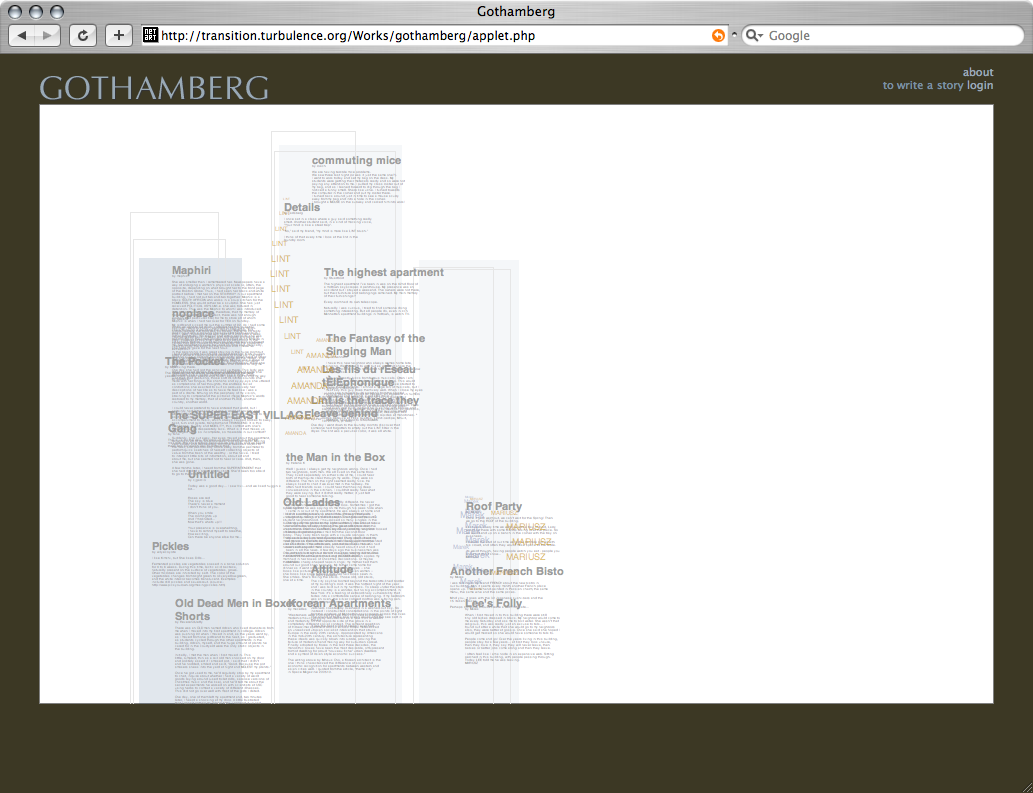
Gothamberg
Martin Wattenberg
Graphical Integrity
Edward Tufte
Green Chameleon: 2018 Year in Review
Grids Obys Agency
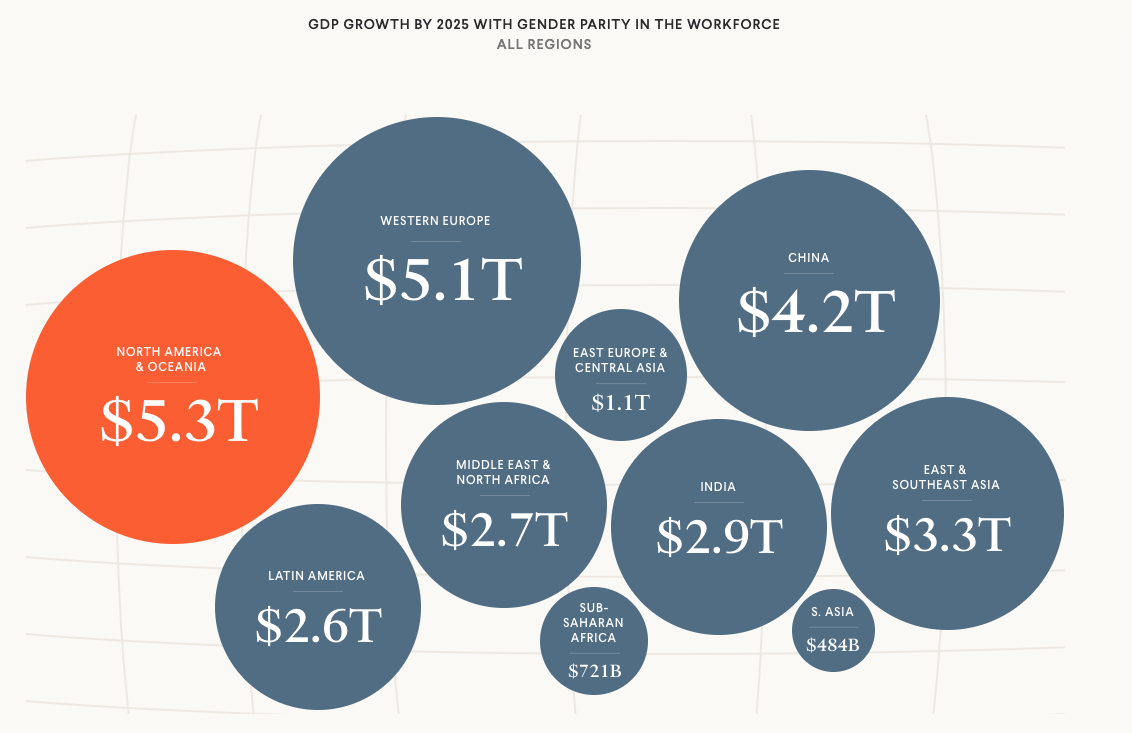
Growing Economies Through Gender Parity
Council on Foreign Relations
Guggenheim Collection Site
Guggenheim
Happiness
CNN
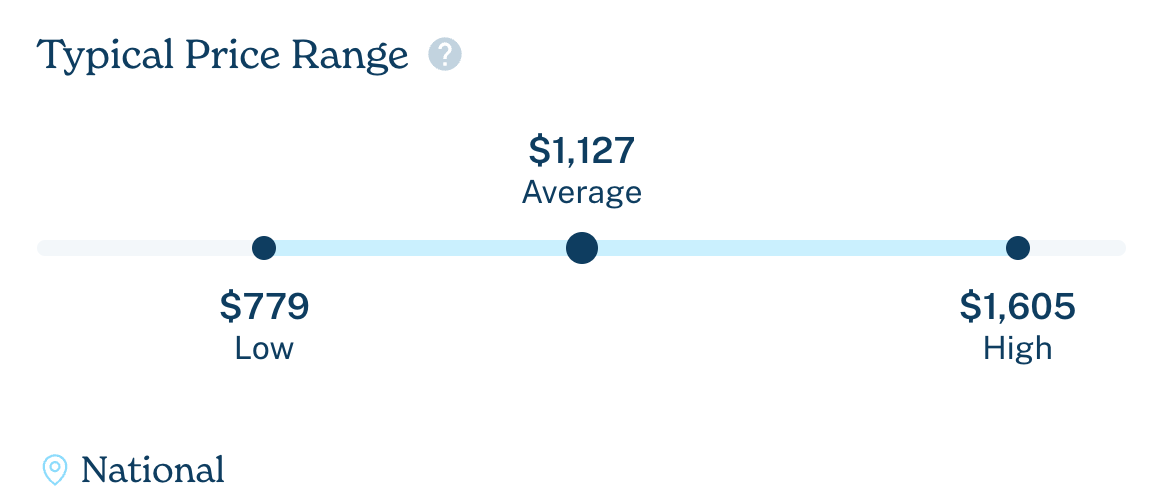
Health Care Price Comparison Tool
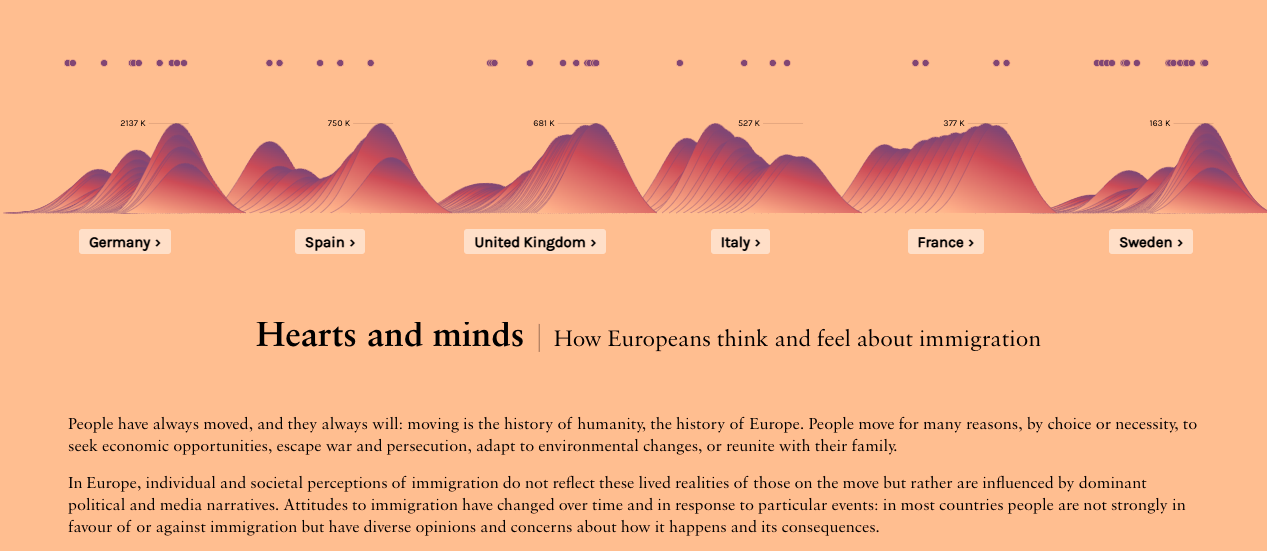
Hearts and Minds
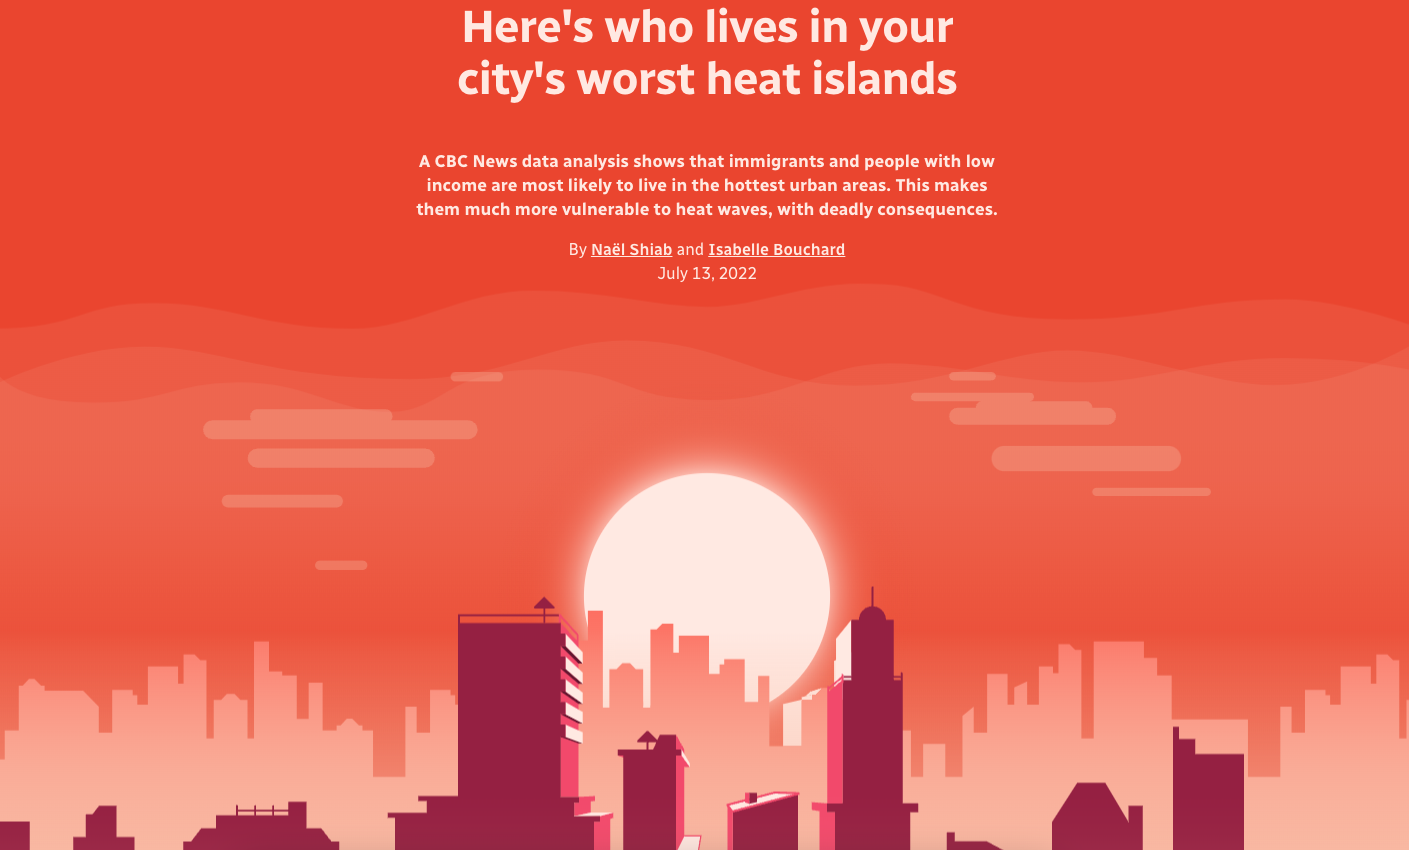
Here's Who Lives in Your City's Worst Heat Islands
Radio-Canada
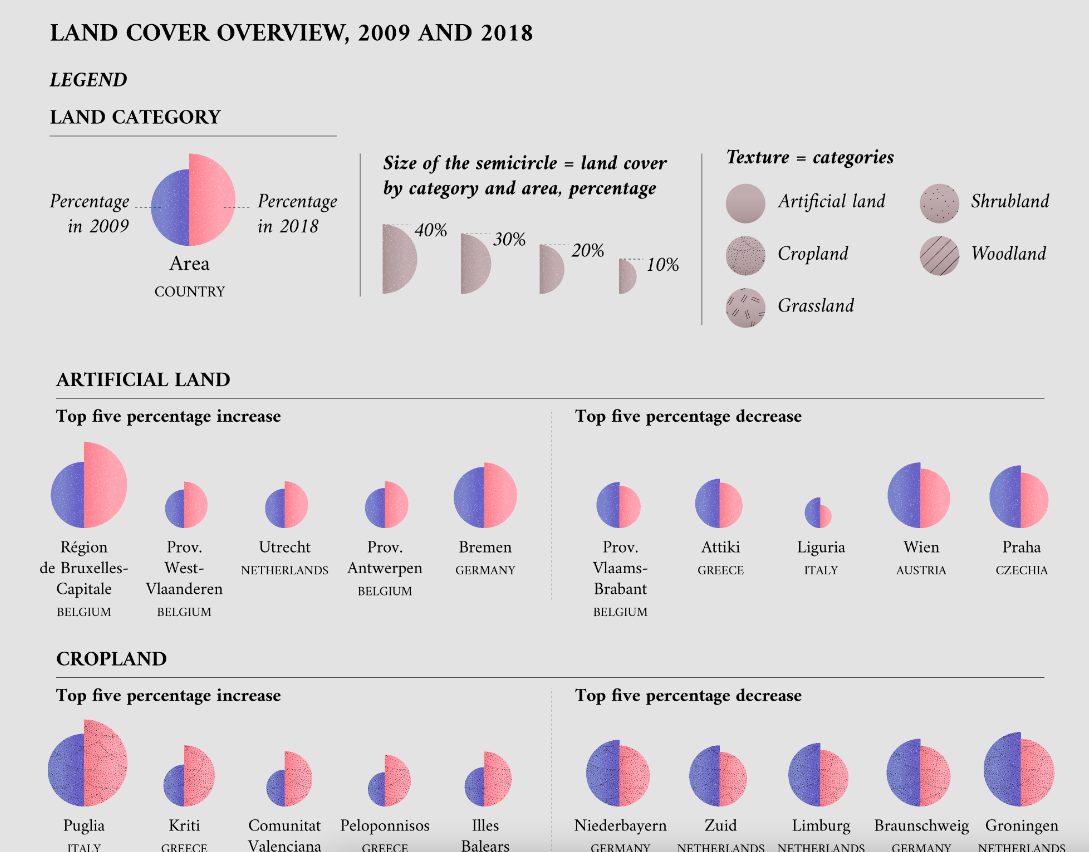
High-value Datasets – Land Use in the EU
European Commision
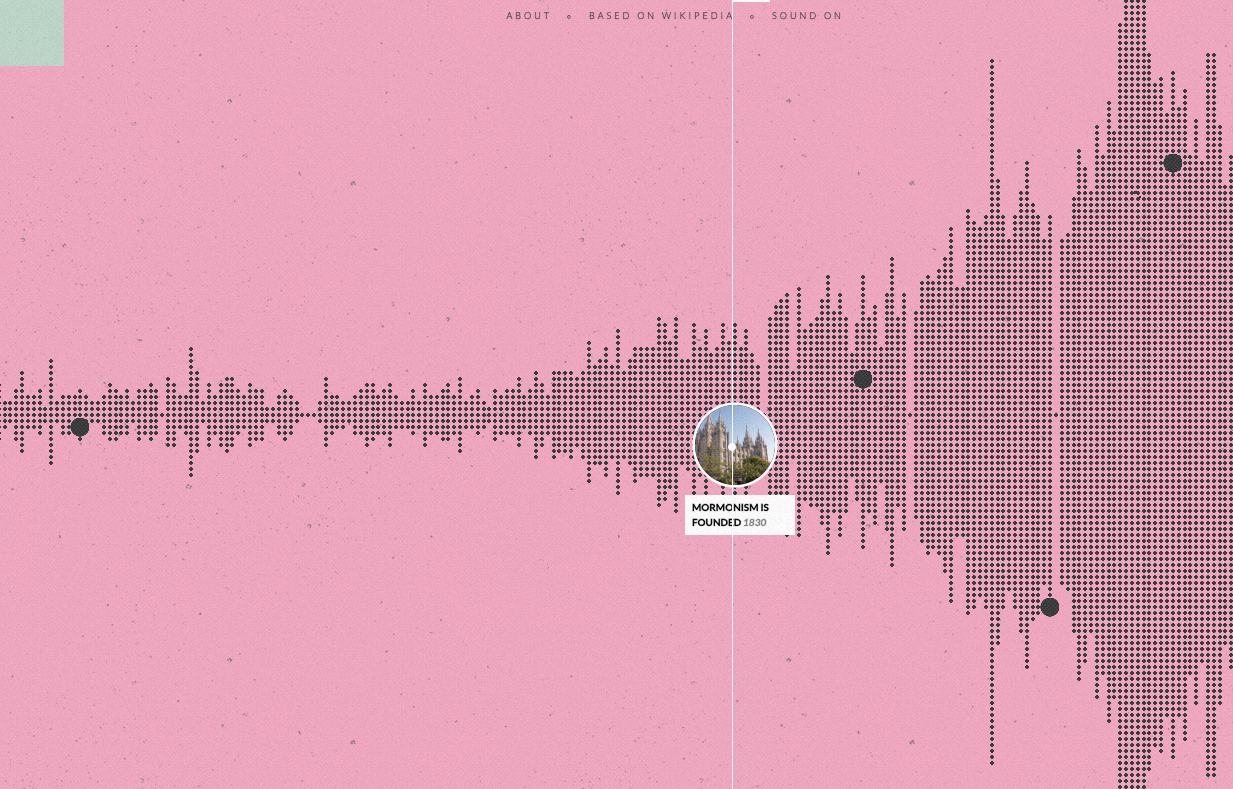
Histography
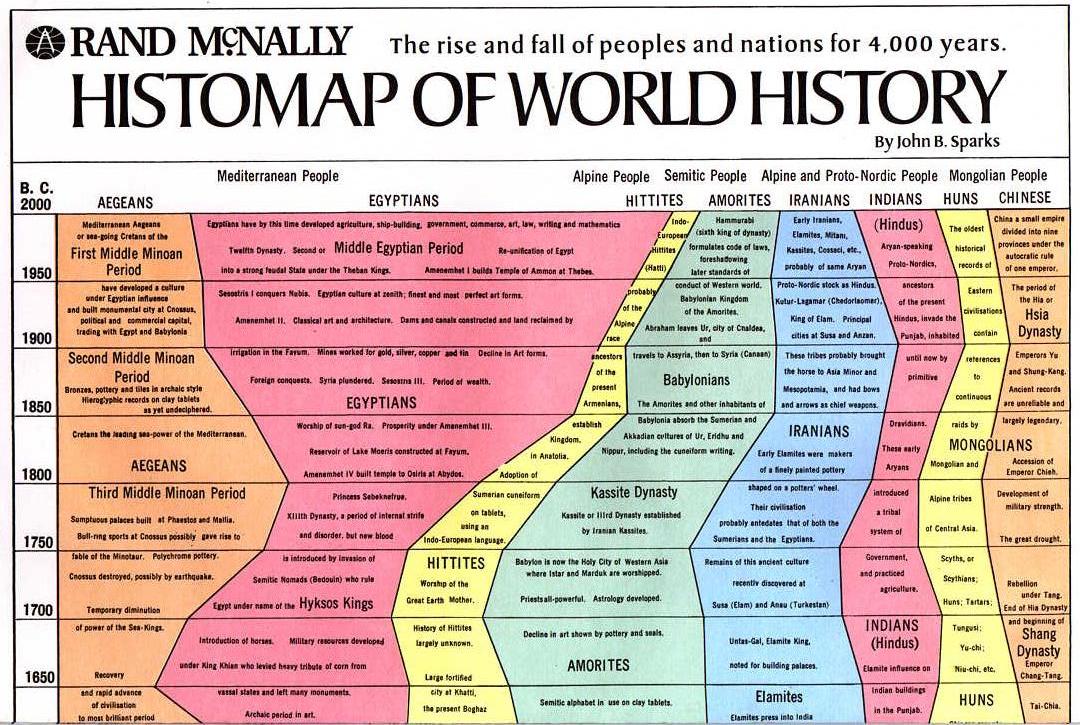
Histomap
John B. Sparks / Rand McNally
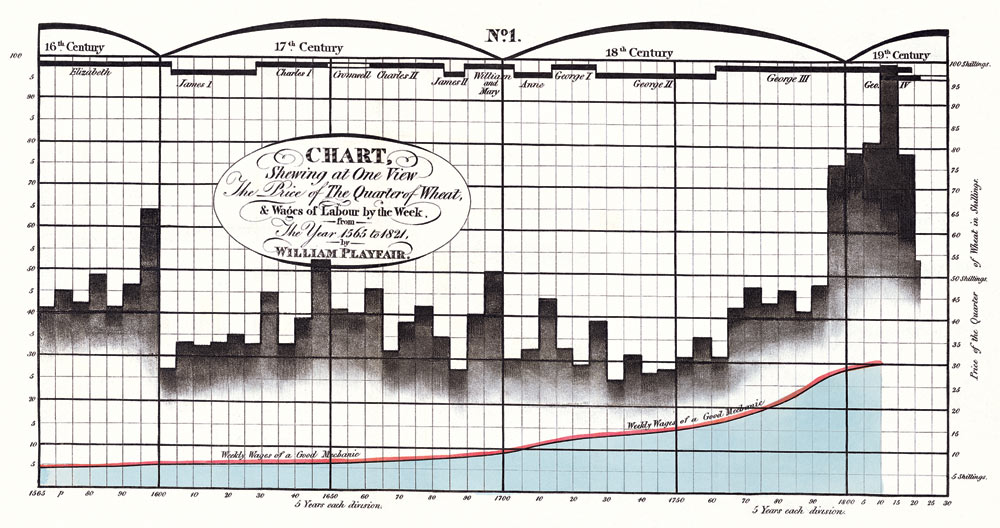
Historical Chart Examples
The Economist
History Flow
Martin Wattenberg & Fernanda Viégas
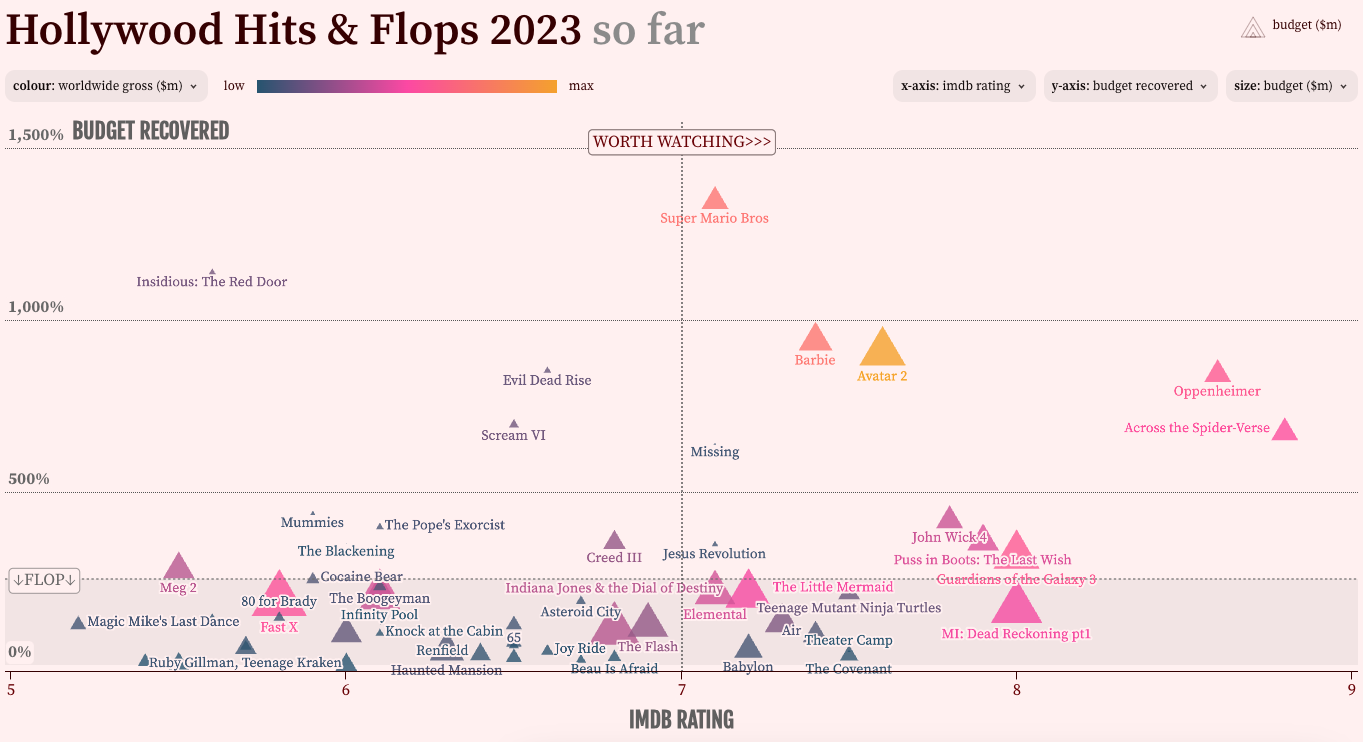
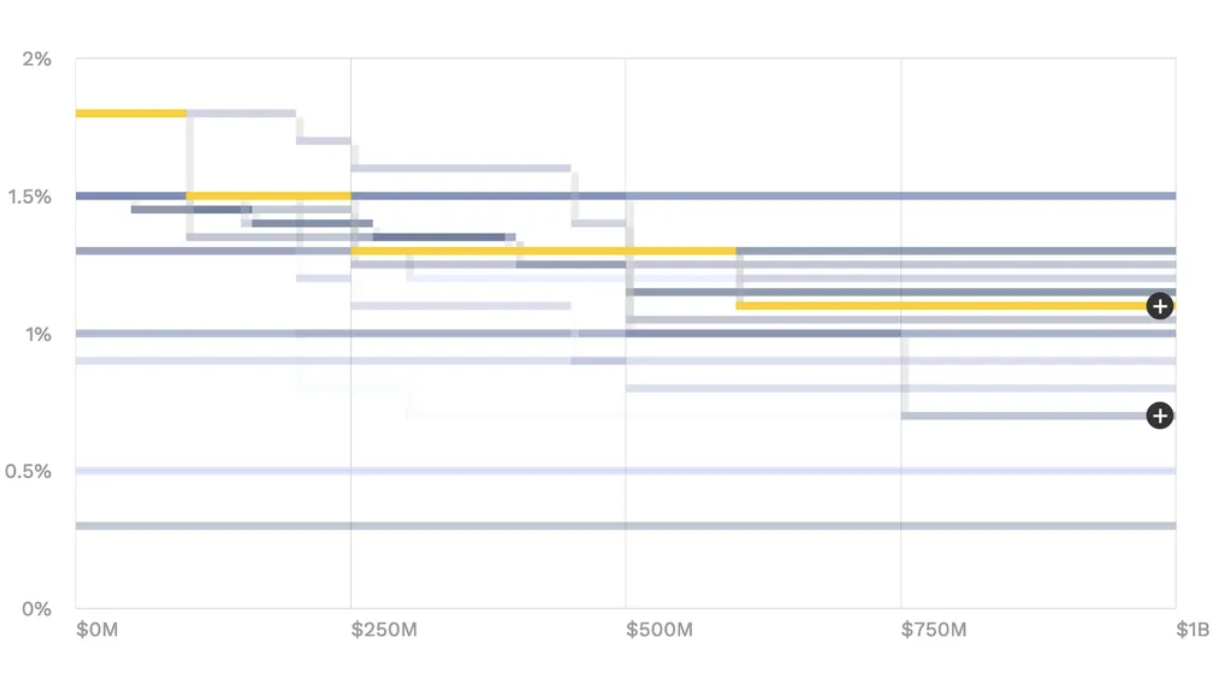
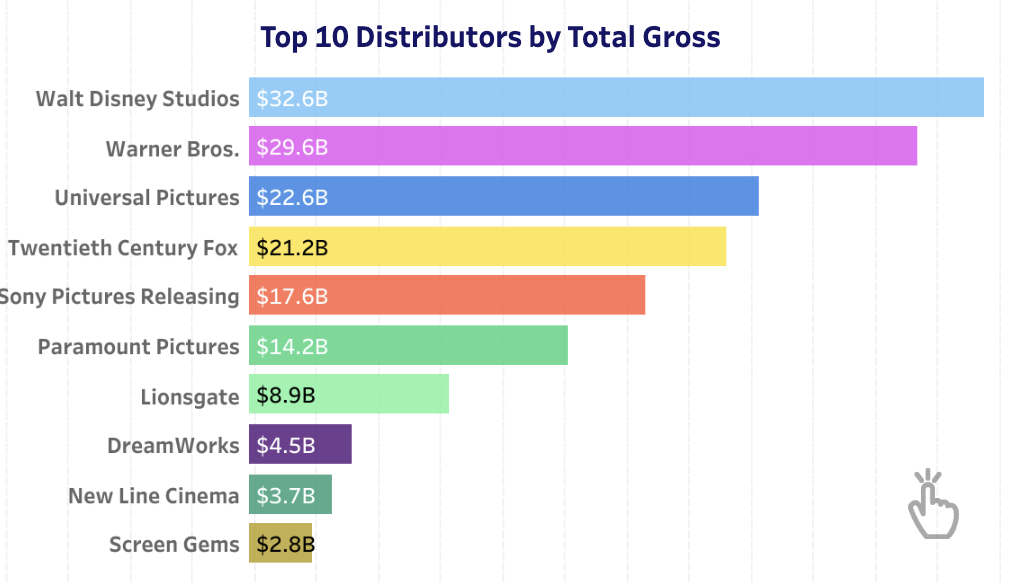
Hollywood Hits & Flops 2023
Information is Beautiful
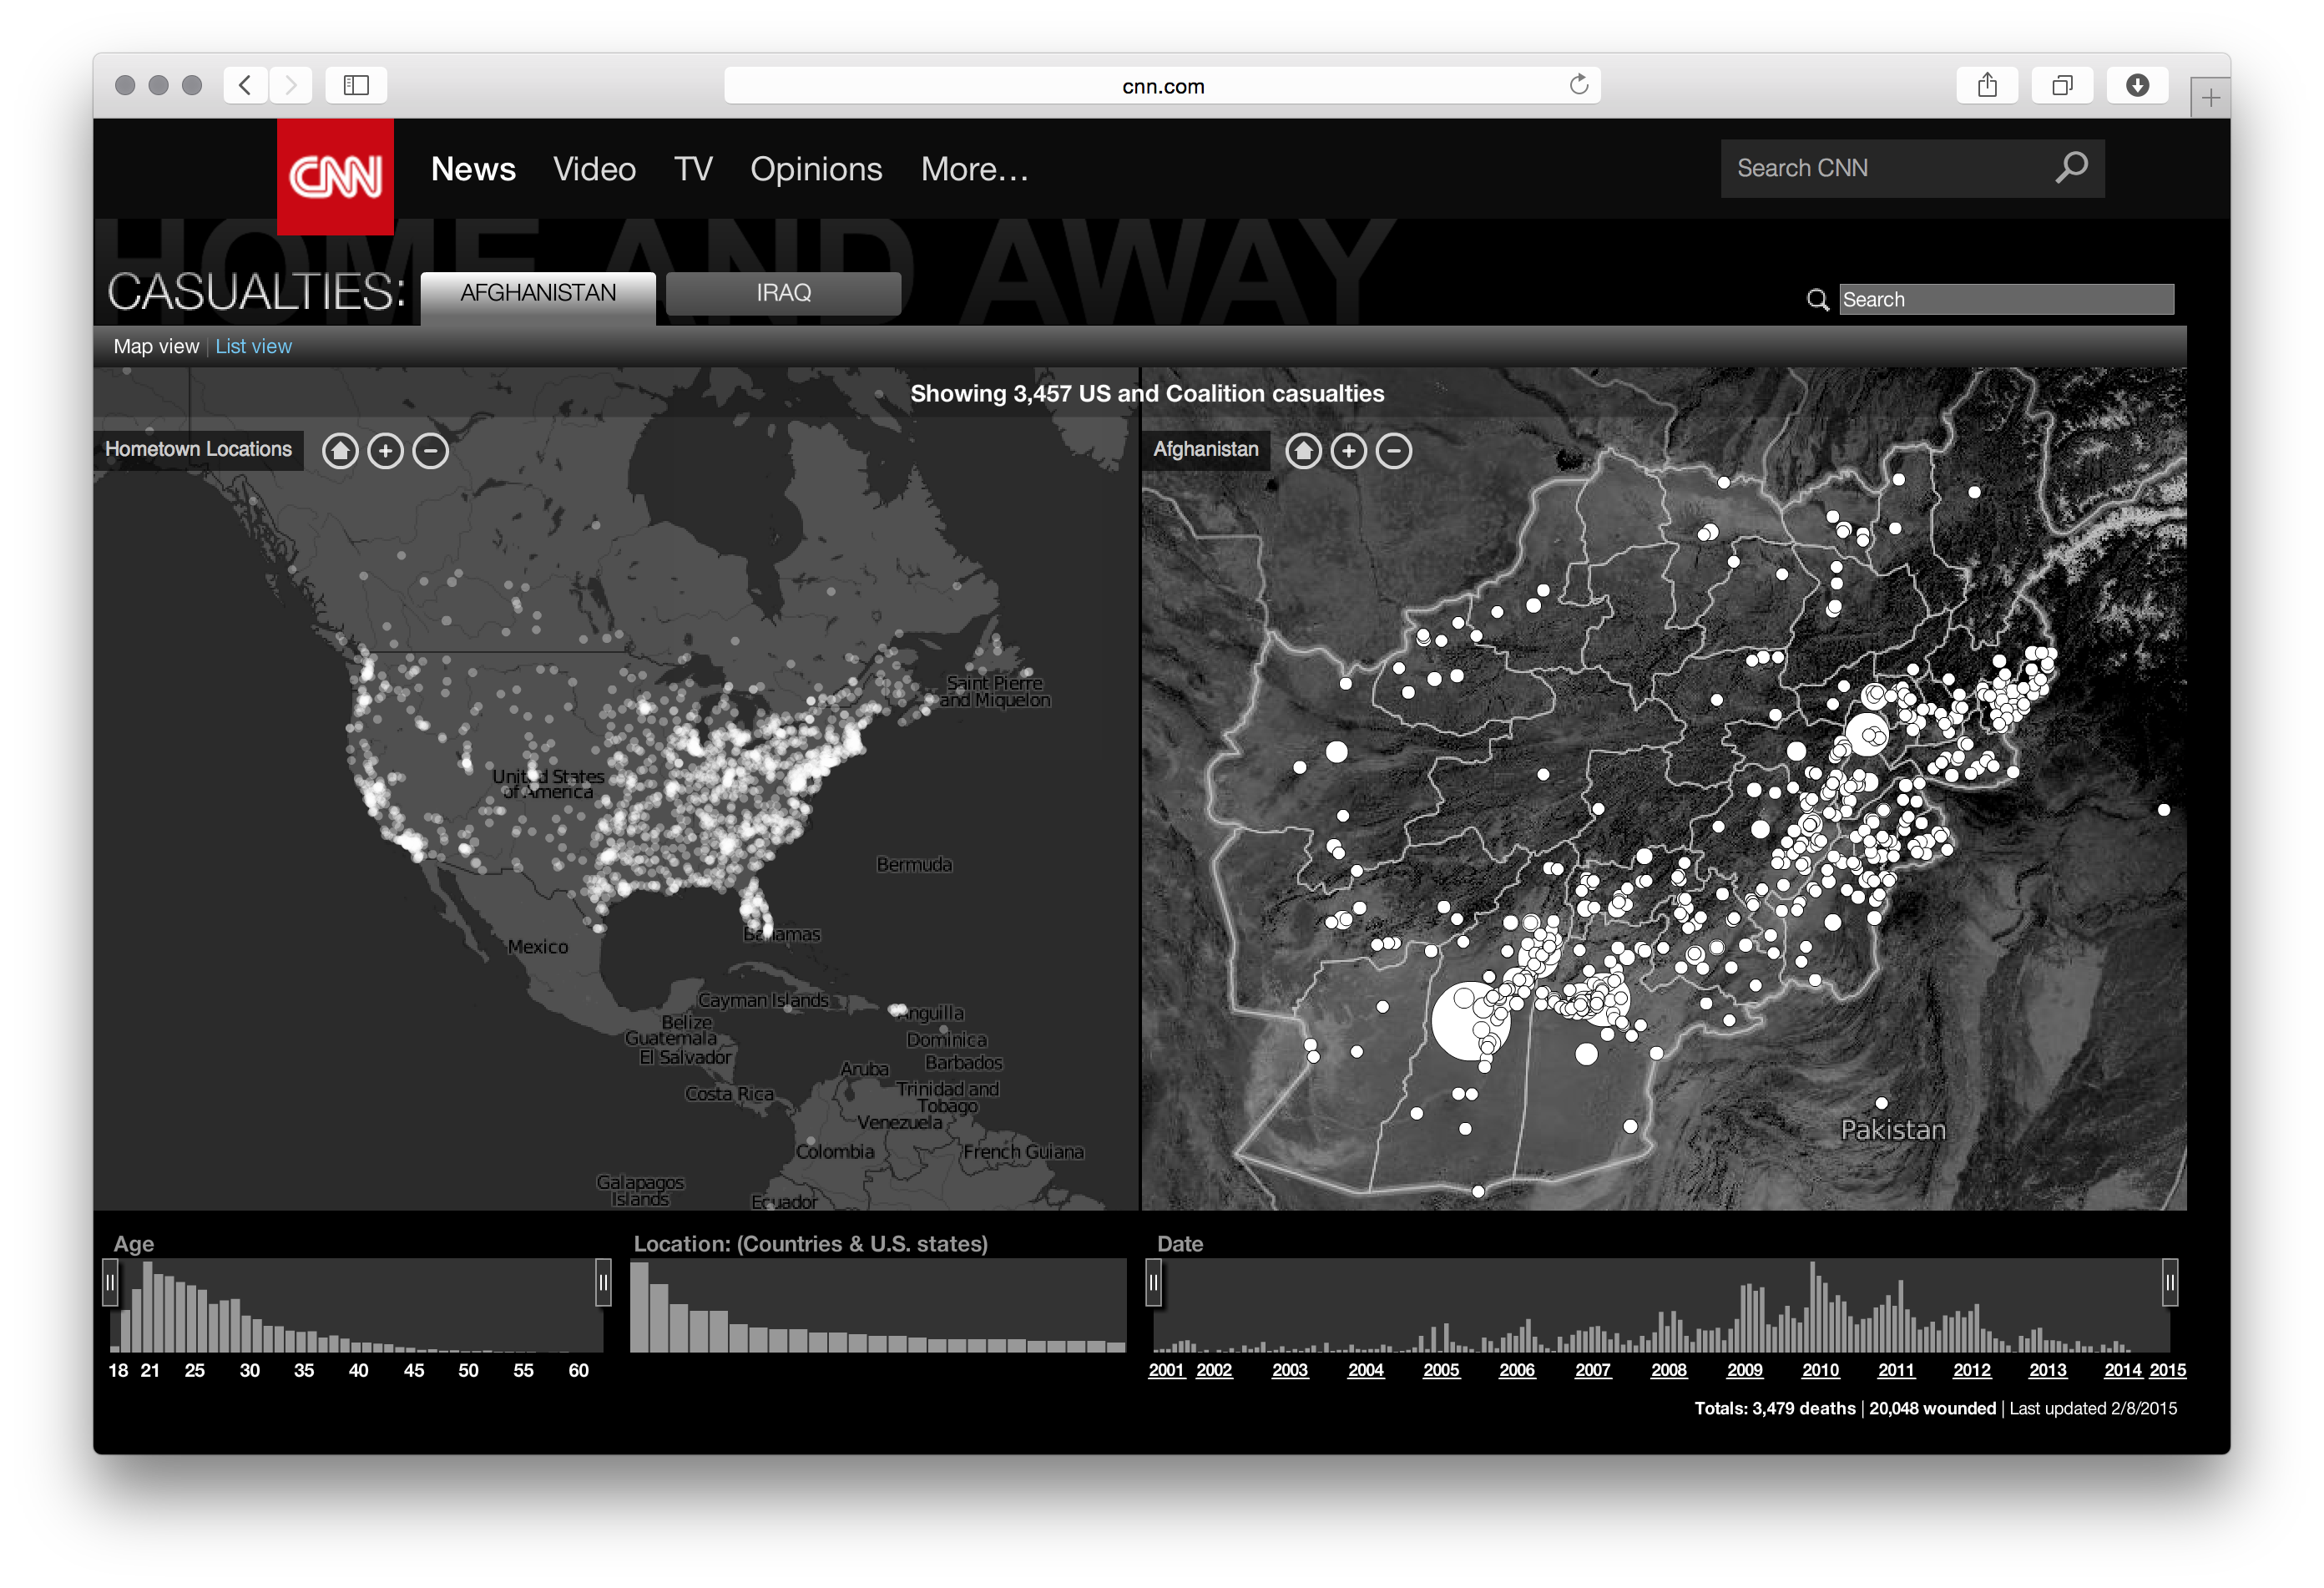
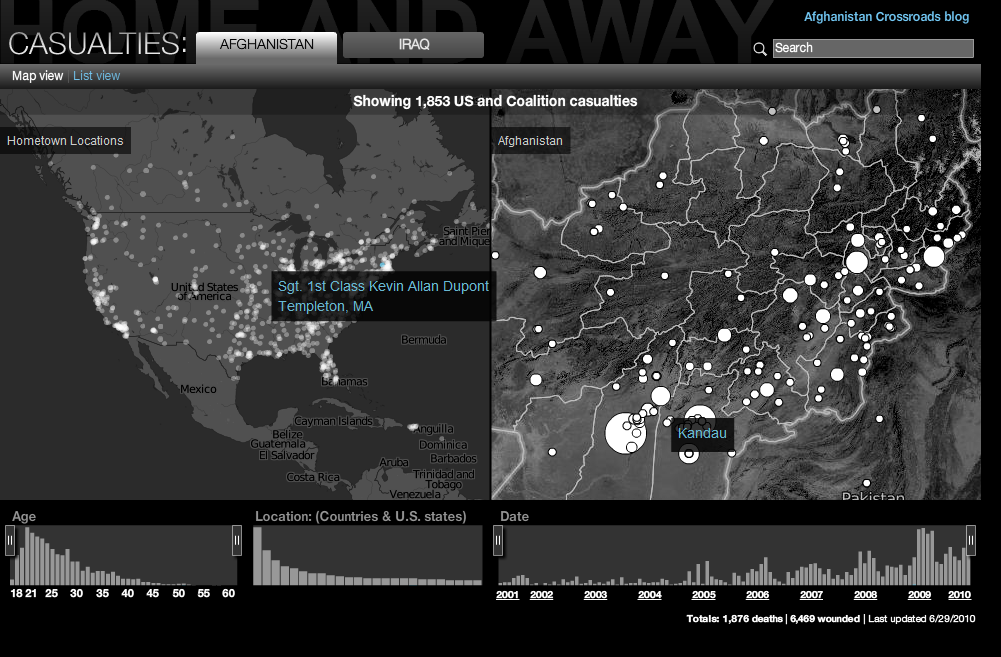
Home and Away
Stamen Design
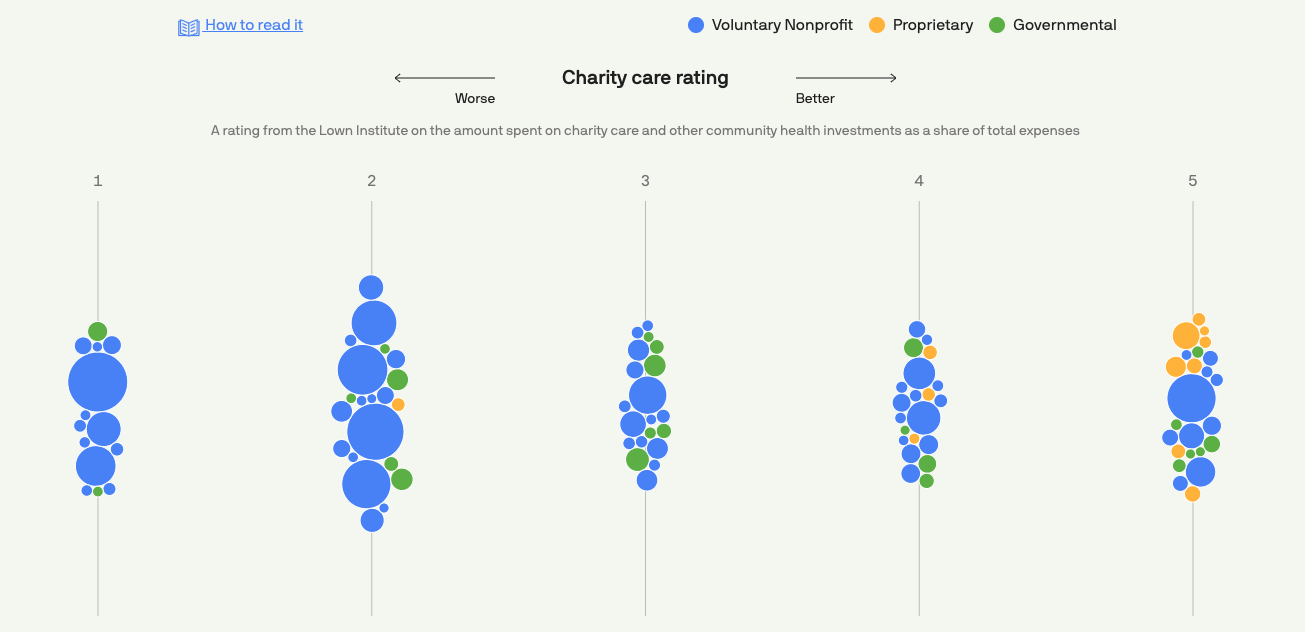
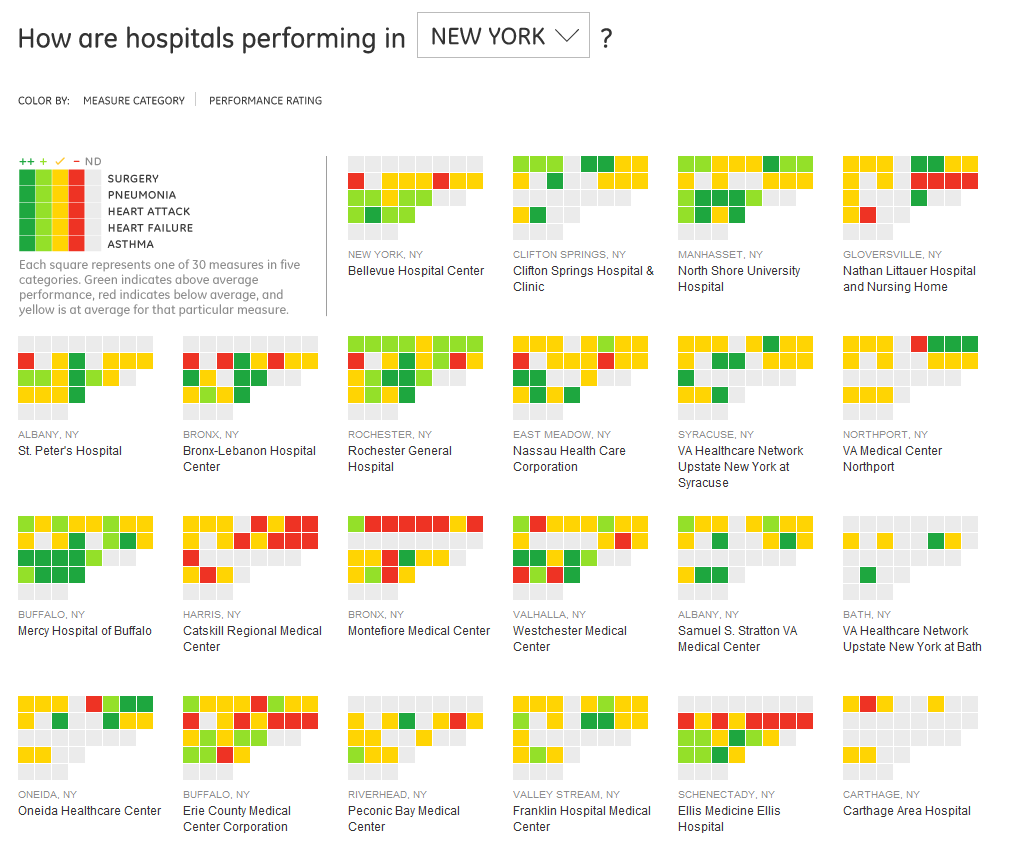
Hospital Billing
Axios
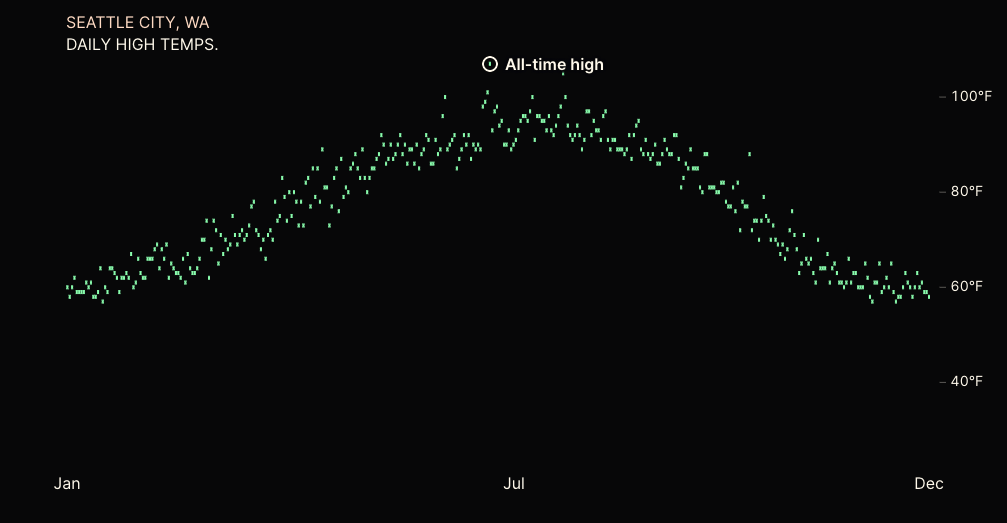
Hottest Cities Heat Map
Pudding
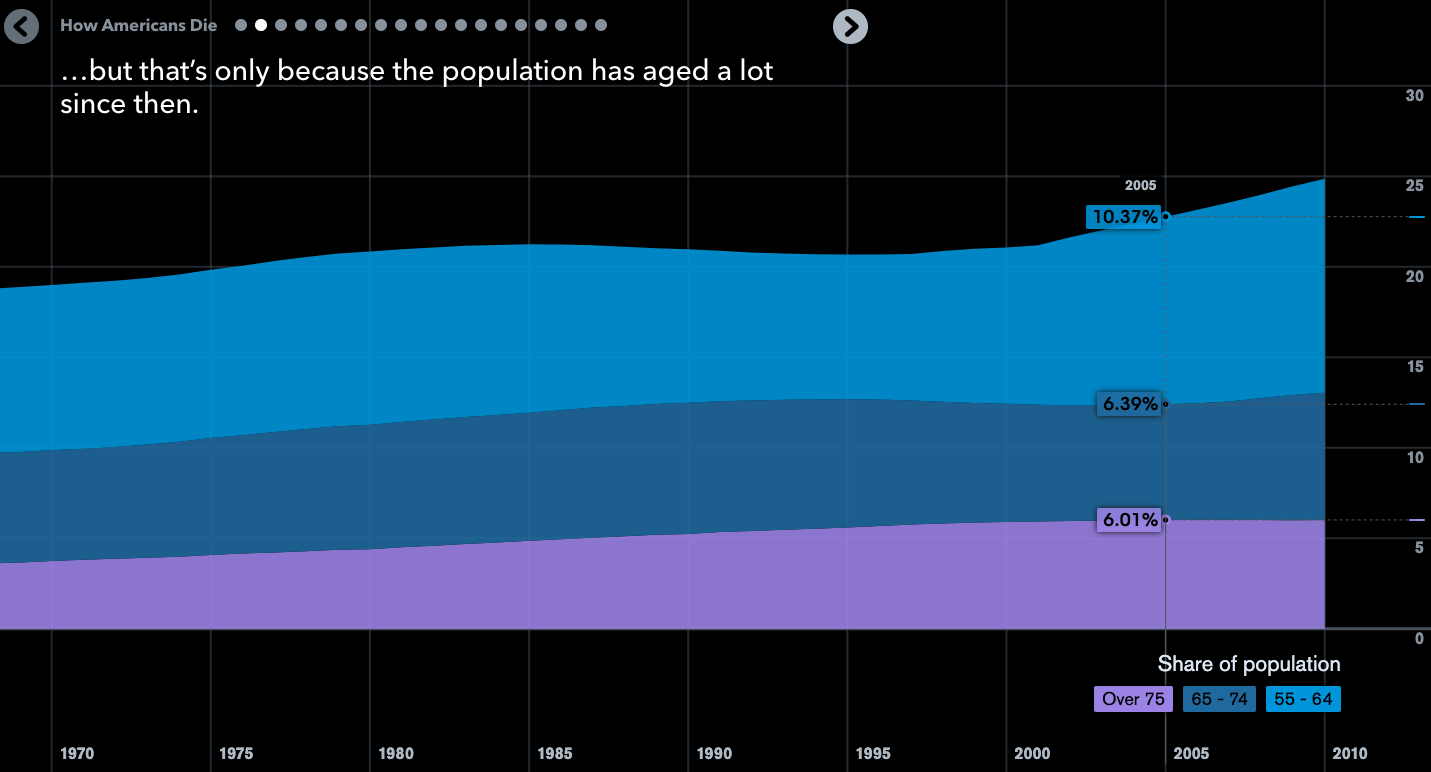
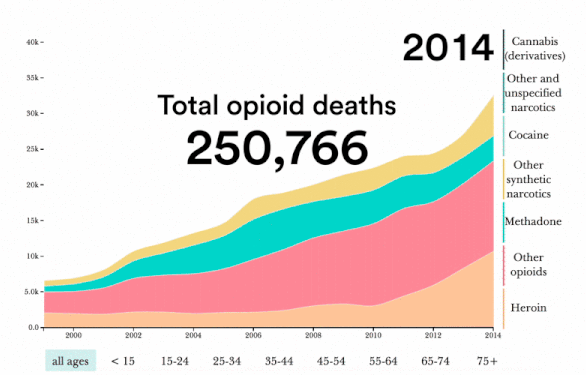
How Americans Die
Bloomberg
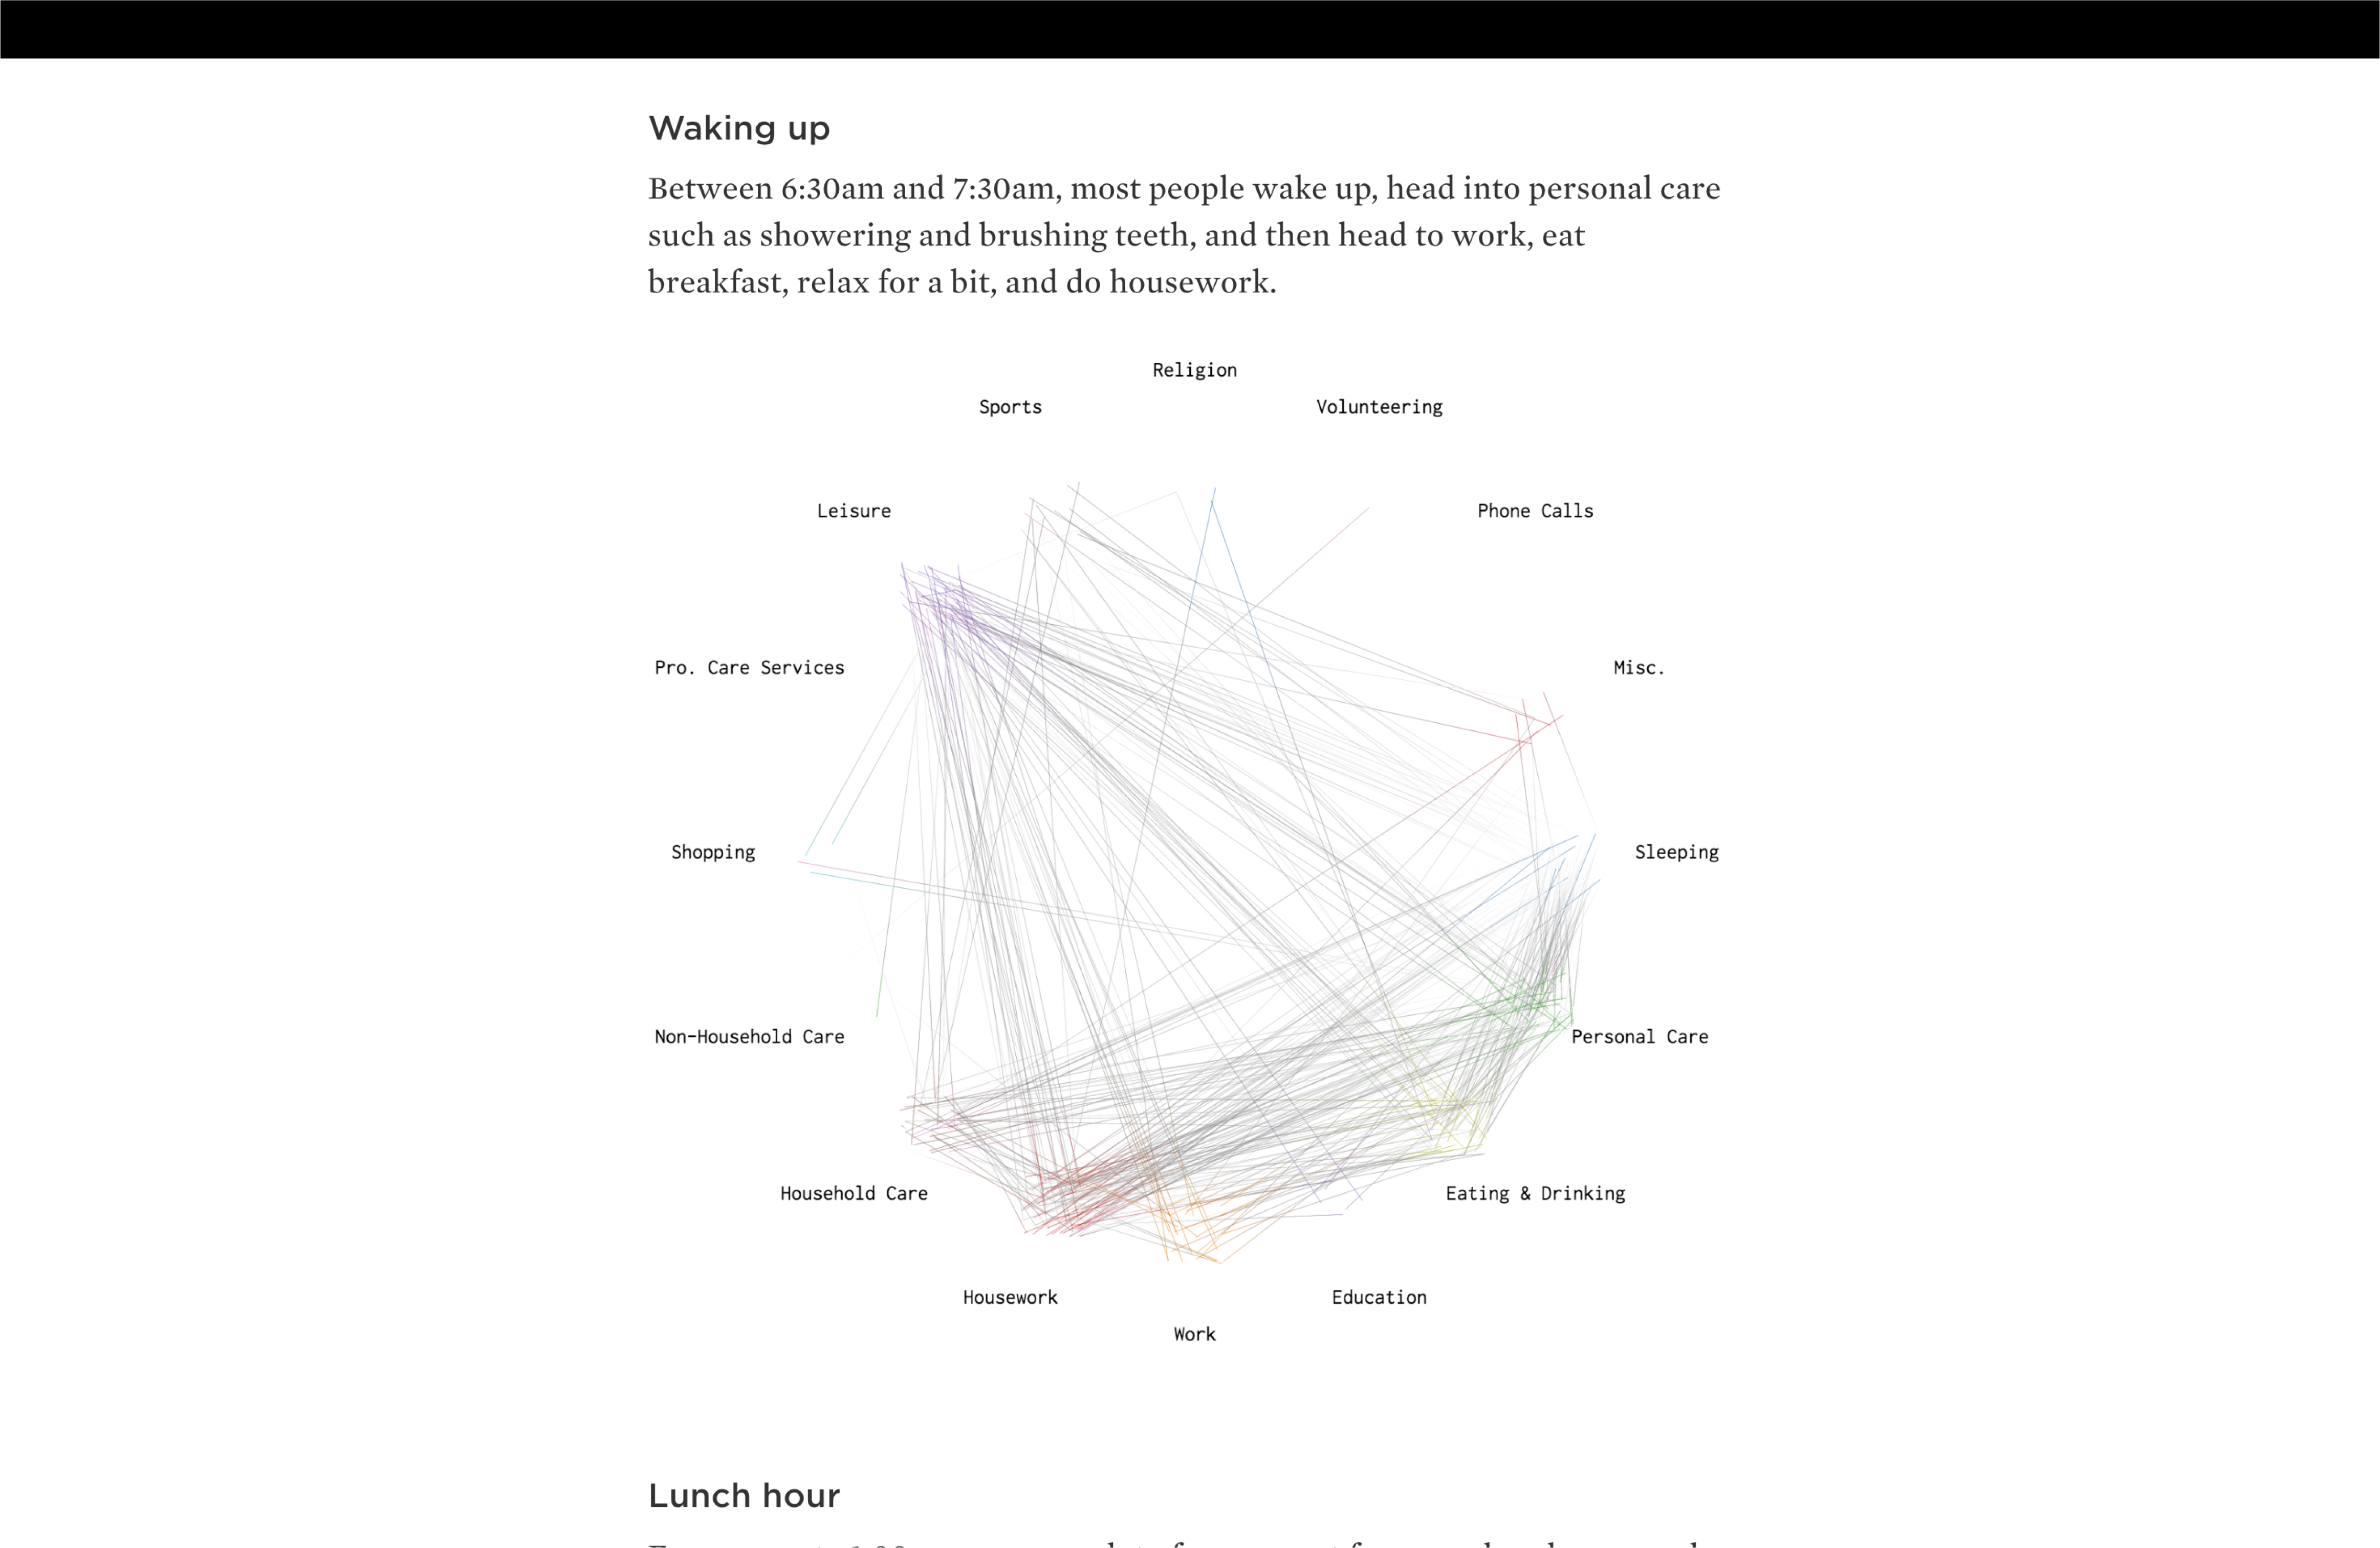
How Americans Spend Their Day
New York Times Graphics
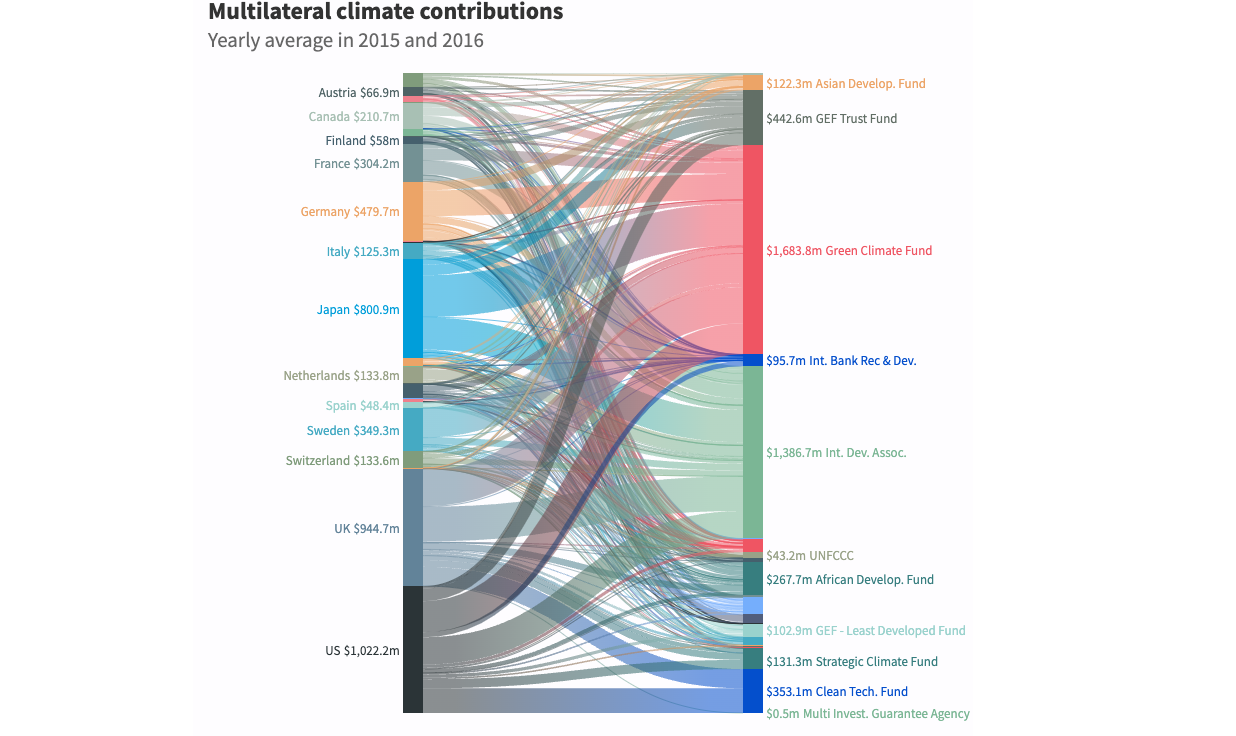
How Climate Finance ‘Flows’ Around the World
Carbon Brief
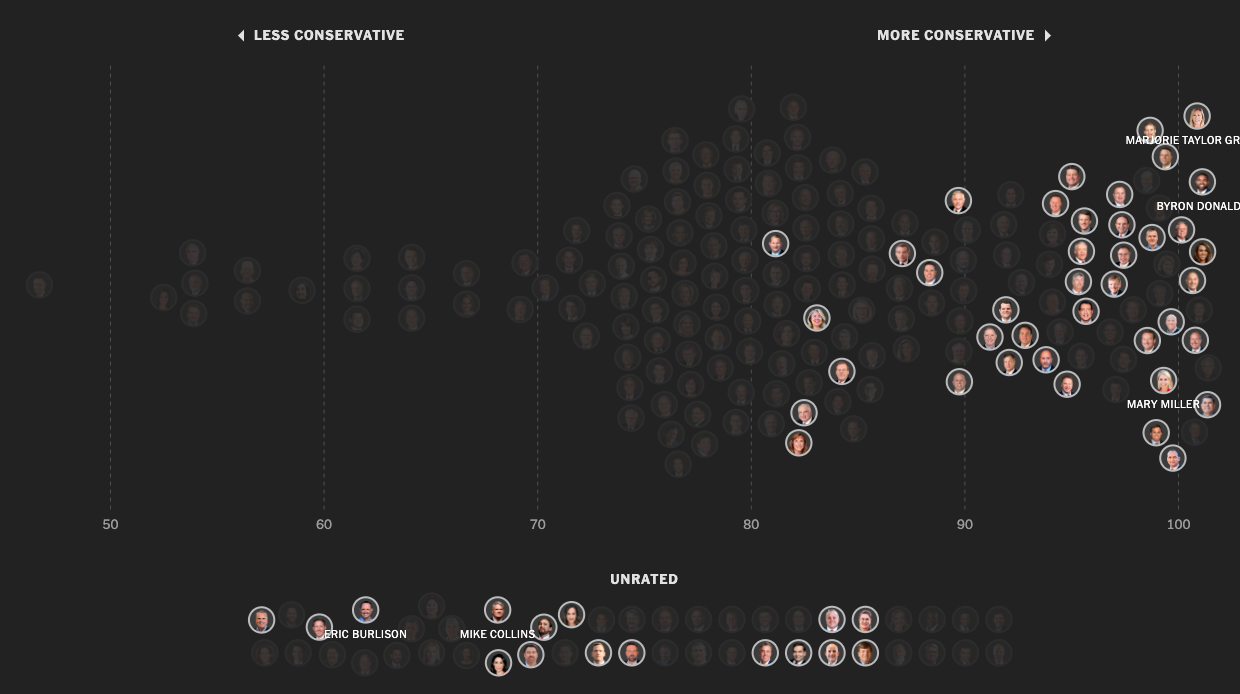
How Conservative a Supreme Court Nominee Can Trump Get through the Senate?
538
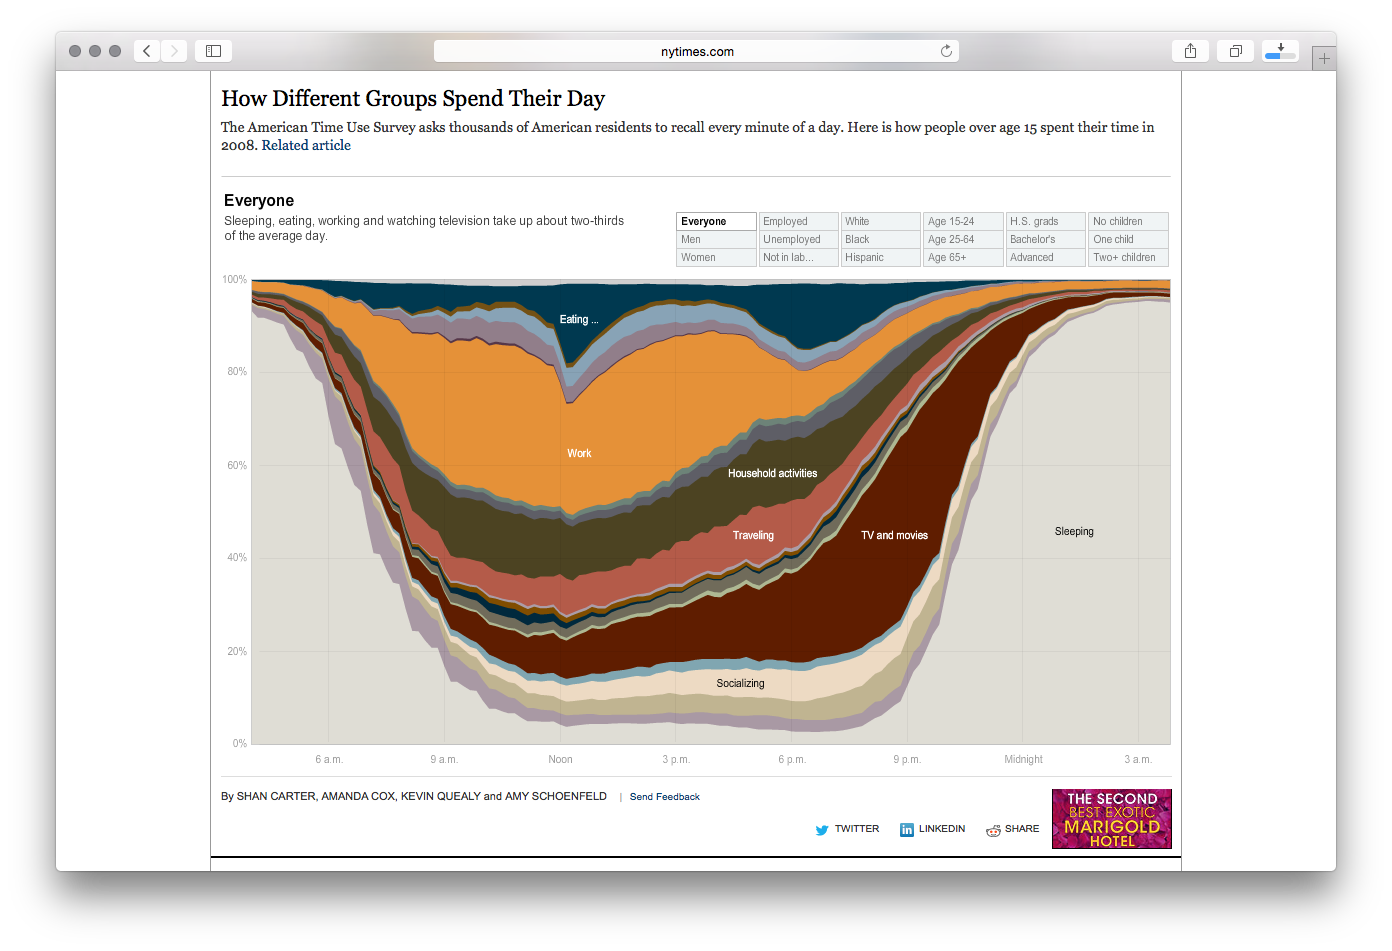
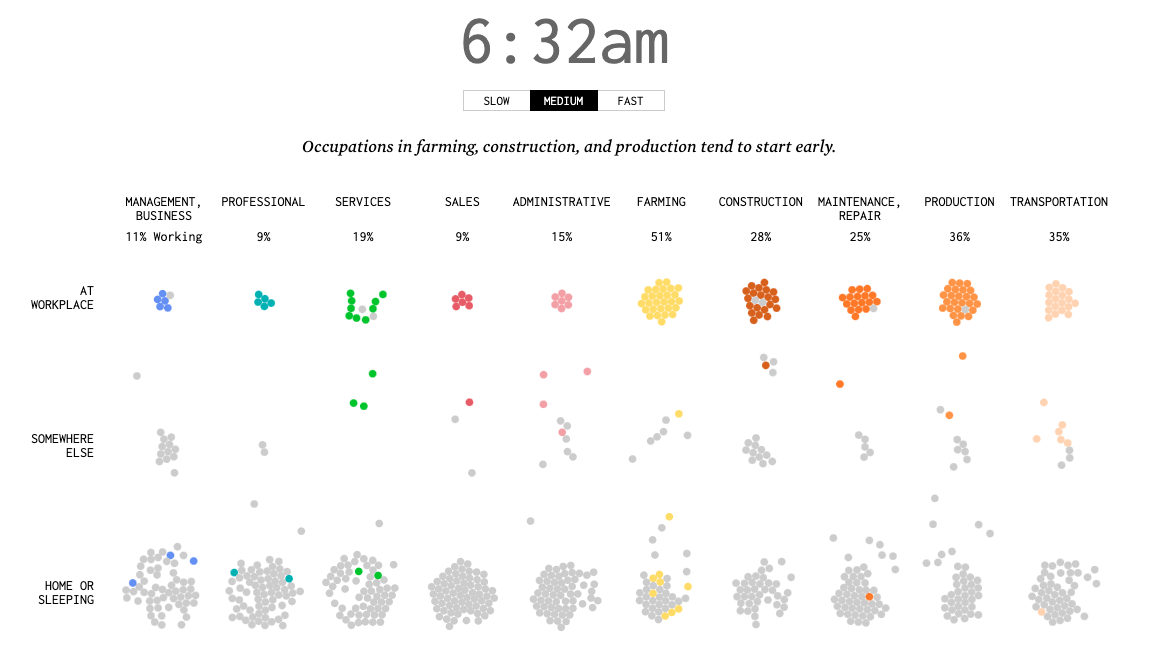
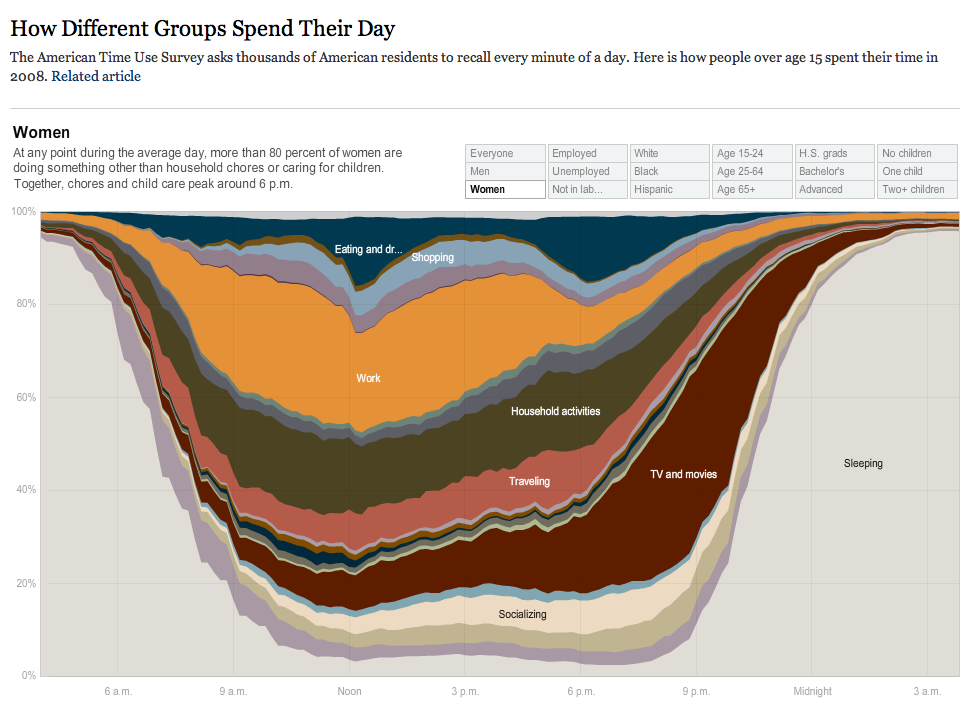
How Different Groups Spend Their Day
New York Times Graphics
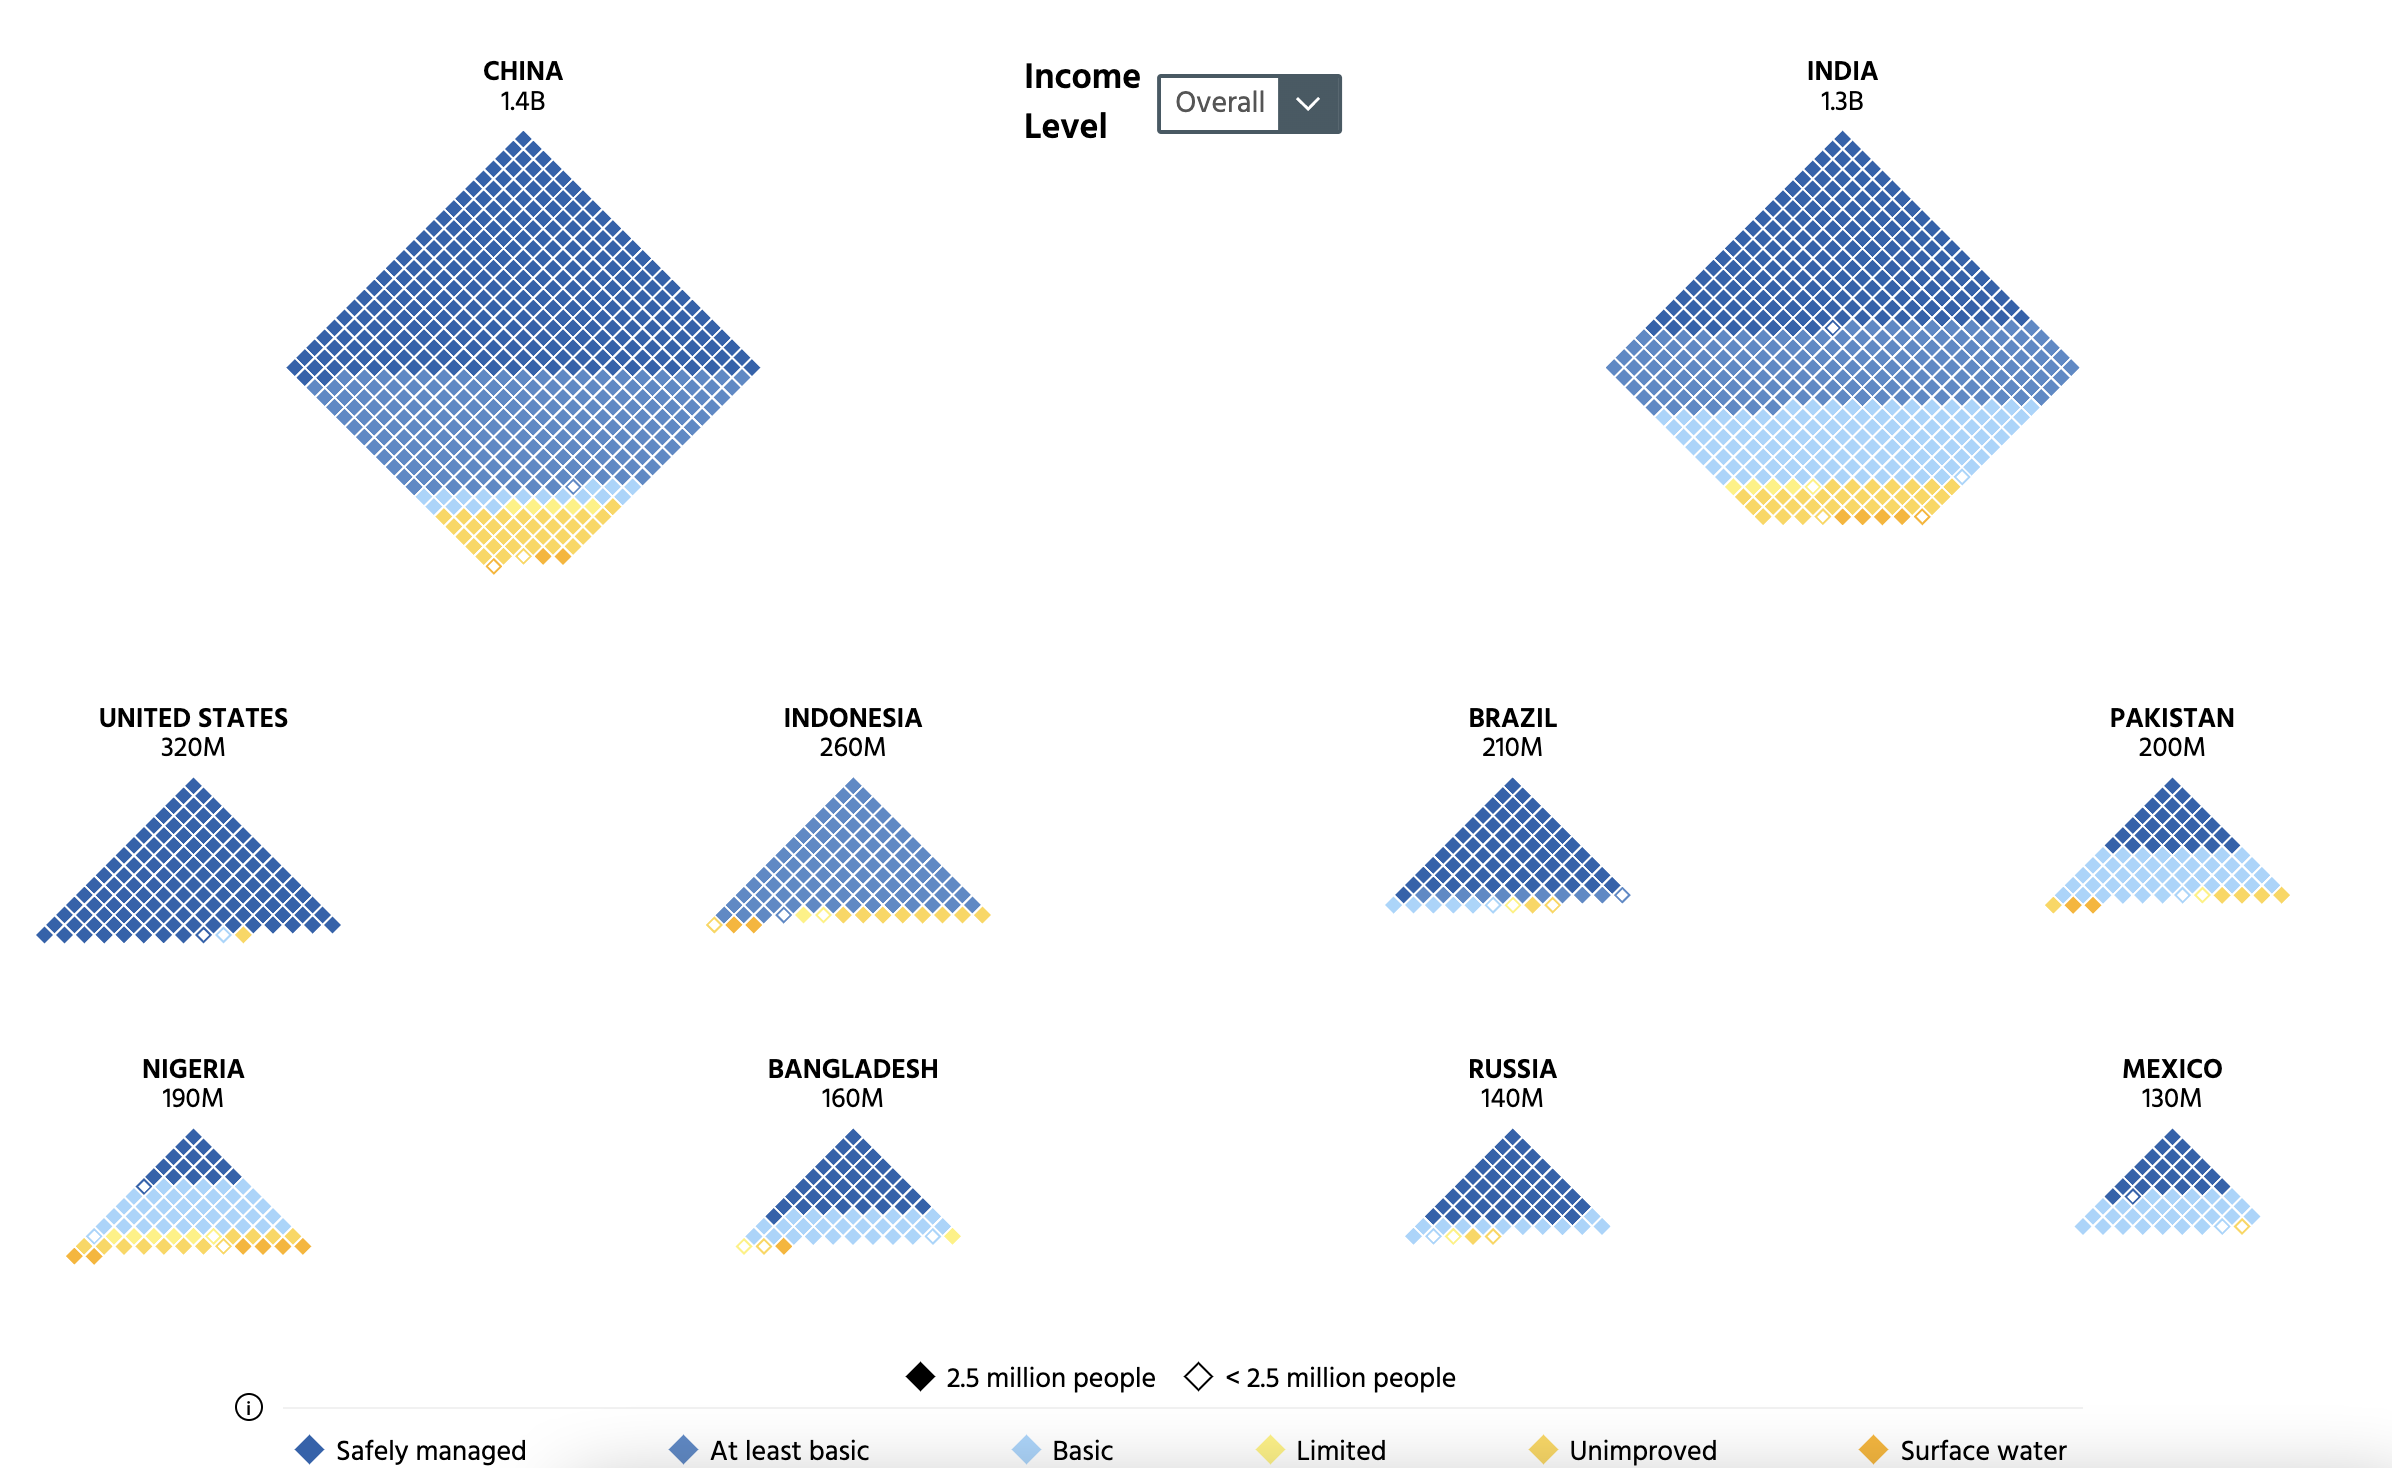
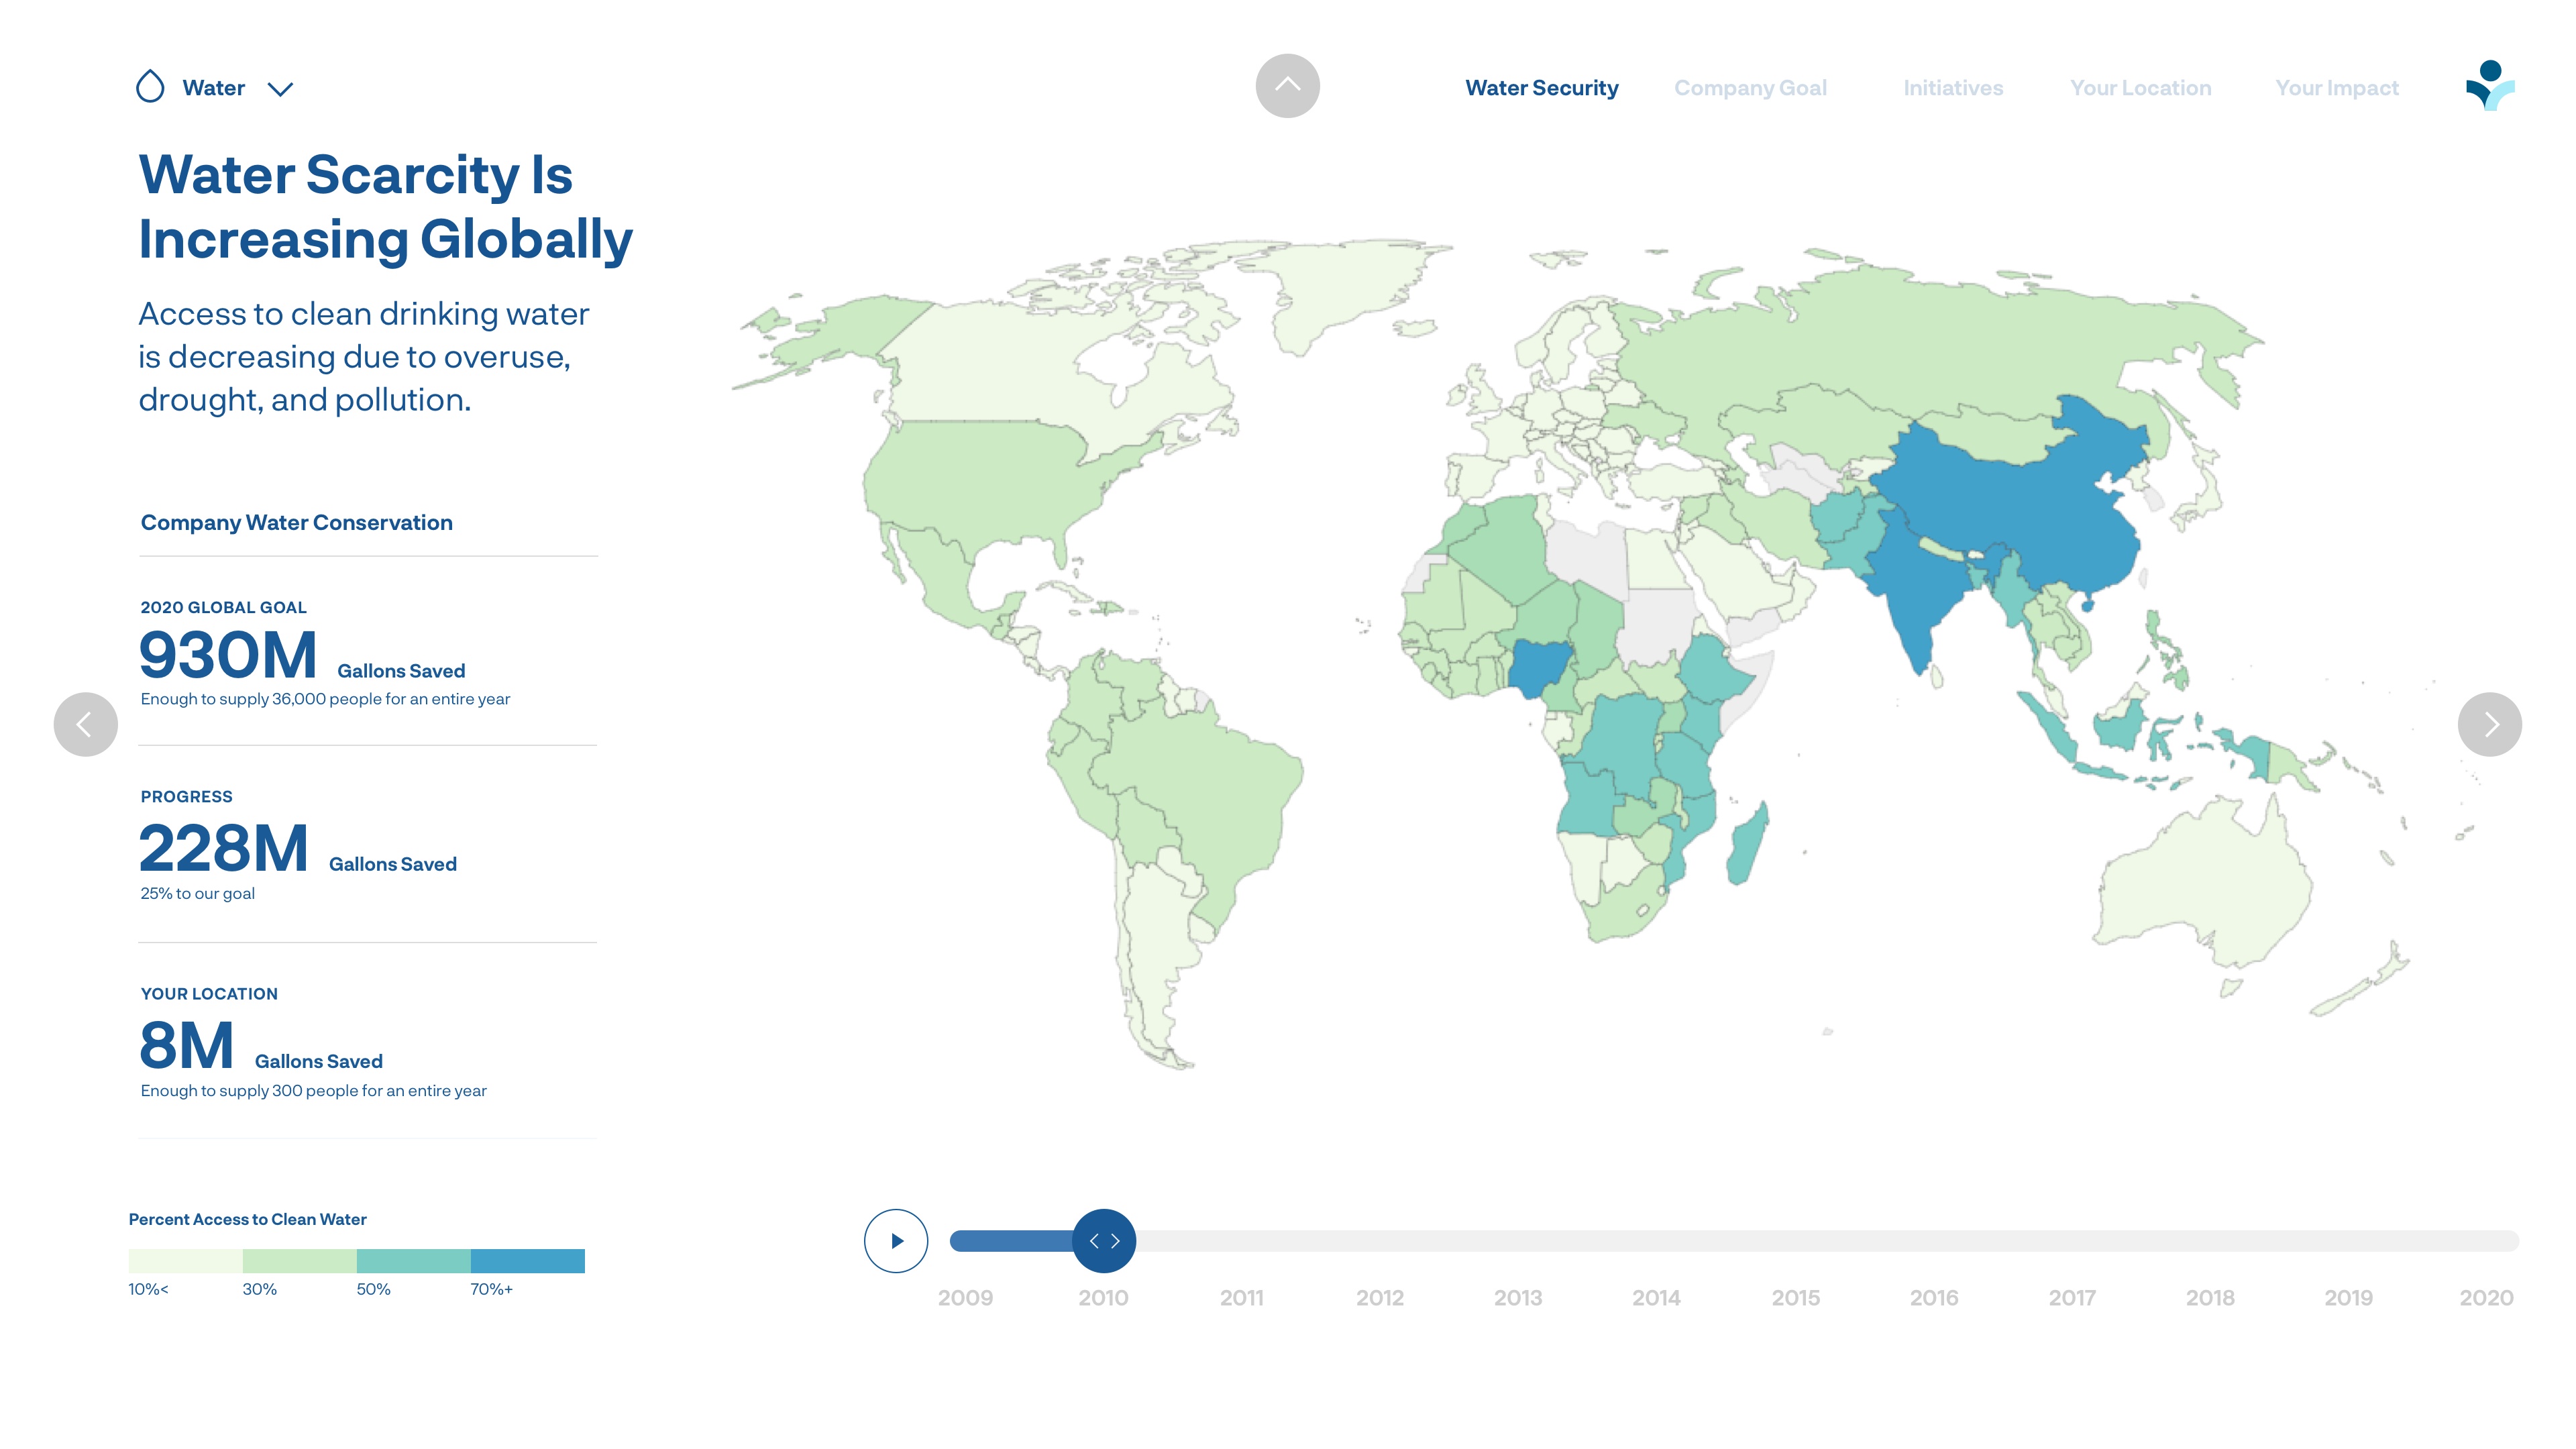
How Does Water Security Affect China’s Development?
How Does Your State Make Electricity
The New York Times
How Does Your Work Look Like in 2100?, Studio Dojo

How Electrifying Everything Became a Key Climate Solution - The New York Times
The New York Times
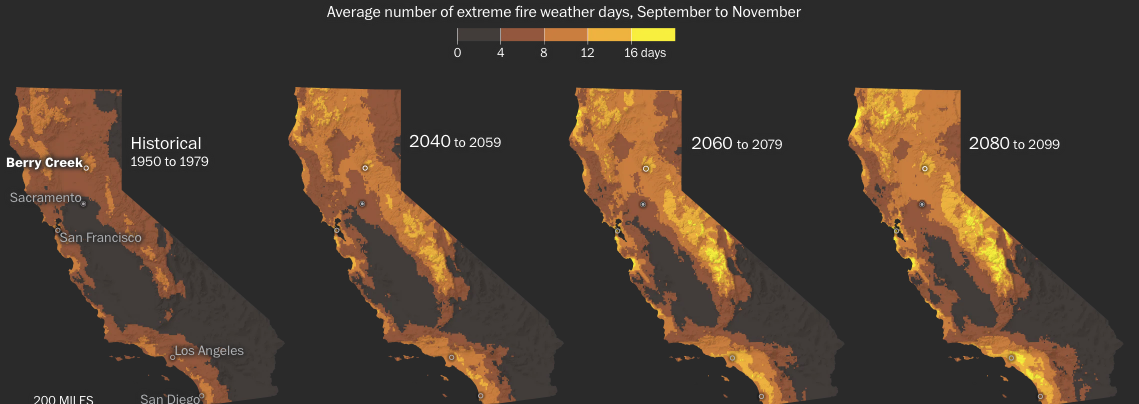
How Escalating Climate Change Fuels California’s Infernos, Washington Post
Washington Post
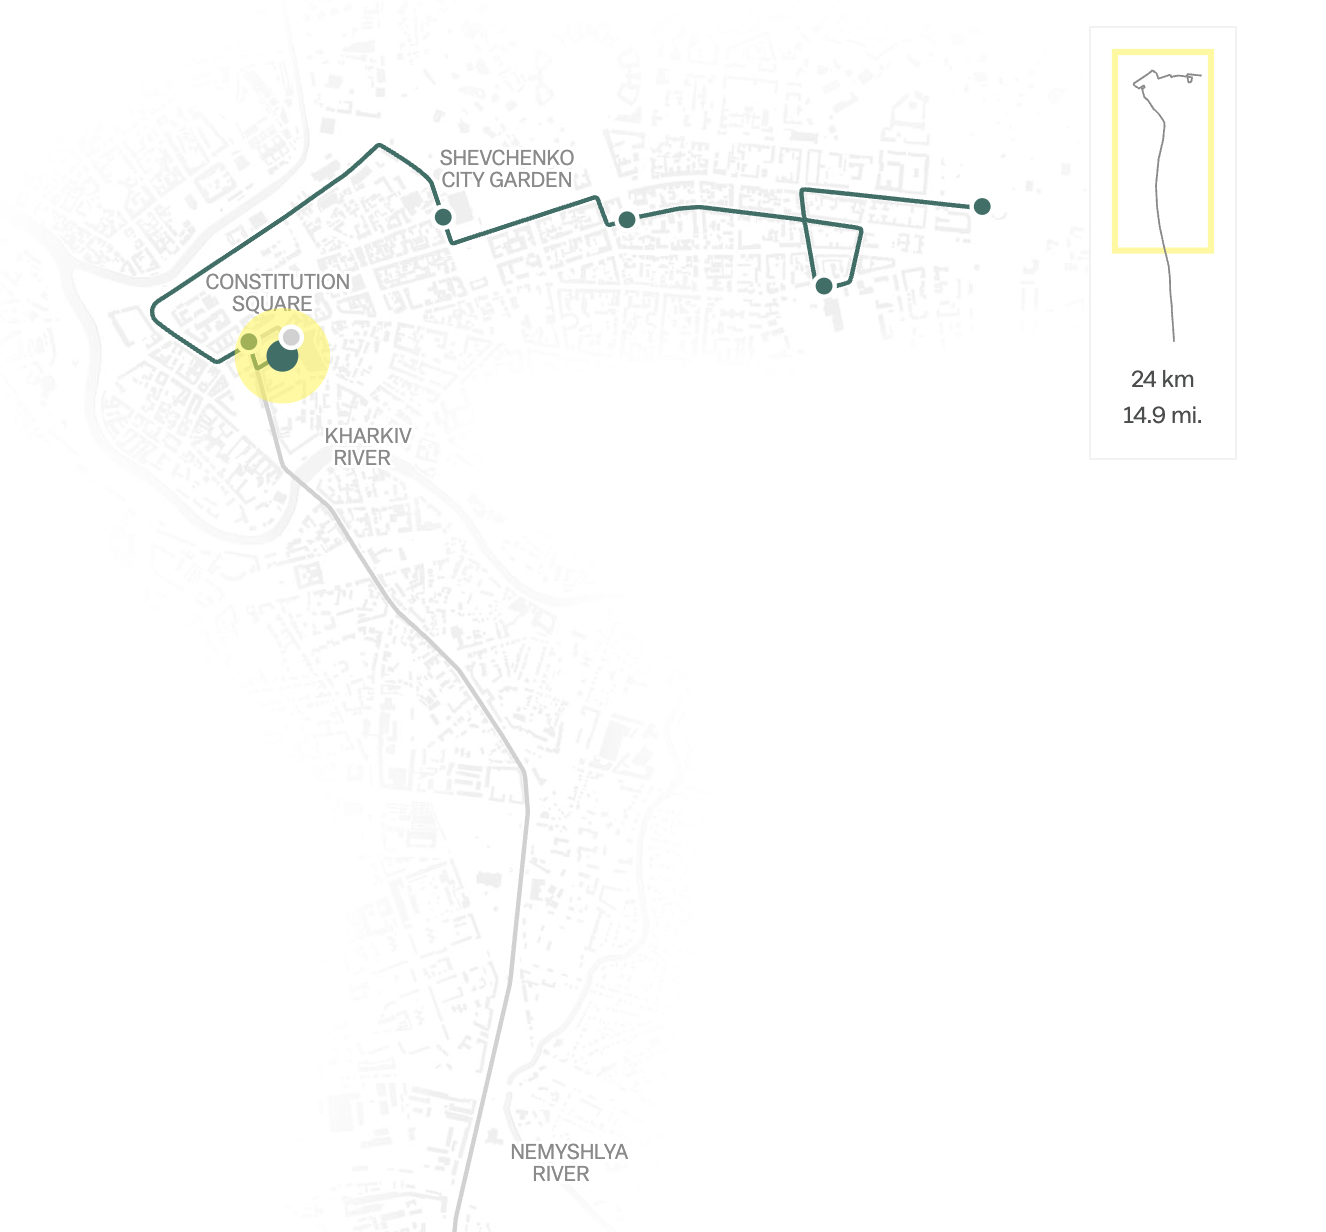
How Russia’s Invasion Transformed One Ukrainian City
Vox
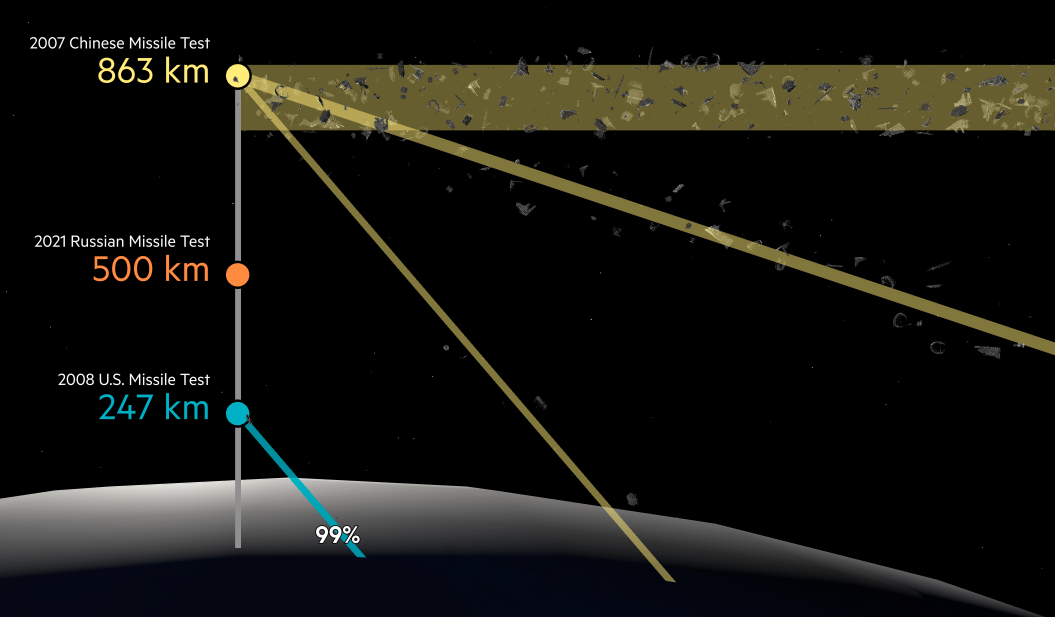
How Space Debris Threatens Modern Life, Financial Times
Financial Times
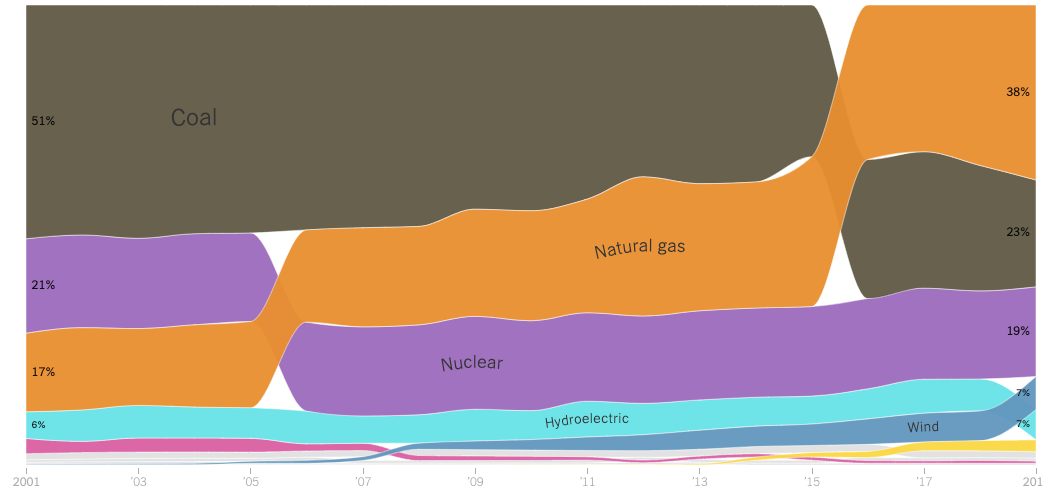
How the UK Transformed Its Electricity Supply in Just a Decade
Carbon Brief

How to Tune a Guitar

Human Behind Every Number
Human Terrain
Pudding
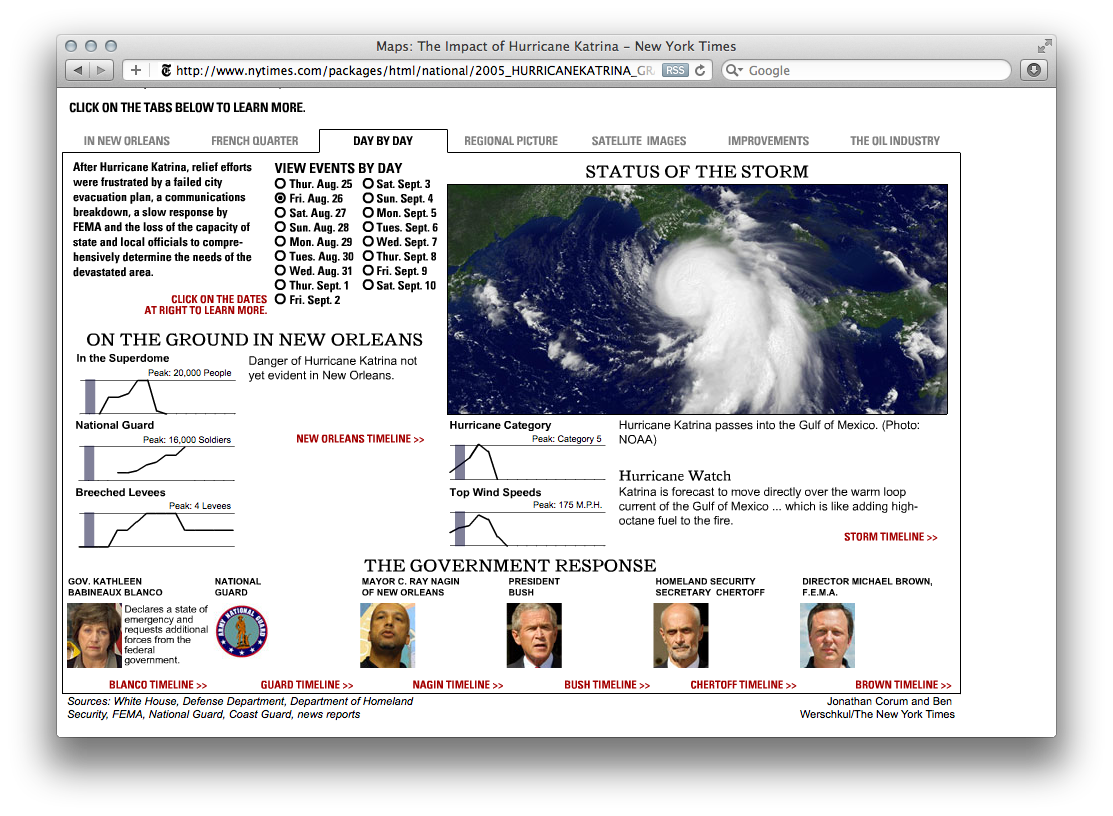
Hurricane Katrina
New York Times Graphics
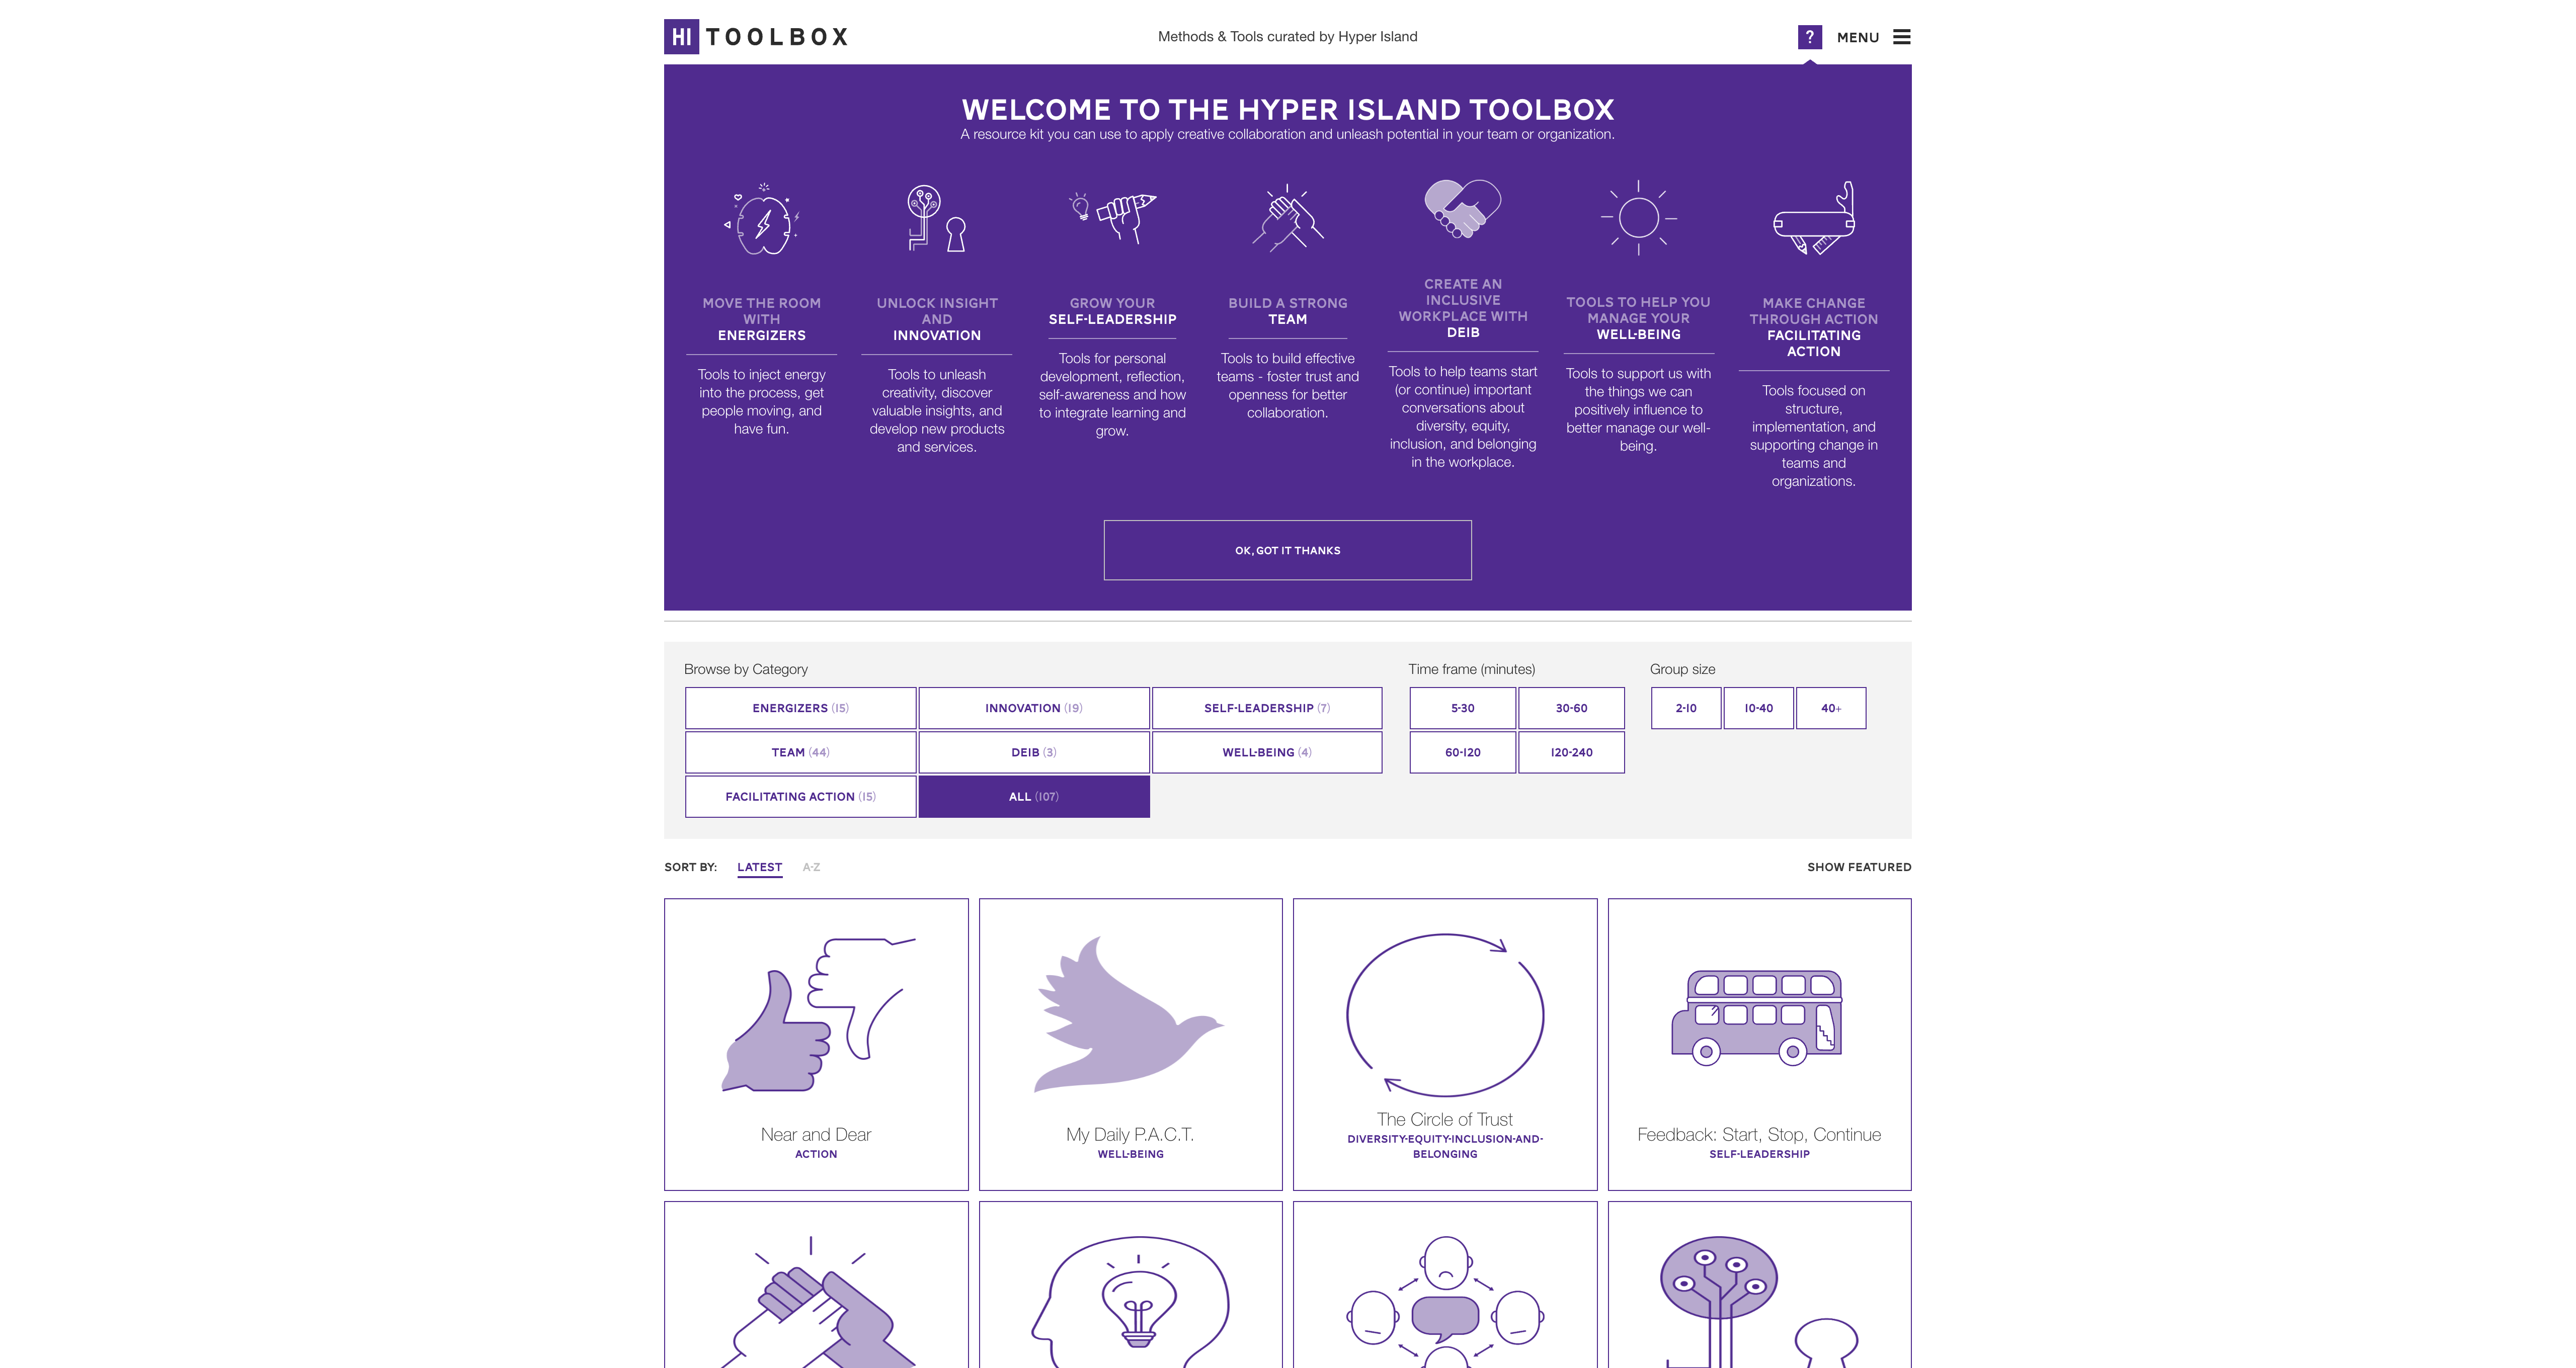
Hyper Island Toolbox
i5 Playbook
PRME
ICA Landing Page
ICA Philadelphia

IHME Component Library
Schema Design
IHME COVID-19 Website
Schema Design
IHME Logo
Schema Design
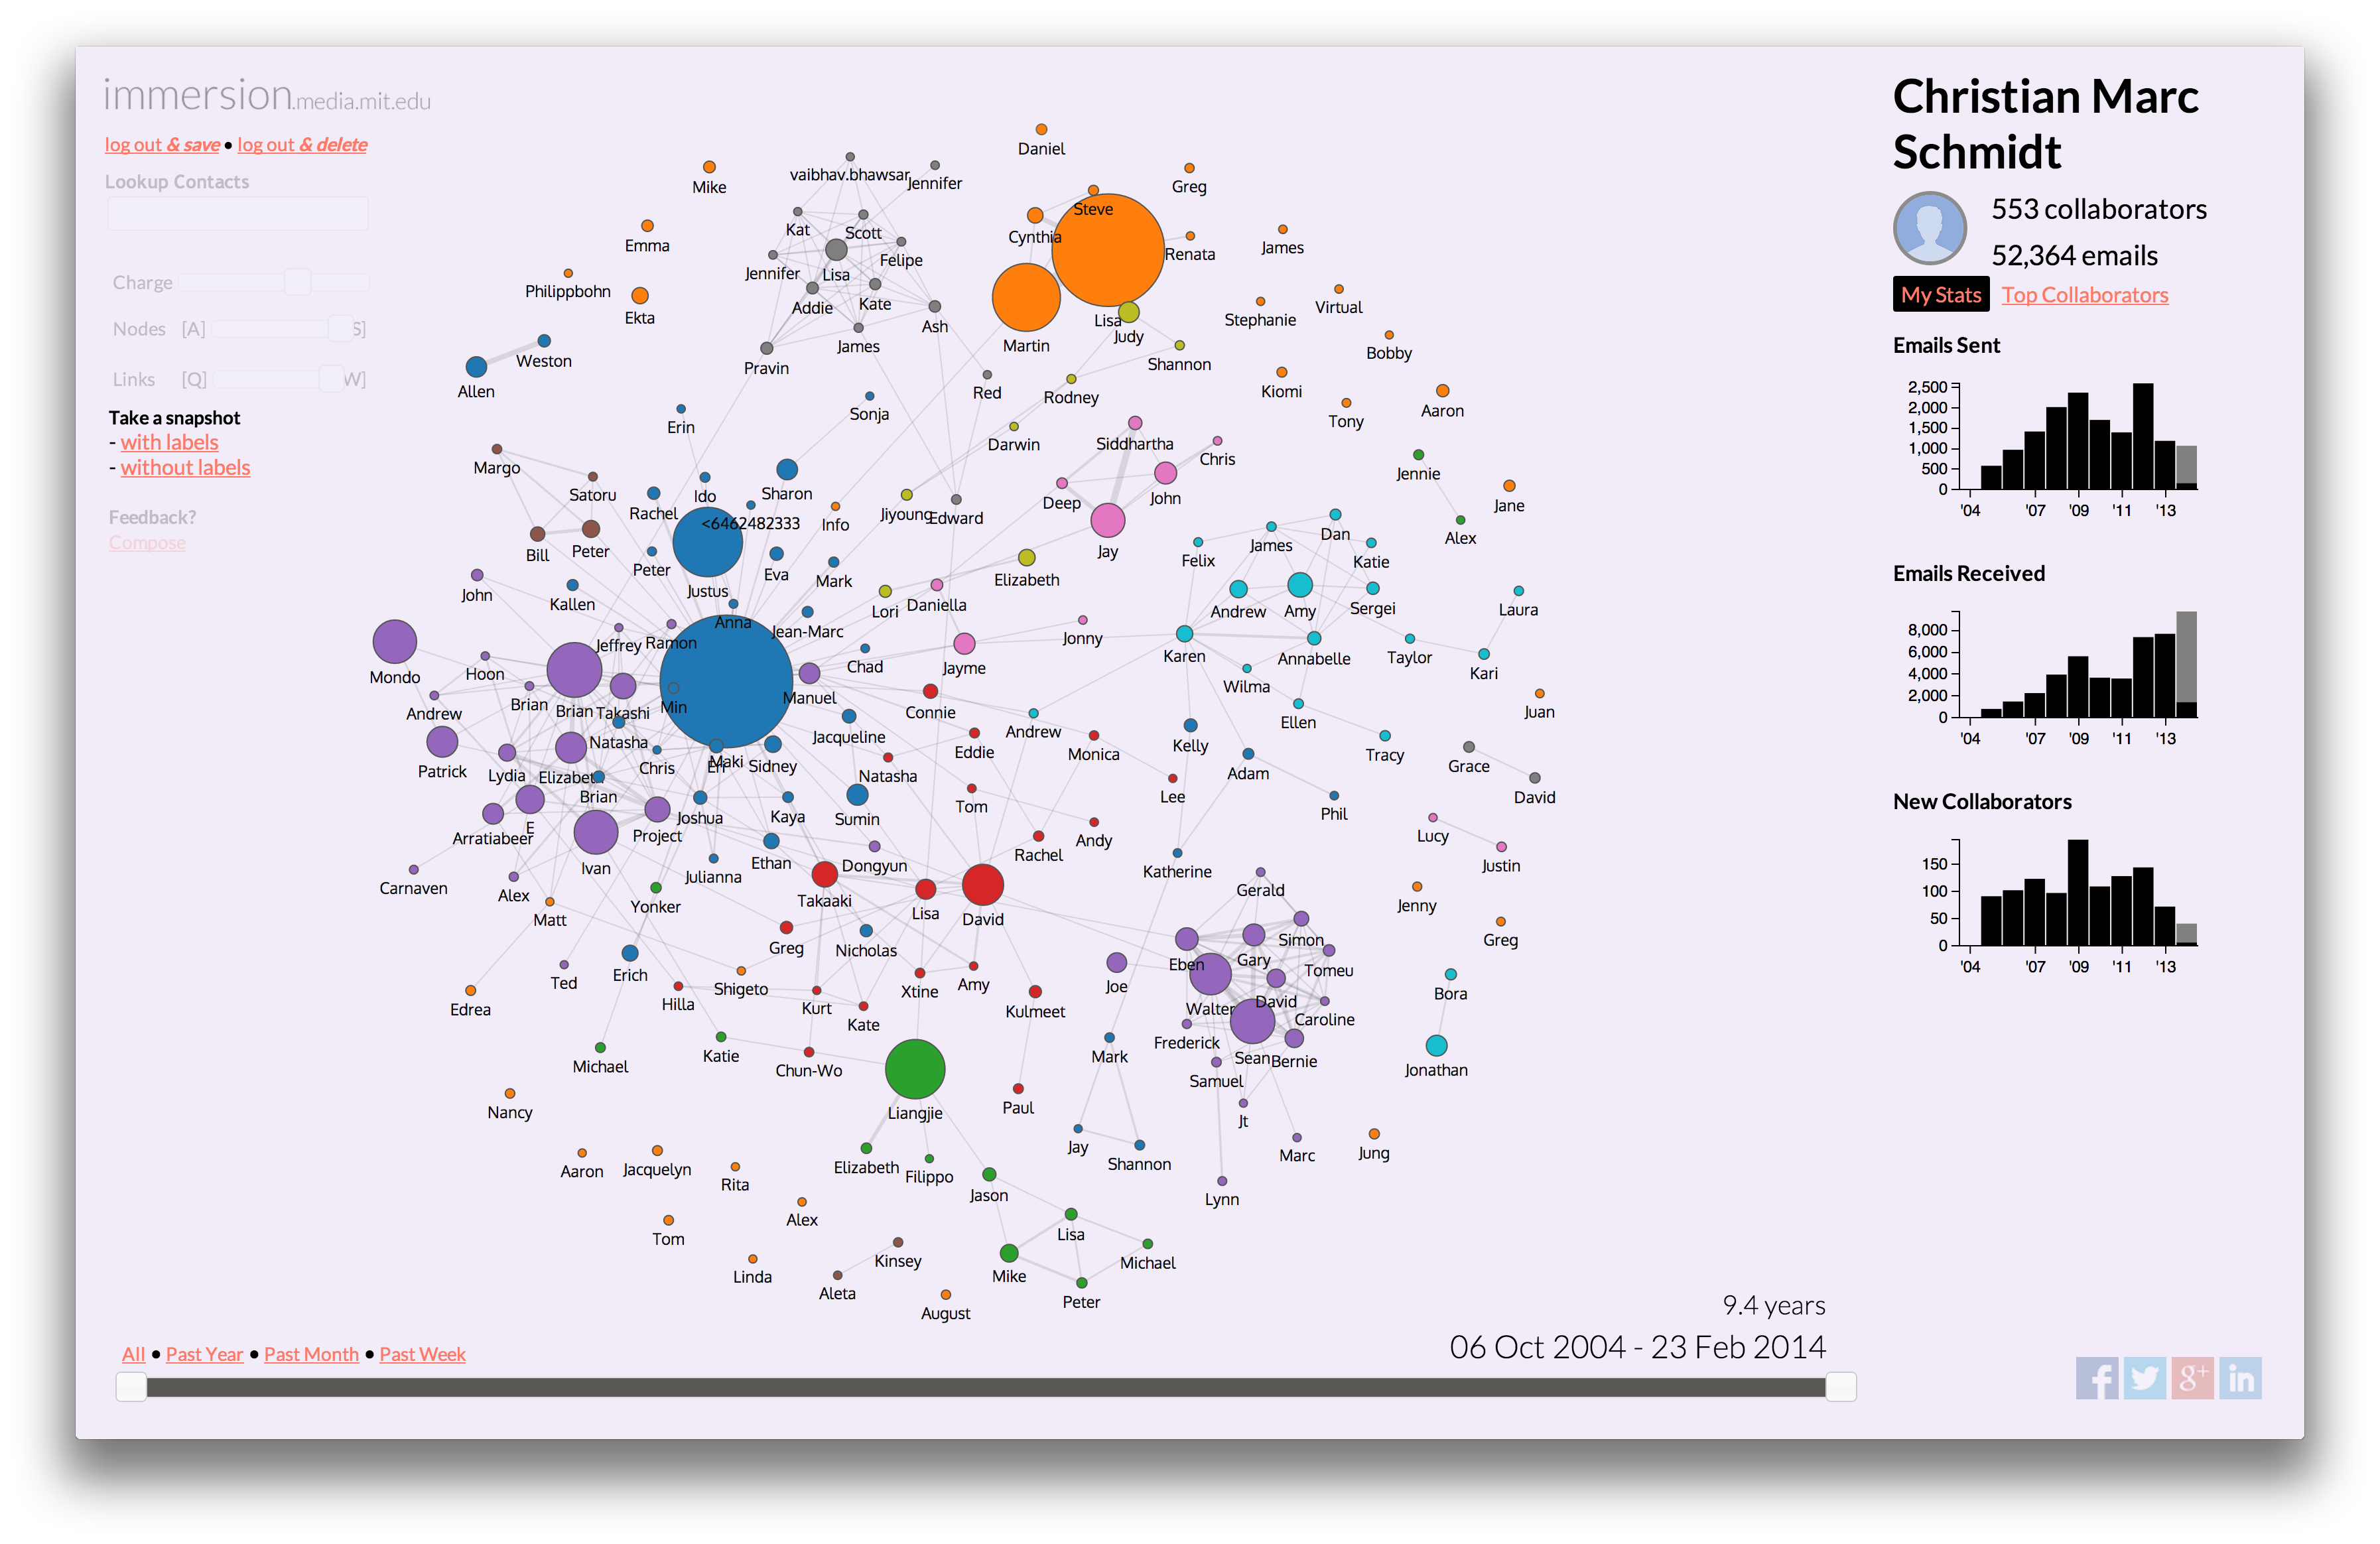
Immersion
MIT Media Lab
Impact Compassion Australia 2021
In Process
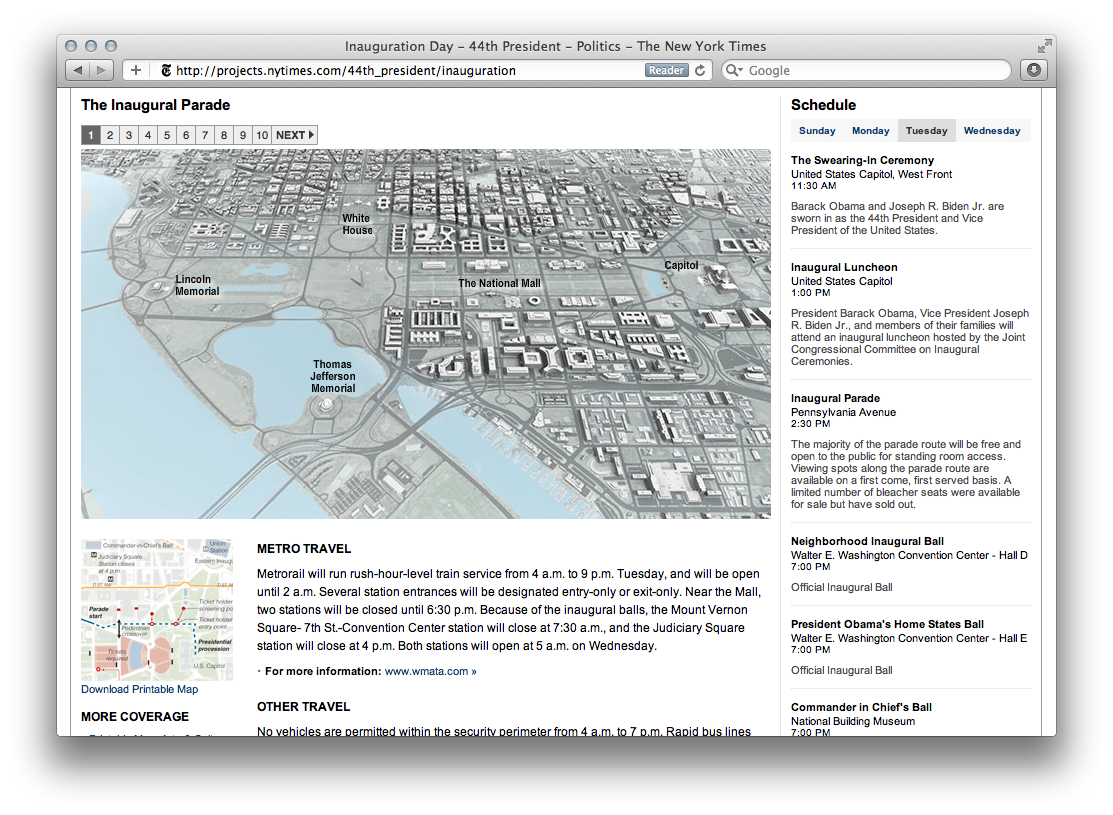
Inaugural Parade
New York Times Graphics
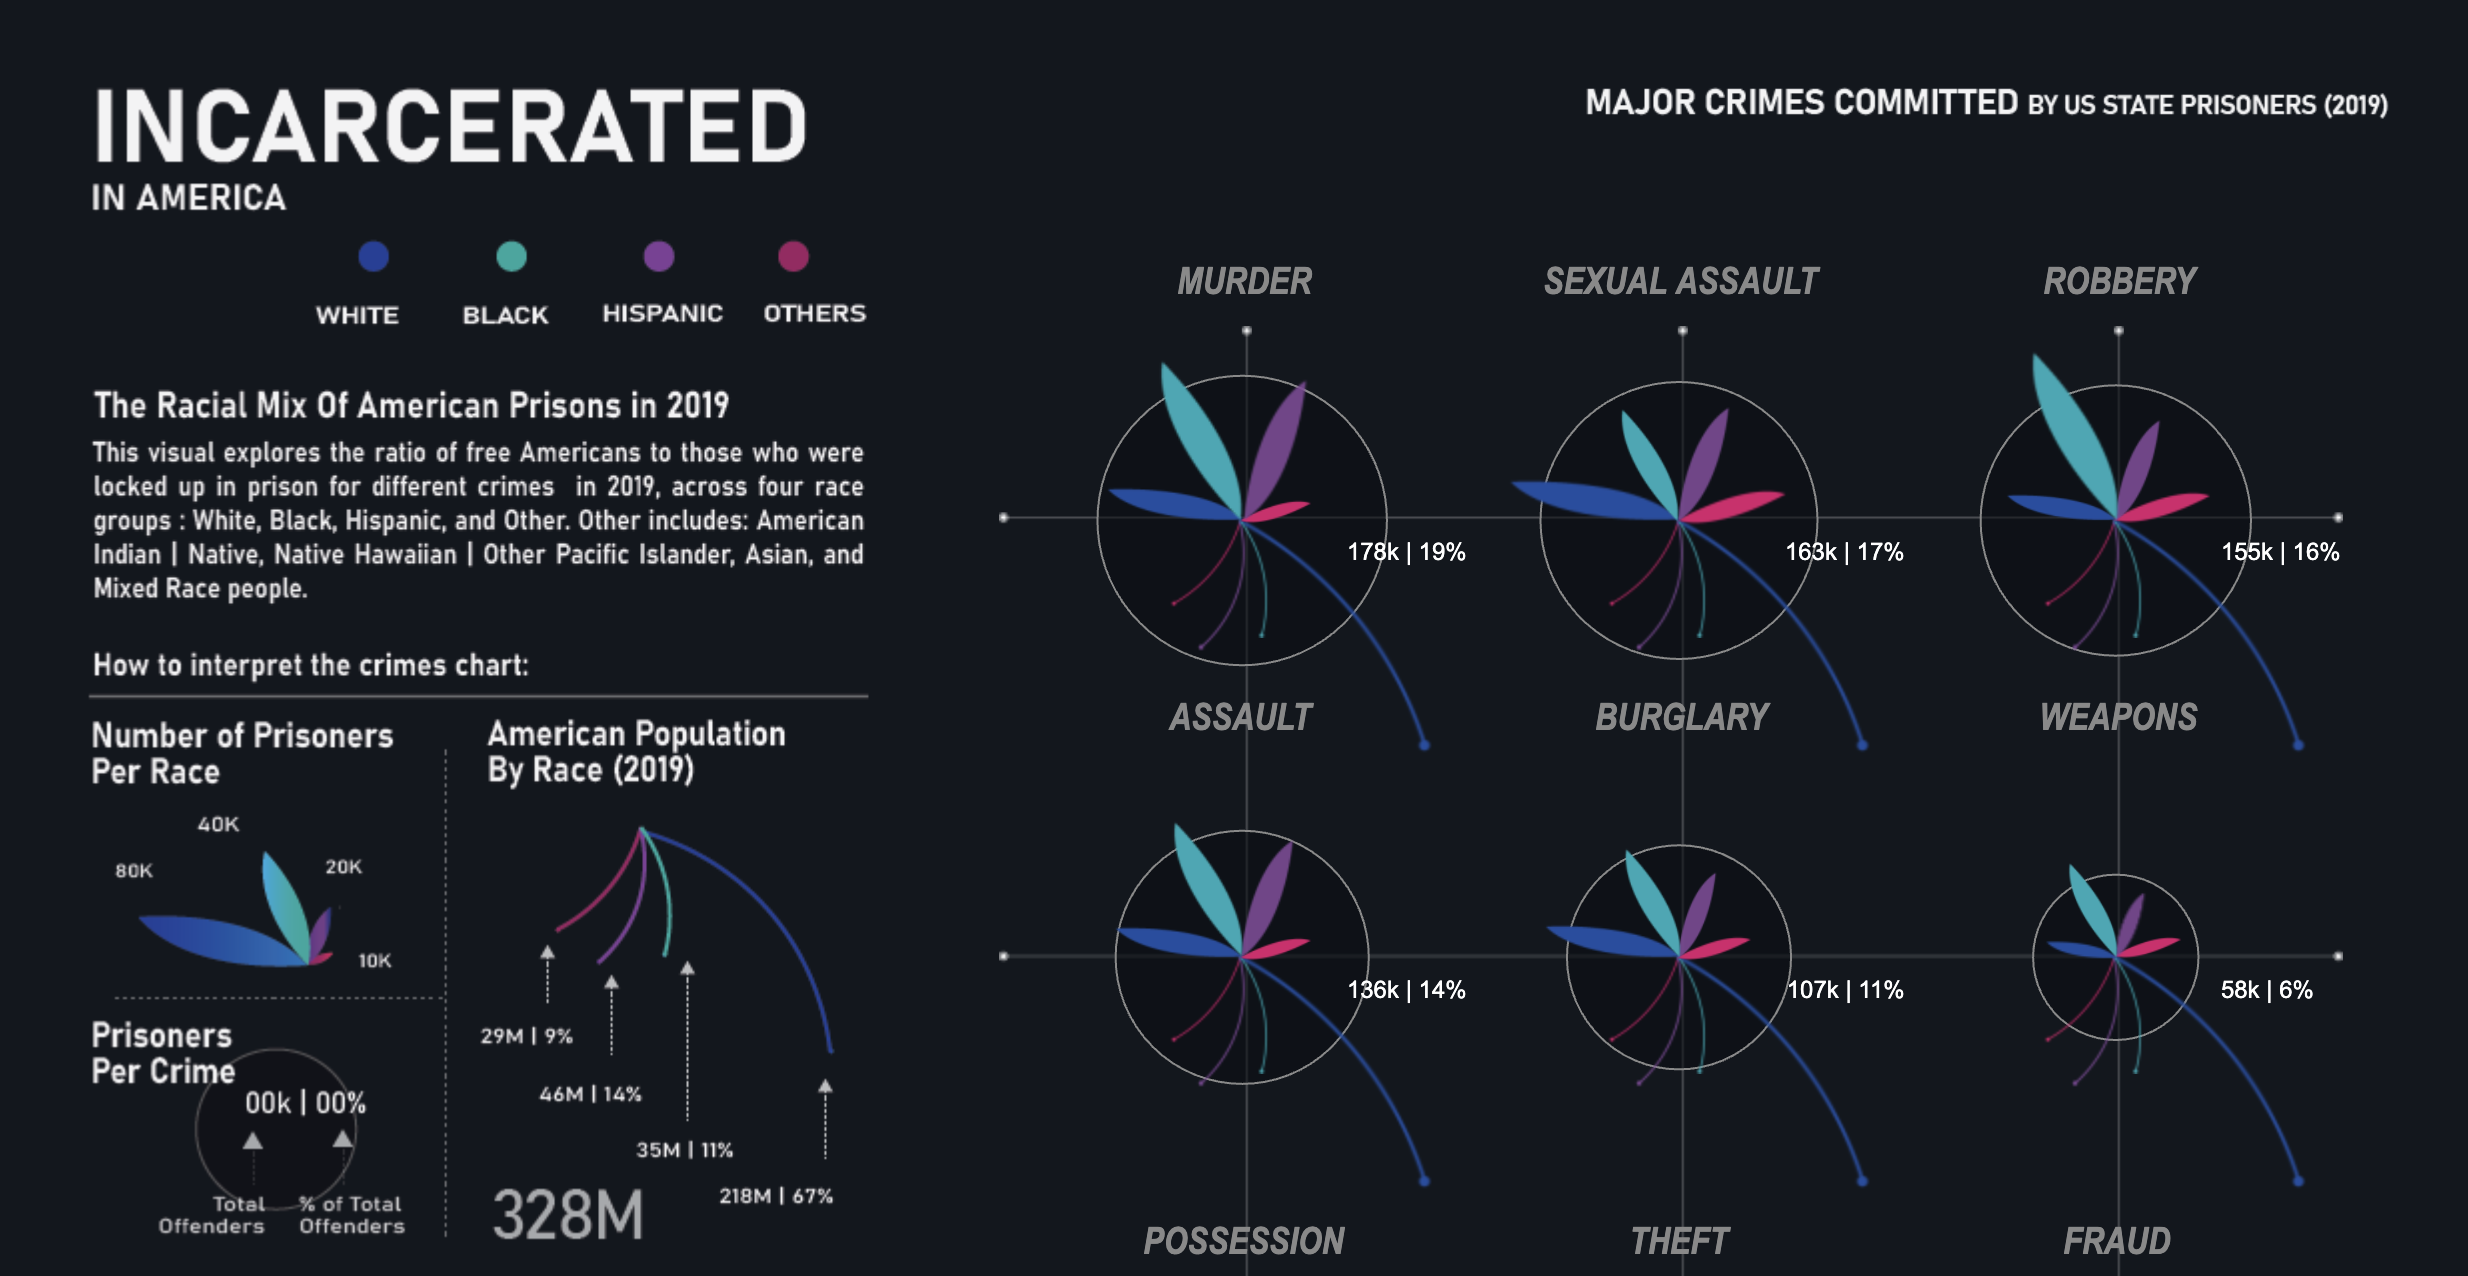
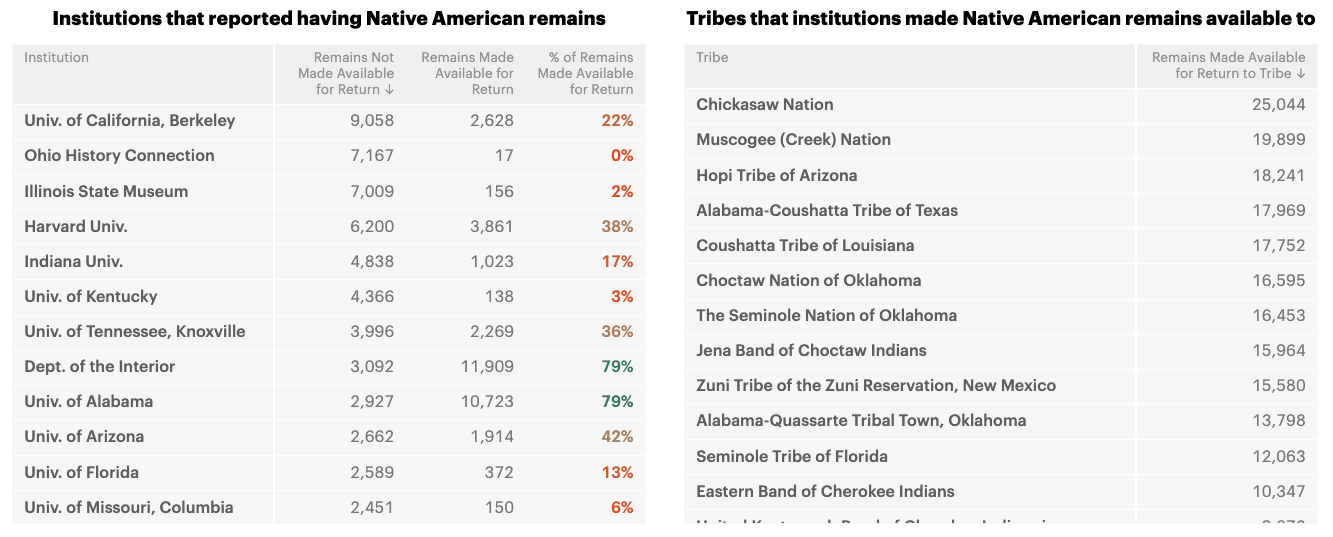
Incarcerated in America
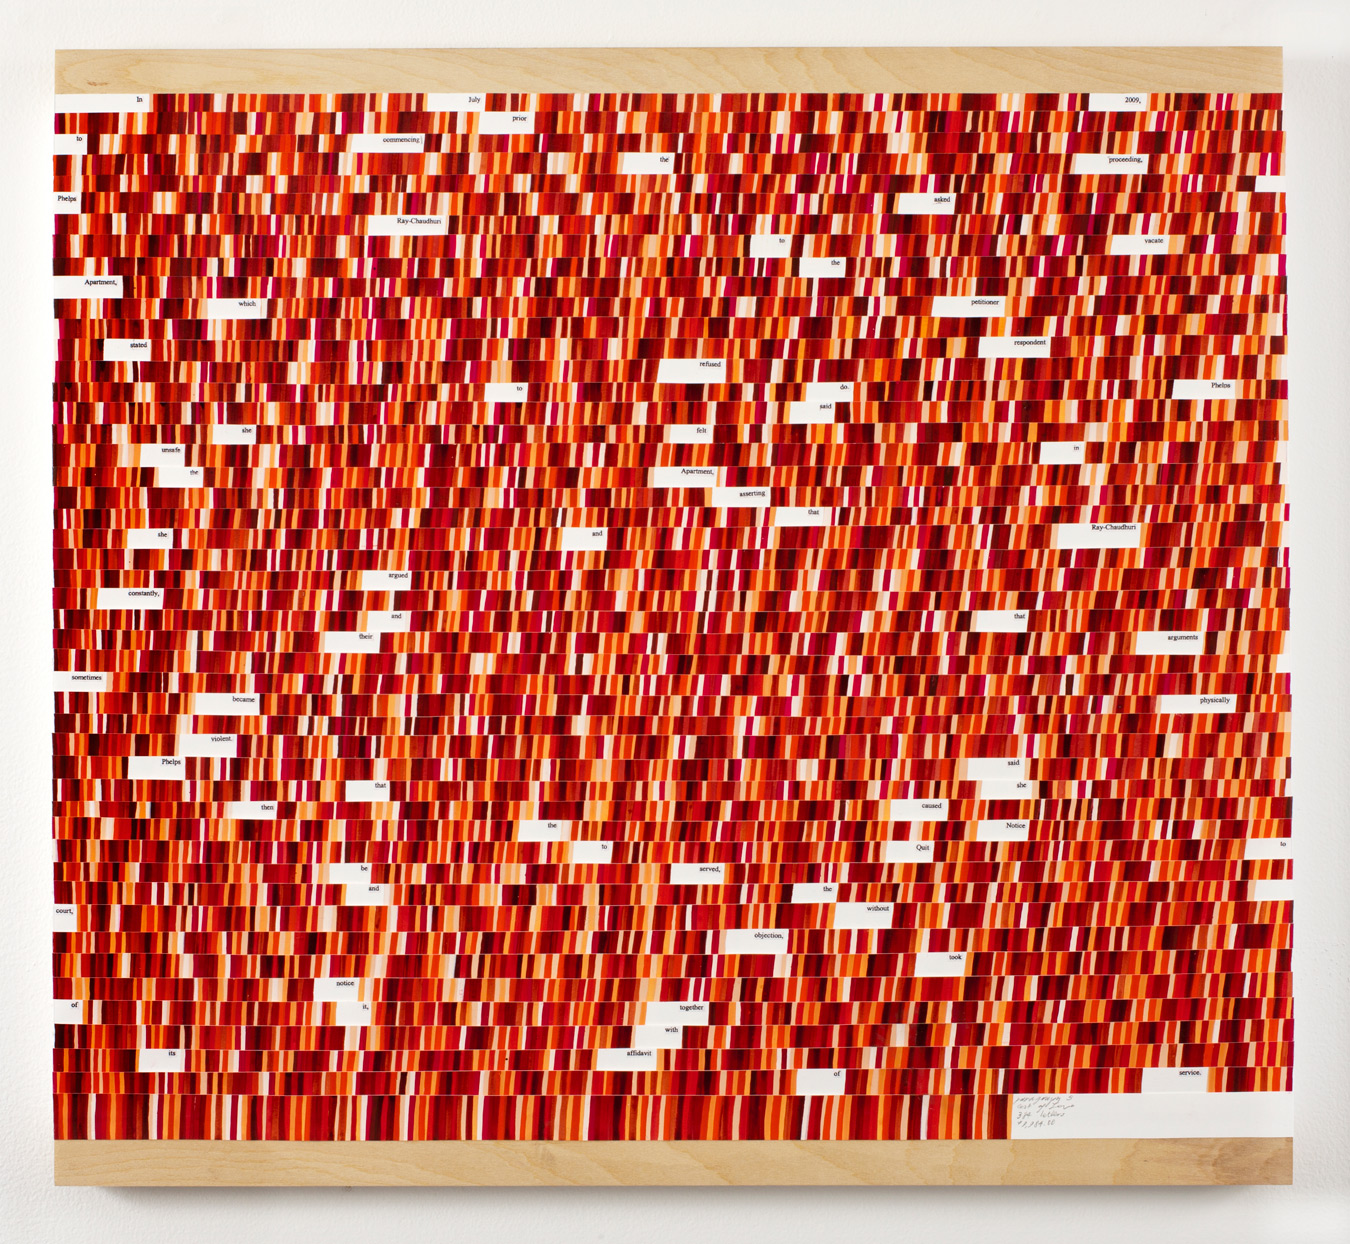
Income and Expenses
Danica Phelps
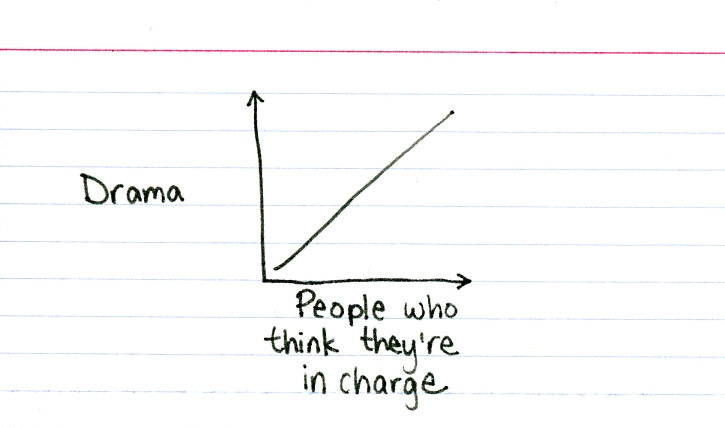
Indexed
Jessica Hagy
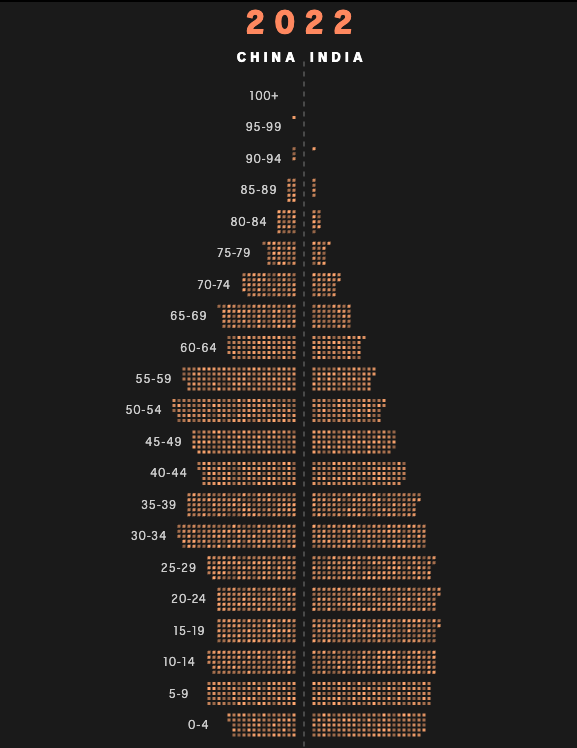
India: New Global Superpower
ABC News
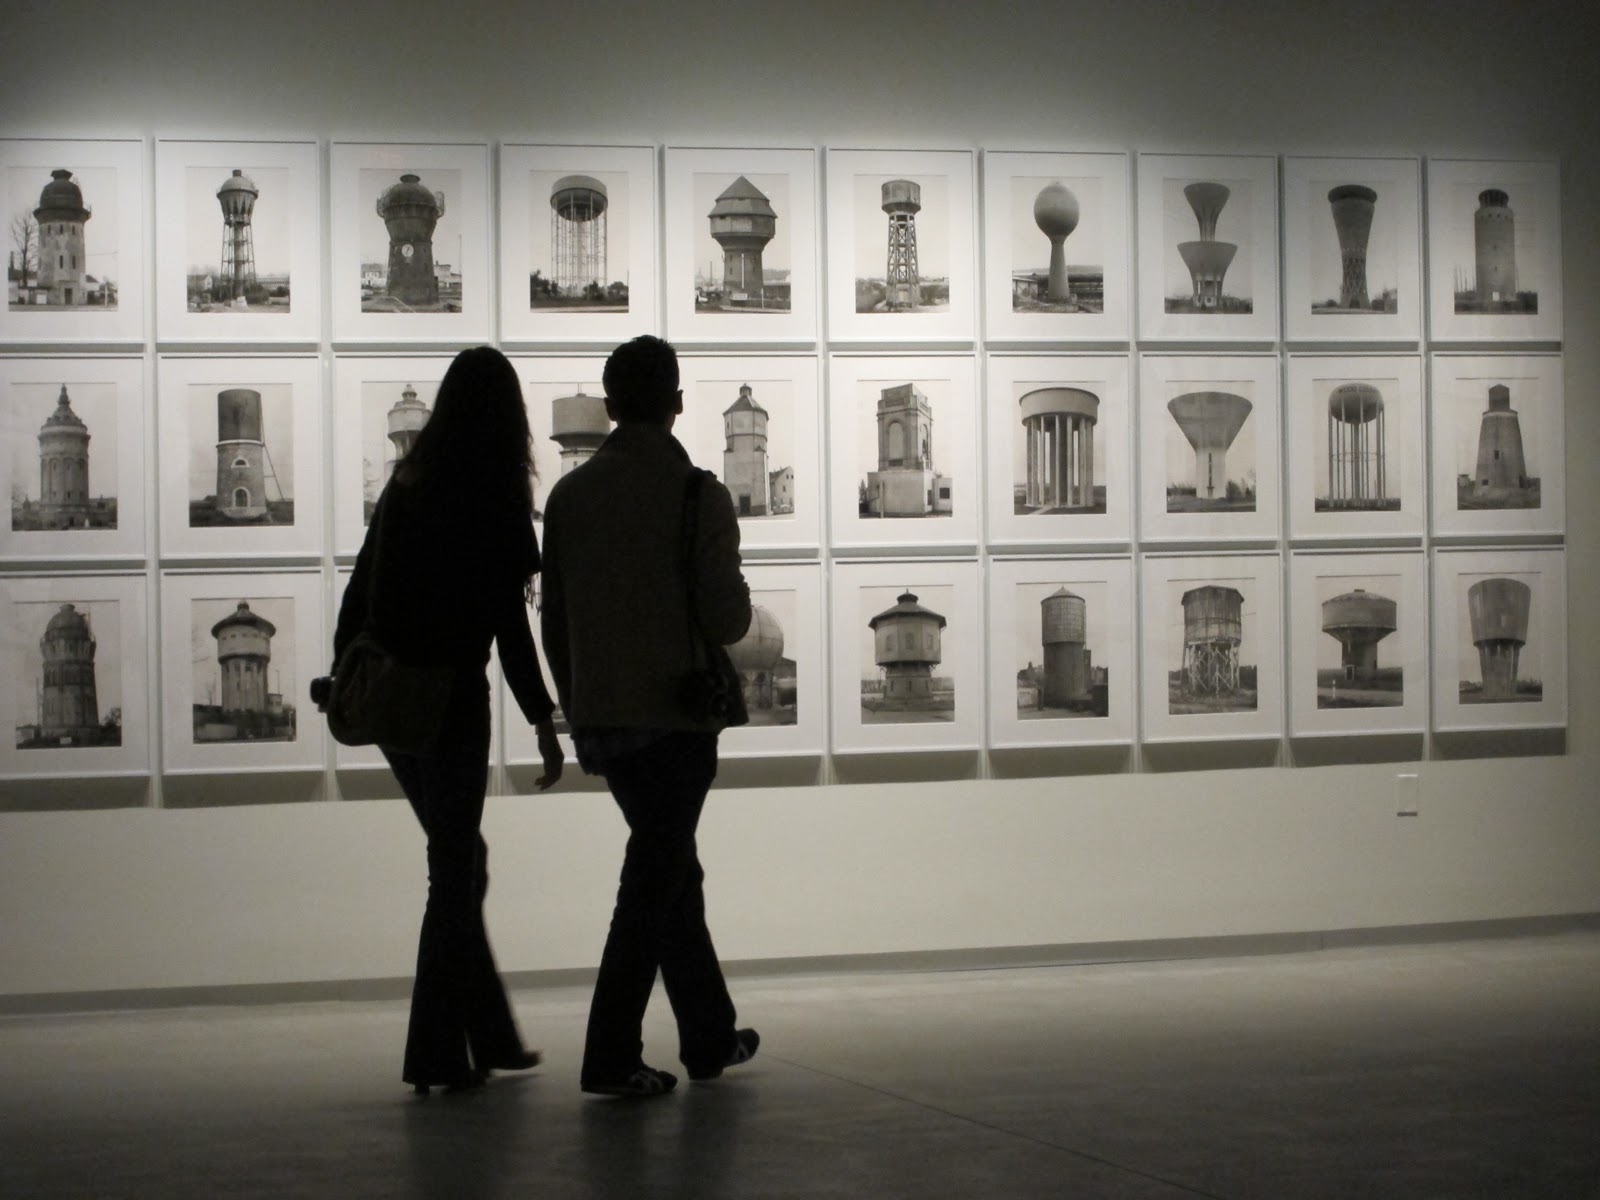
Industrial Typologies
Bernd and Hilla Becher
Inflection AI
Inflection AI
inFORM
MIT

inFORMation and Violence
Information is Beautiful
David McCandless
Innovations for Poverty Action
Innovations for Poverty Action
Instant Hutong
Marcella Campa, Stefano Avesani
Institute for Future Cities
Intel Interactive Infographic / Doremus
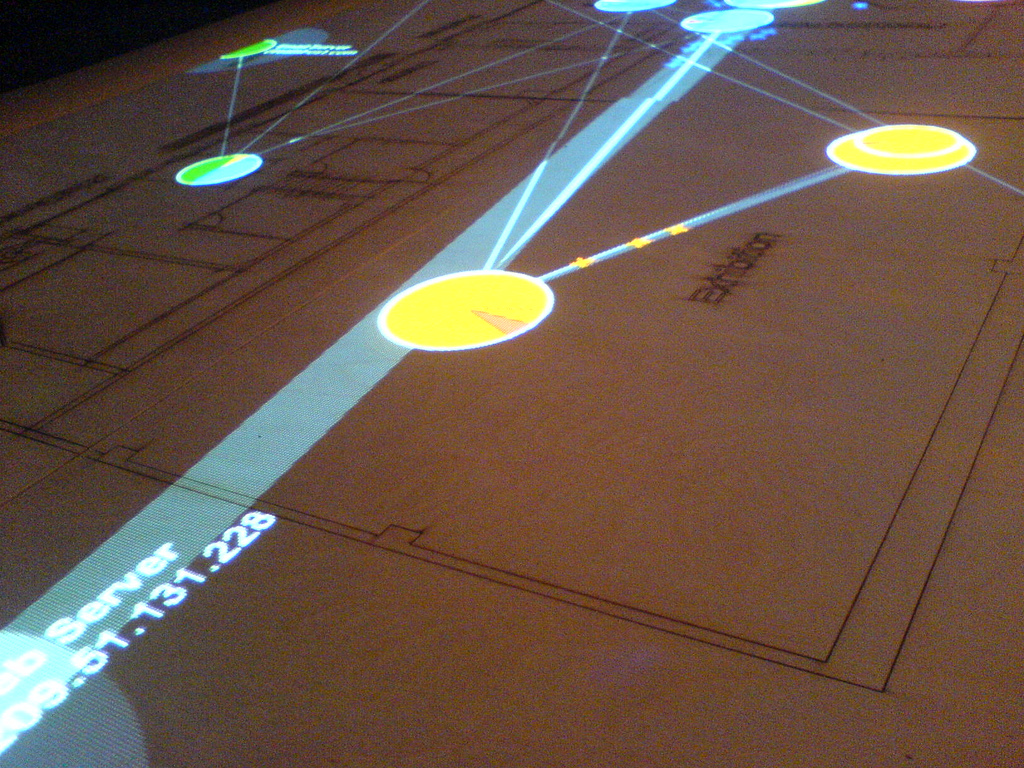
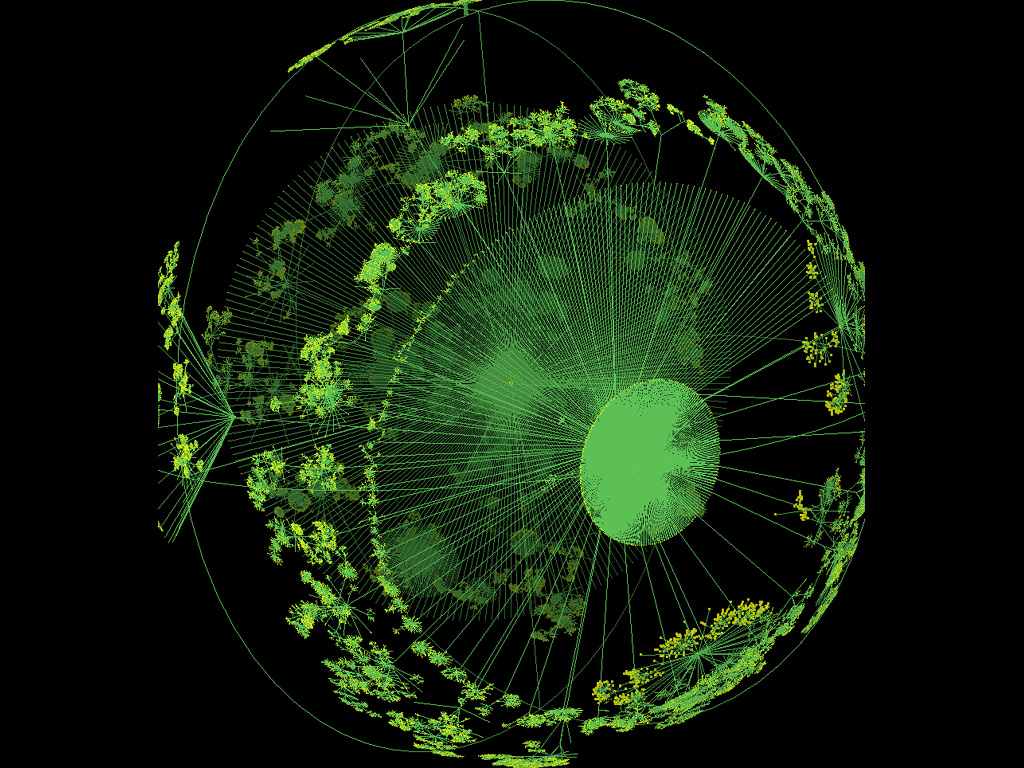
Internet Map
Stephen Harrison
Internet Maps
Bell Labs
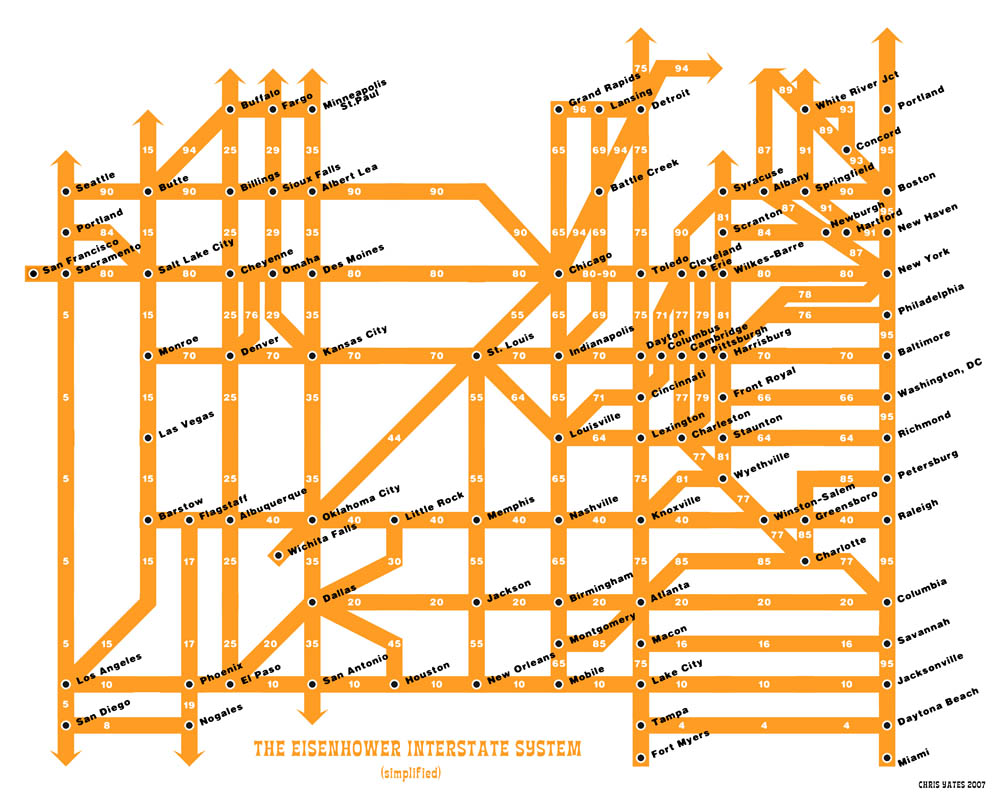
Interstate Highway Map
Cameron Booth
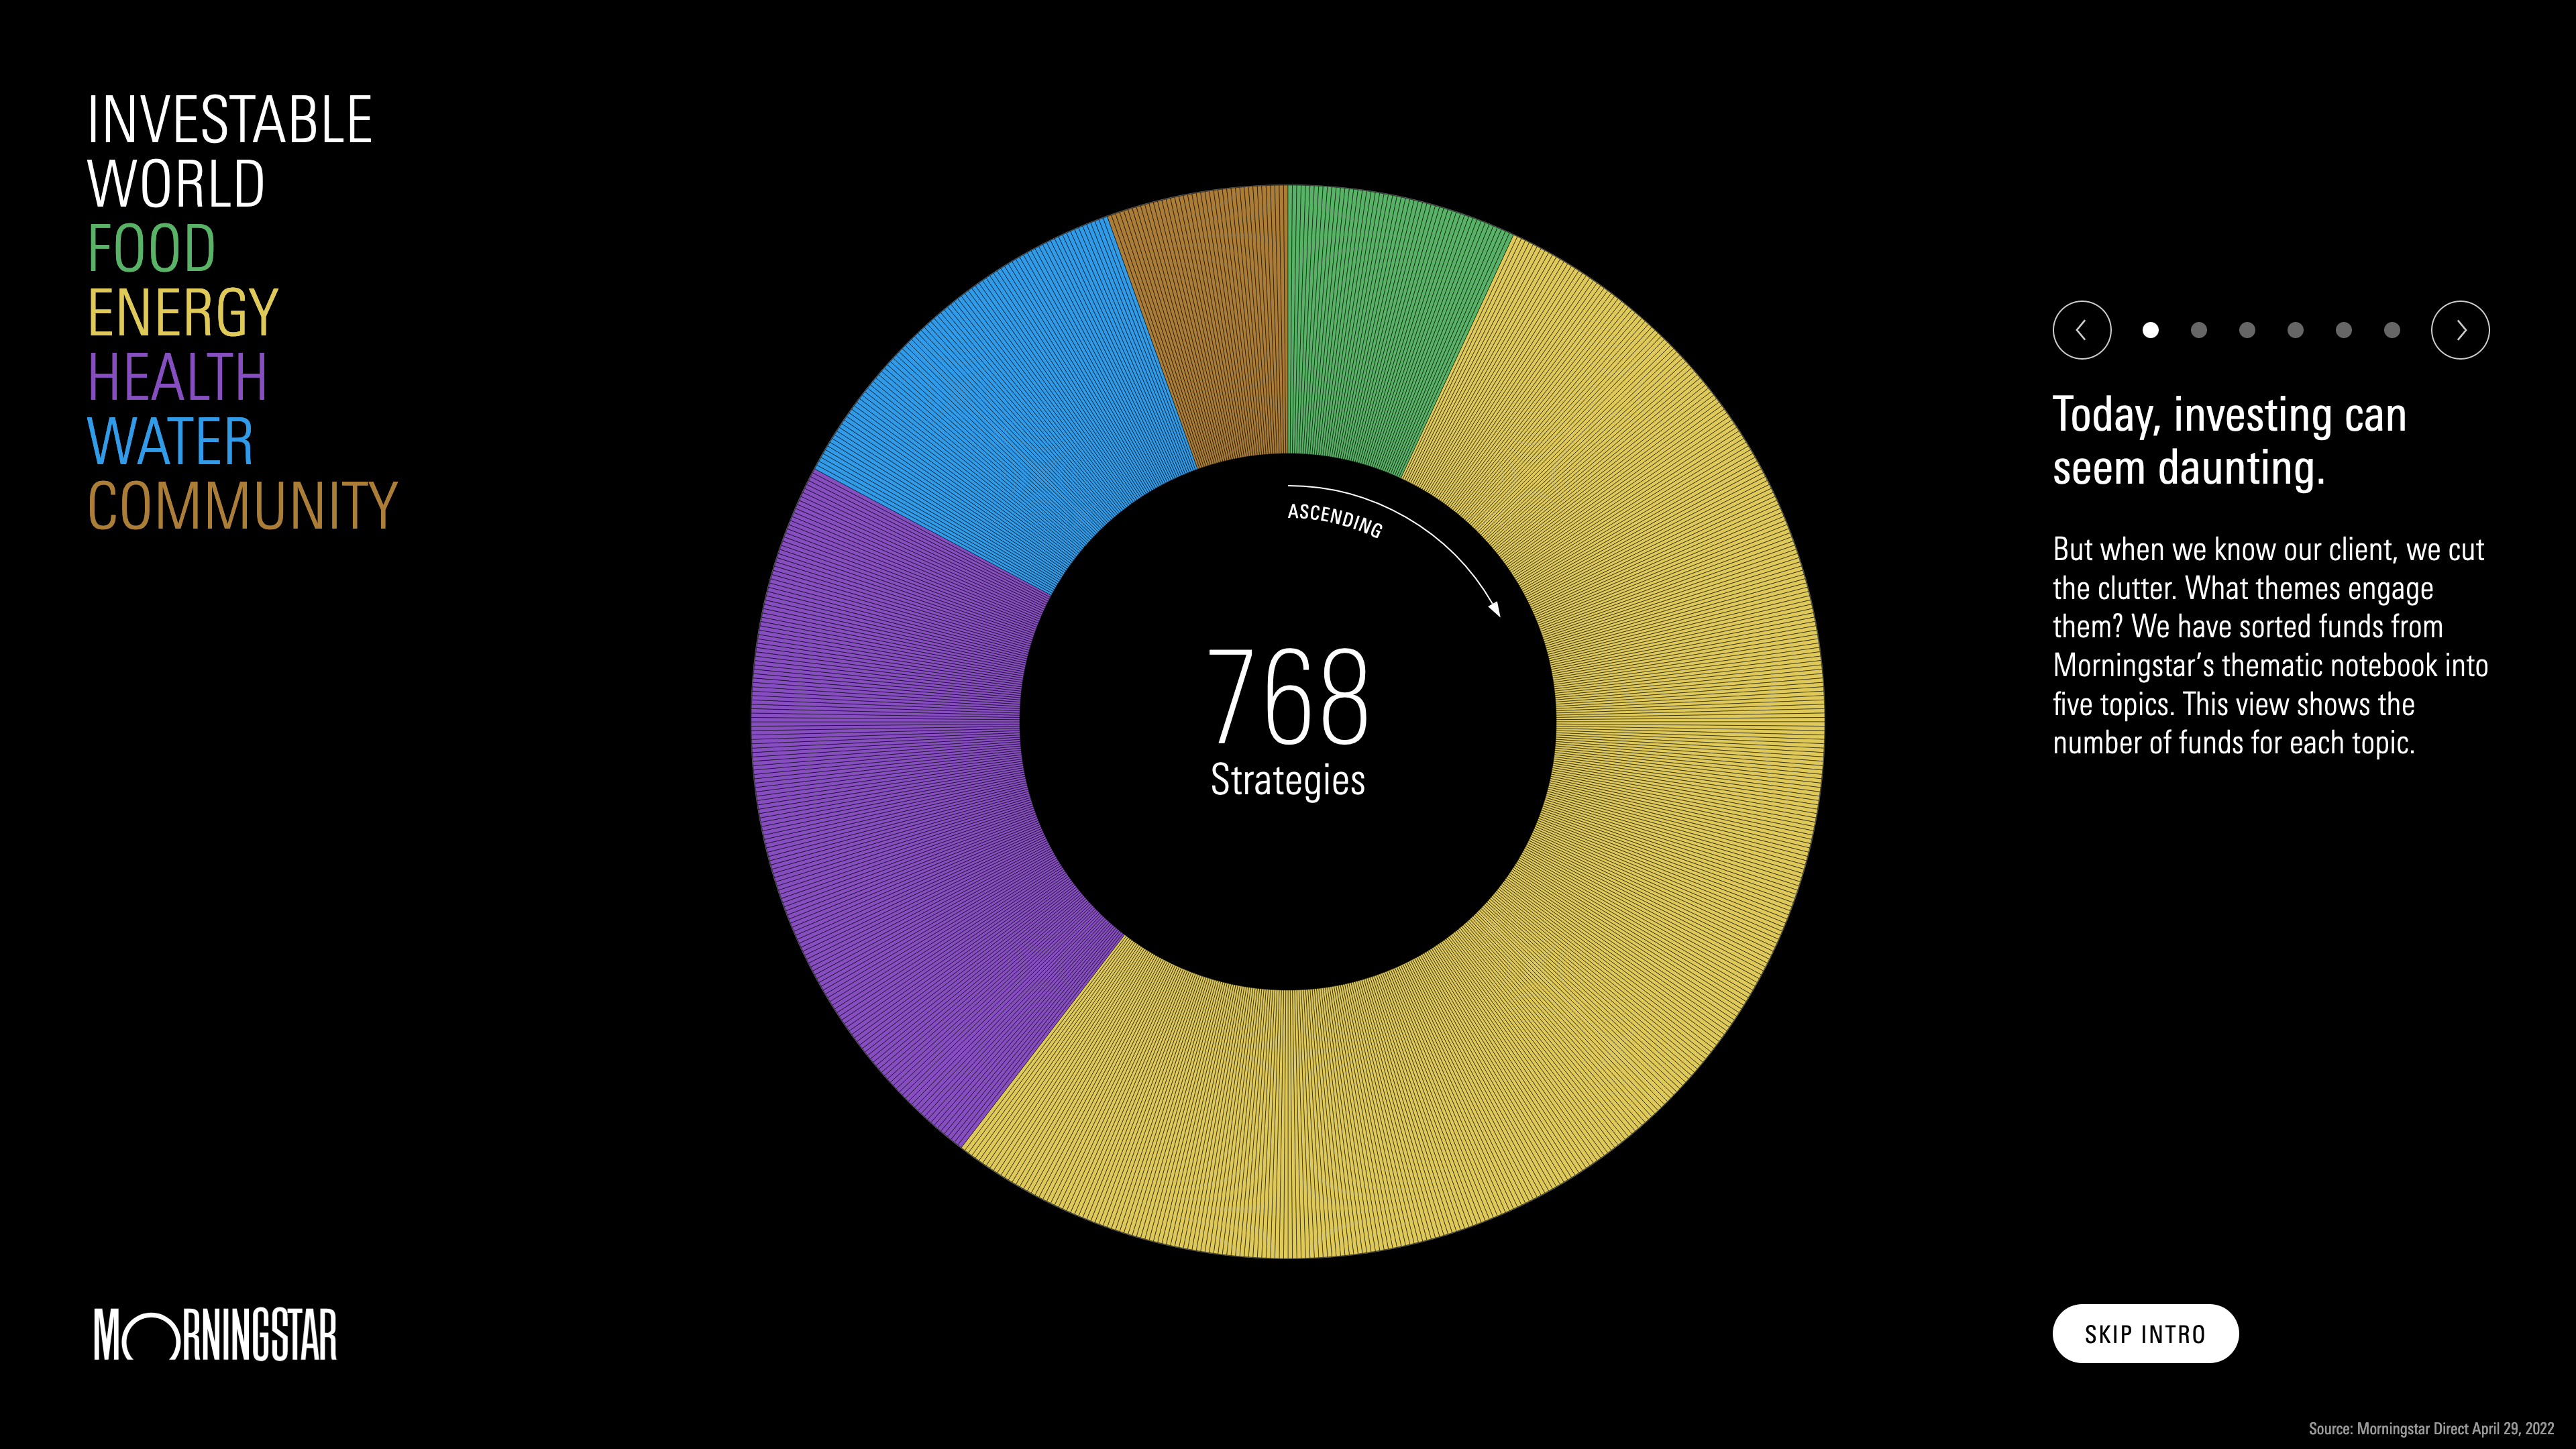
Investable World Data Explorer 2022

Invisible Cities
Schema Design
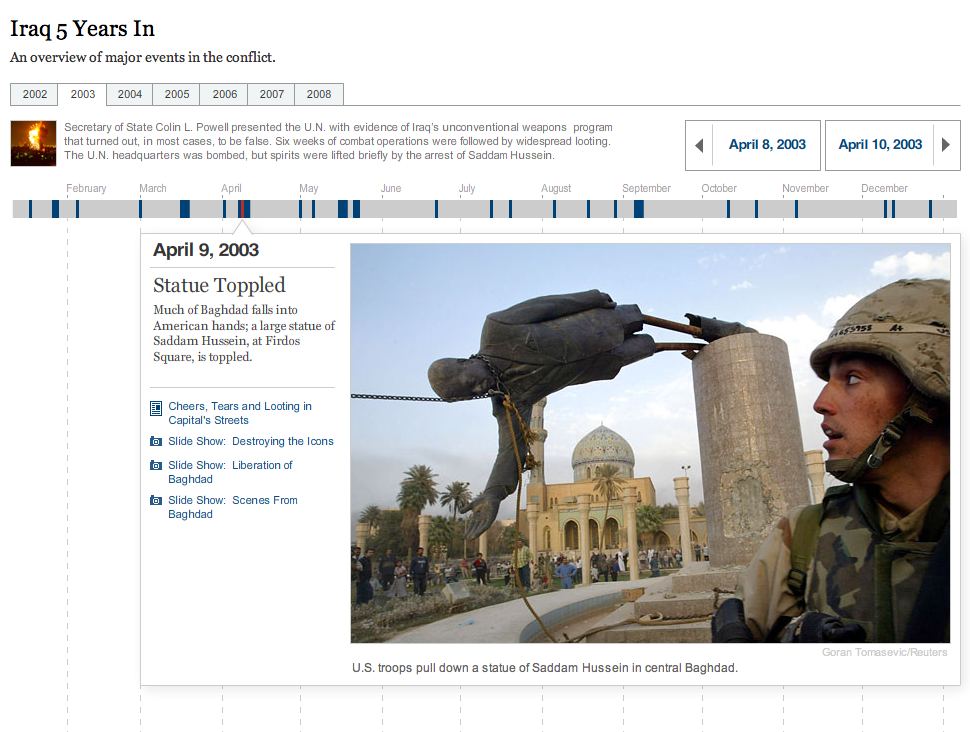
Iraq 5 Year
New York Times Graphics
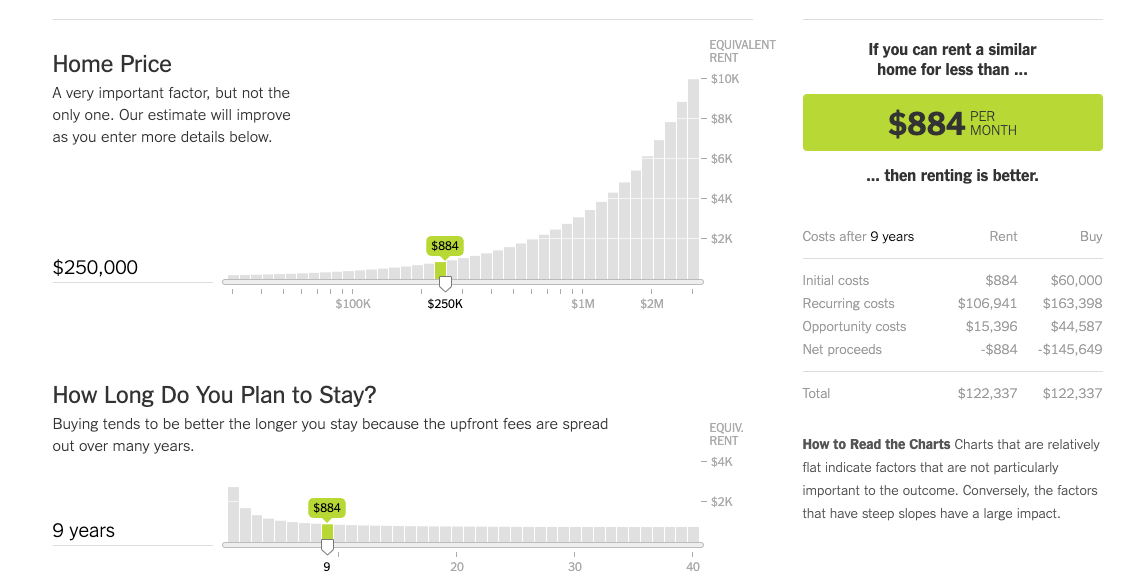
Is It Better to Rent or Buy?
The New York Times
Is Sleep Training Harmful?
Pudding
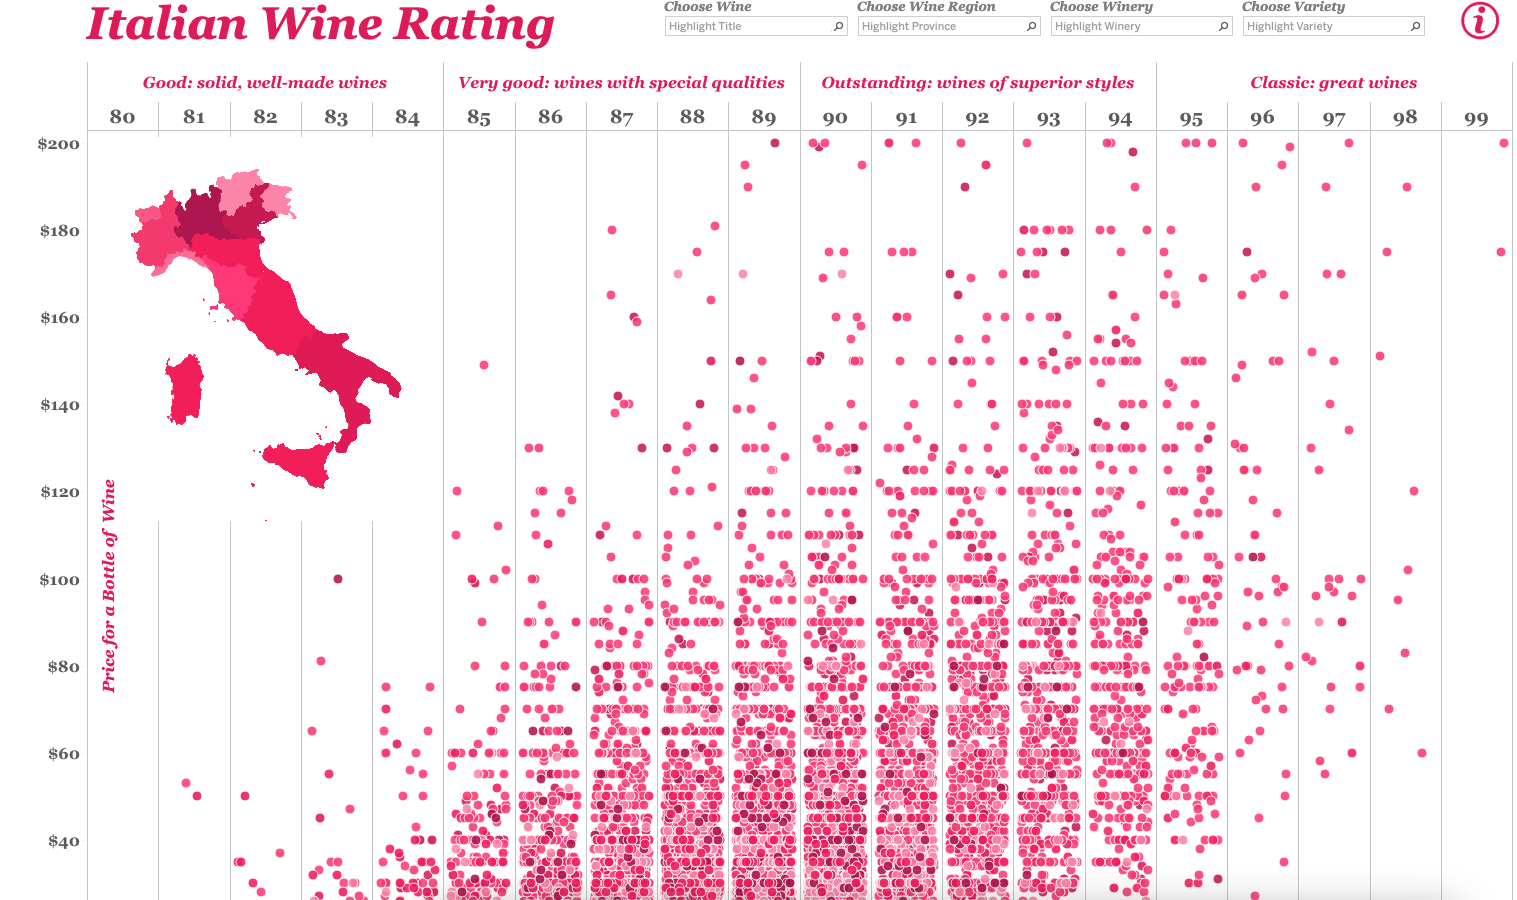
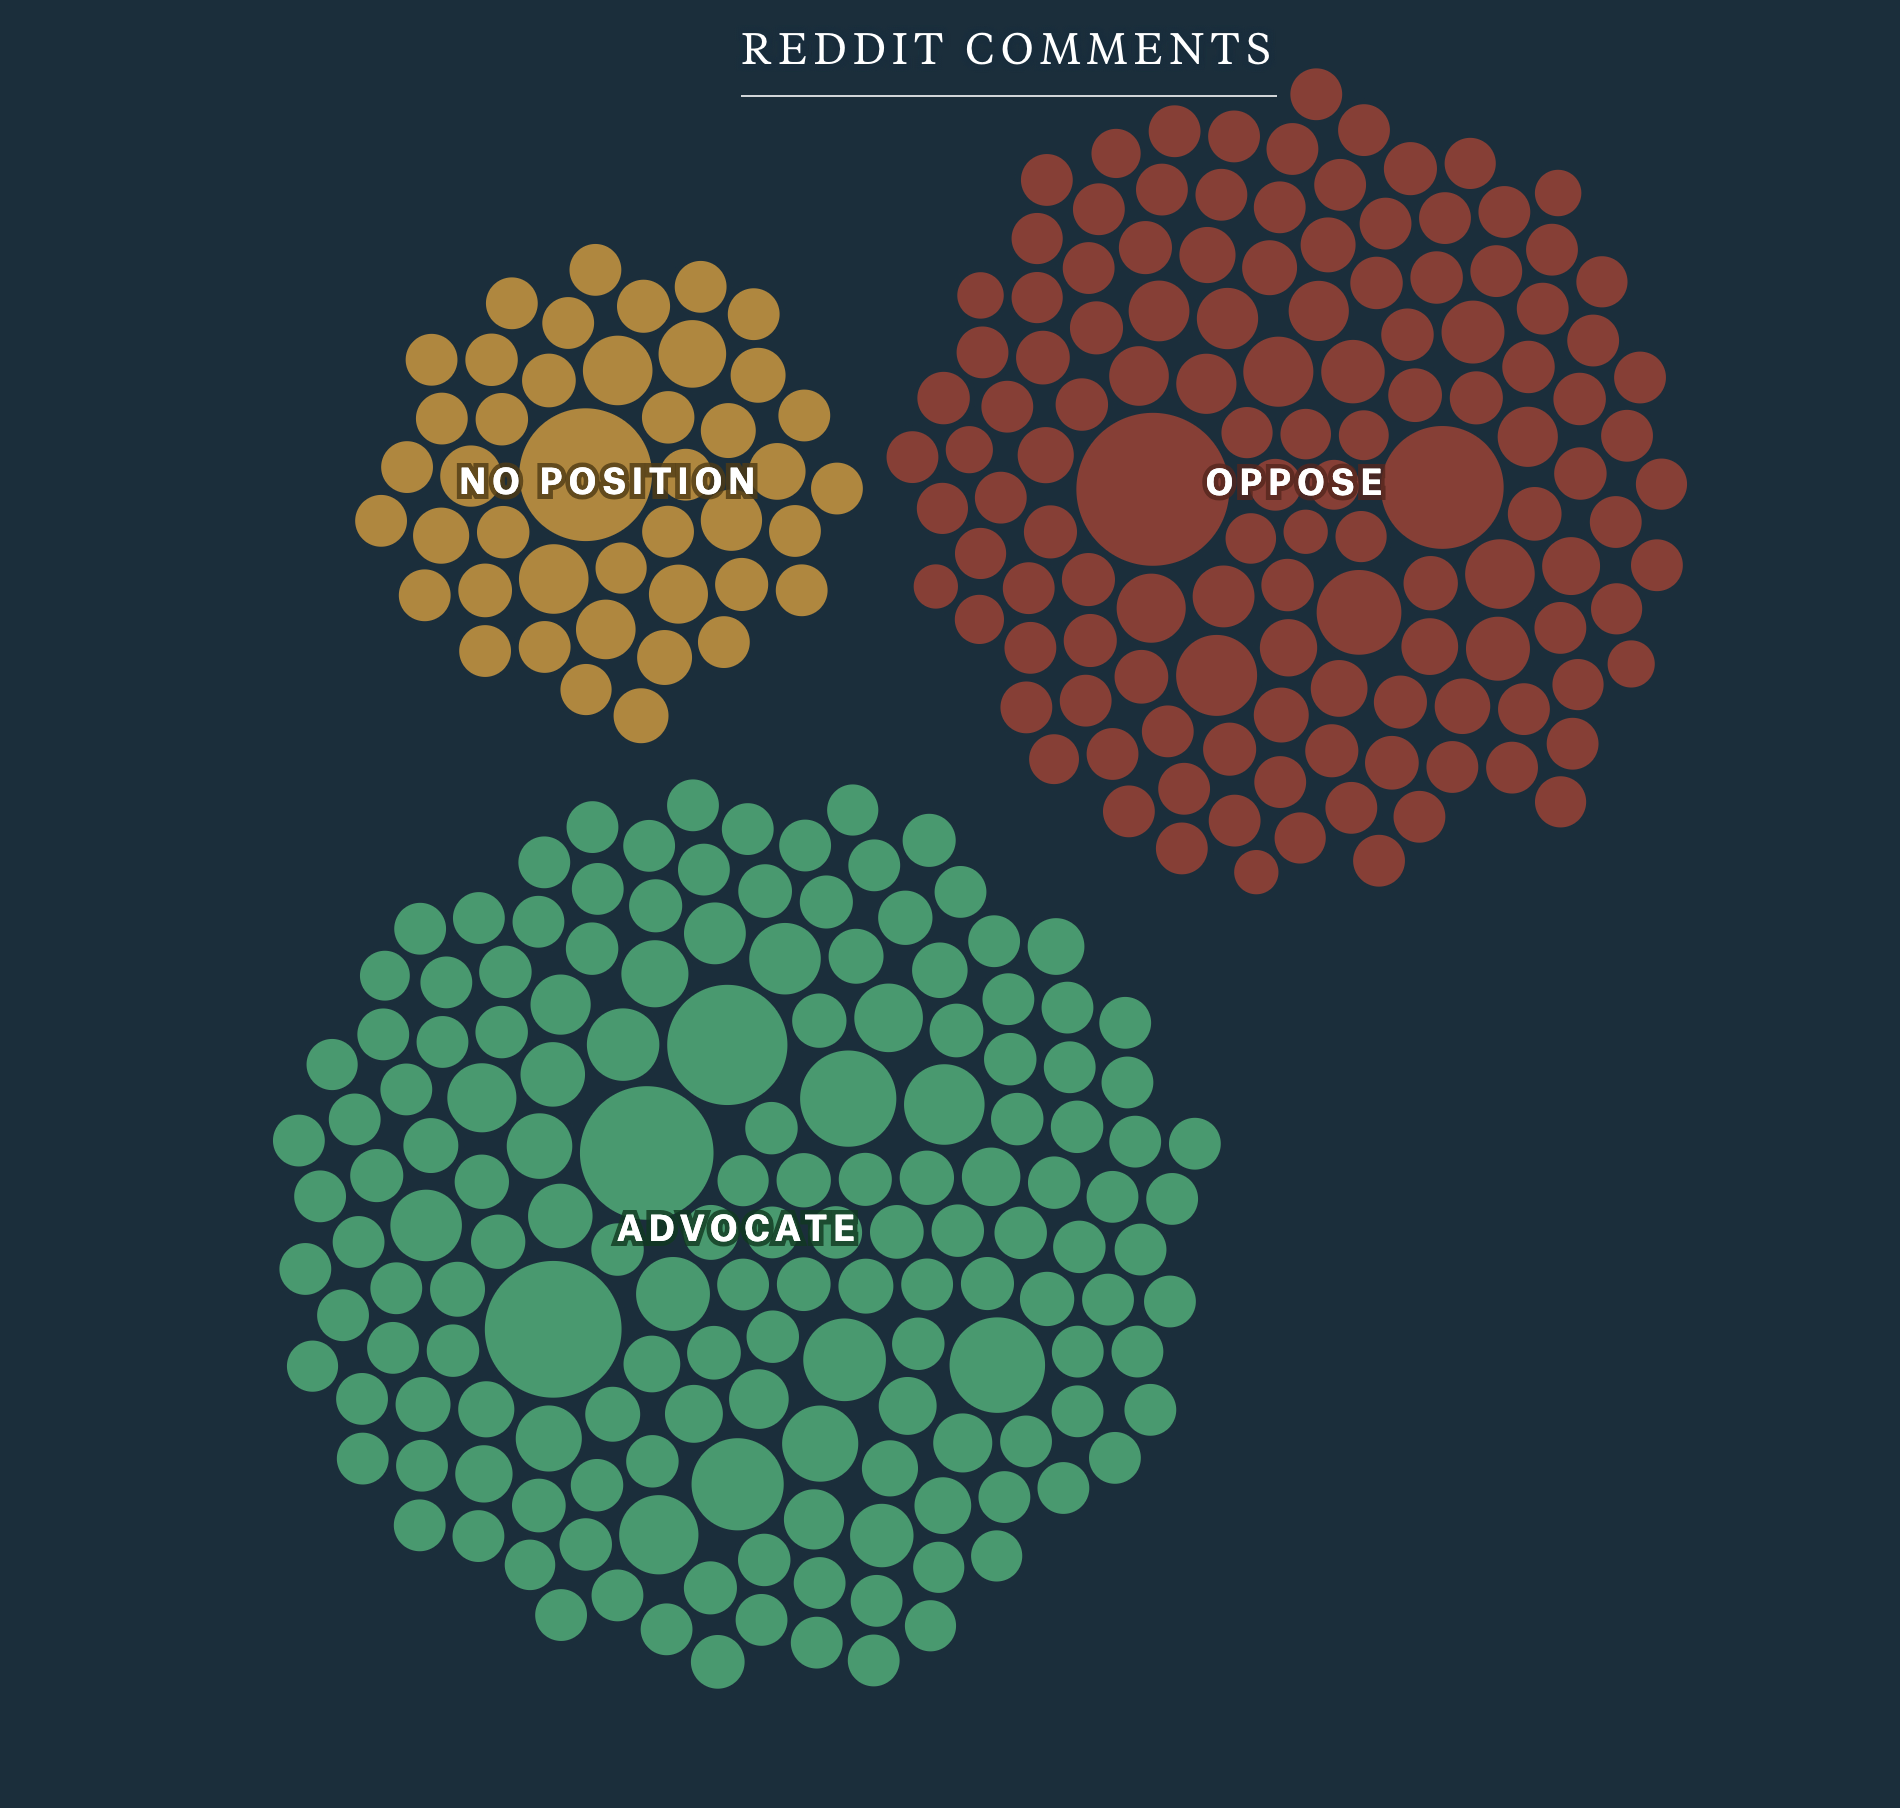
Italian Wine Rating
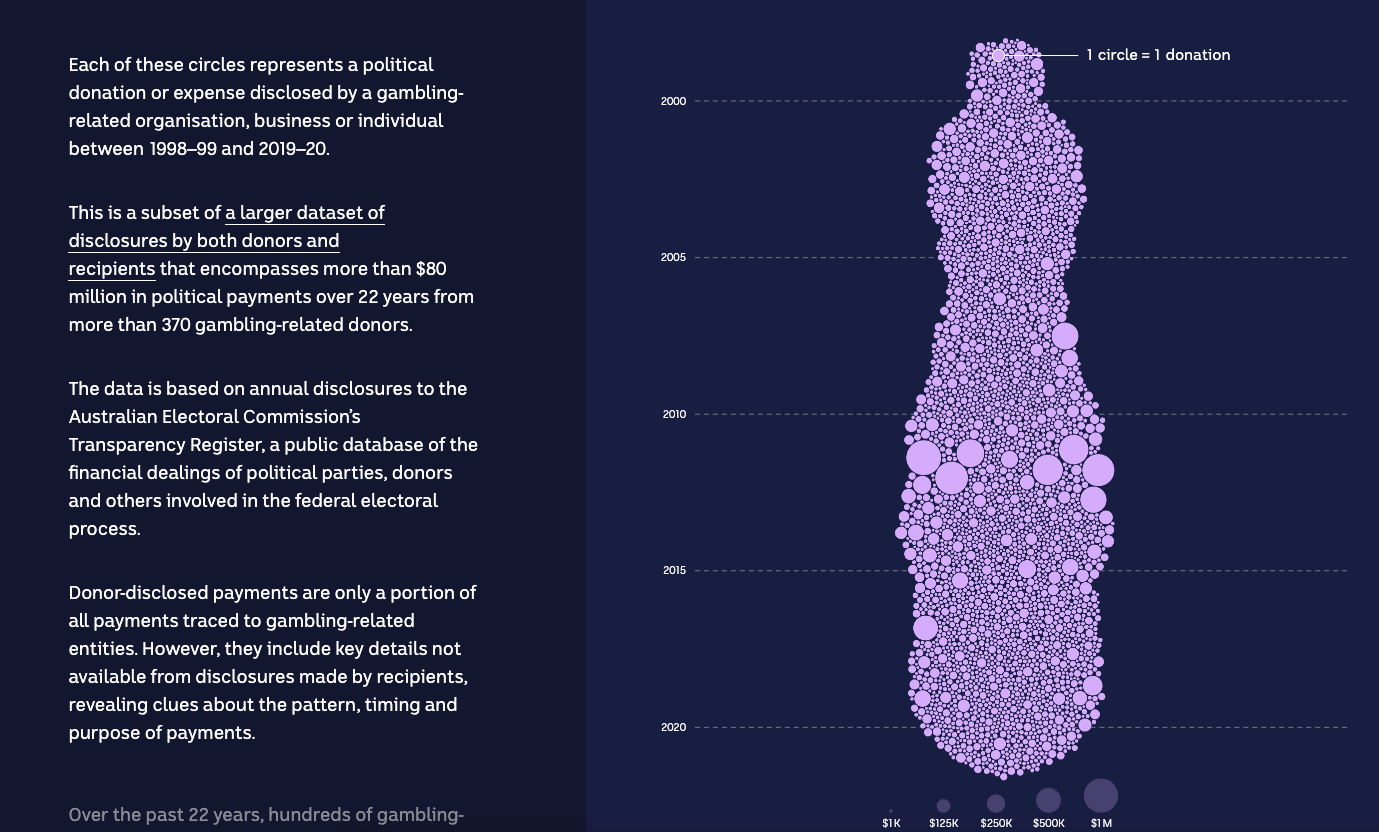
Jackpot
ABC News
Jane Jacobs in the Sky

Jigsaw

JJ
Golan Levin
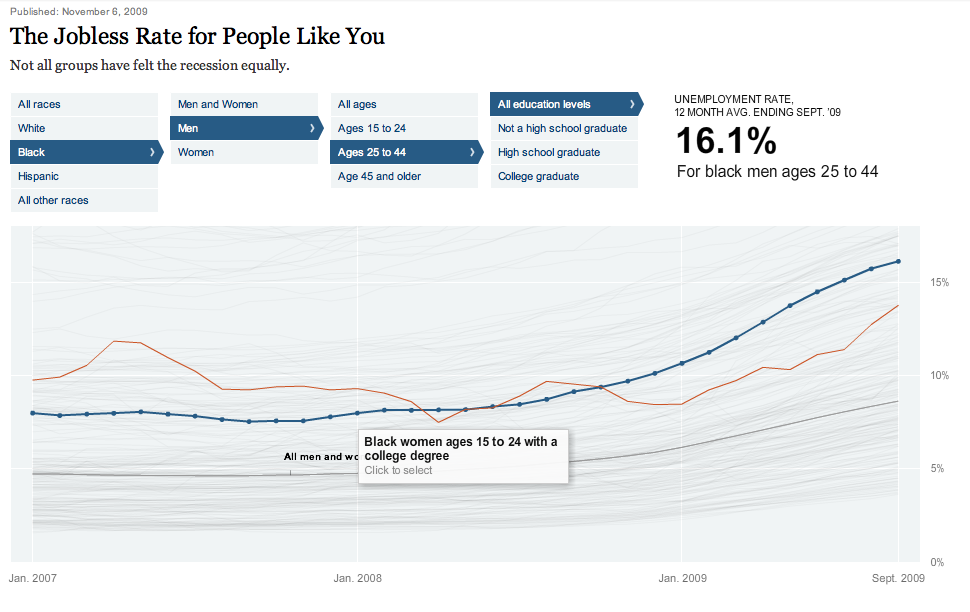
Jobless Rate
New York Times Graphics
K10KMood Stats
K10K
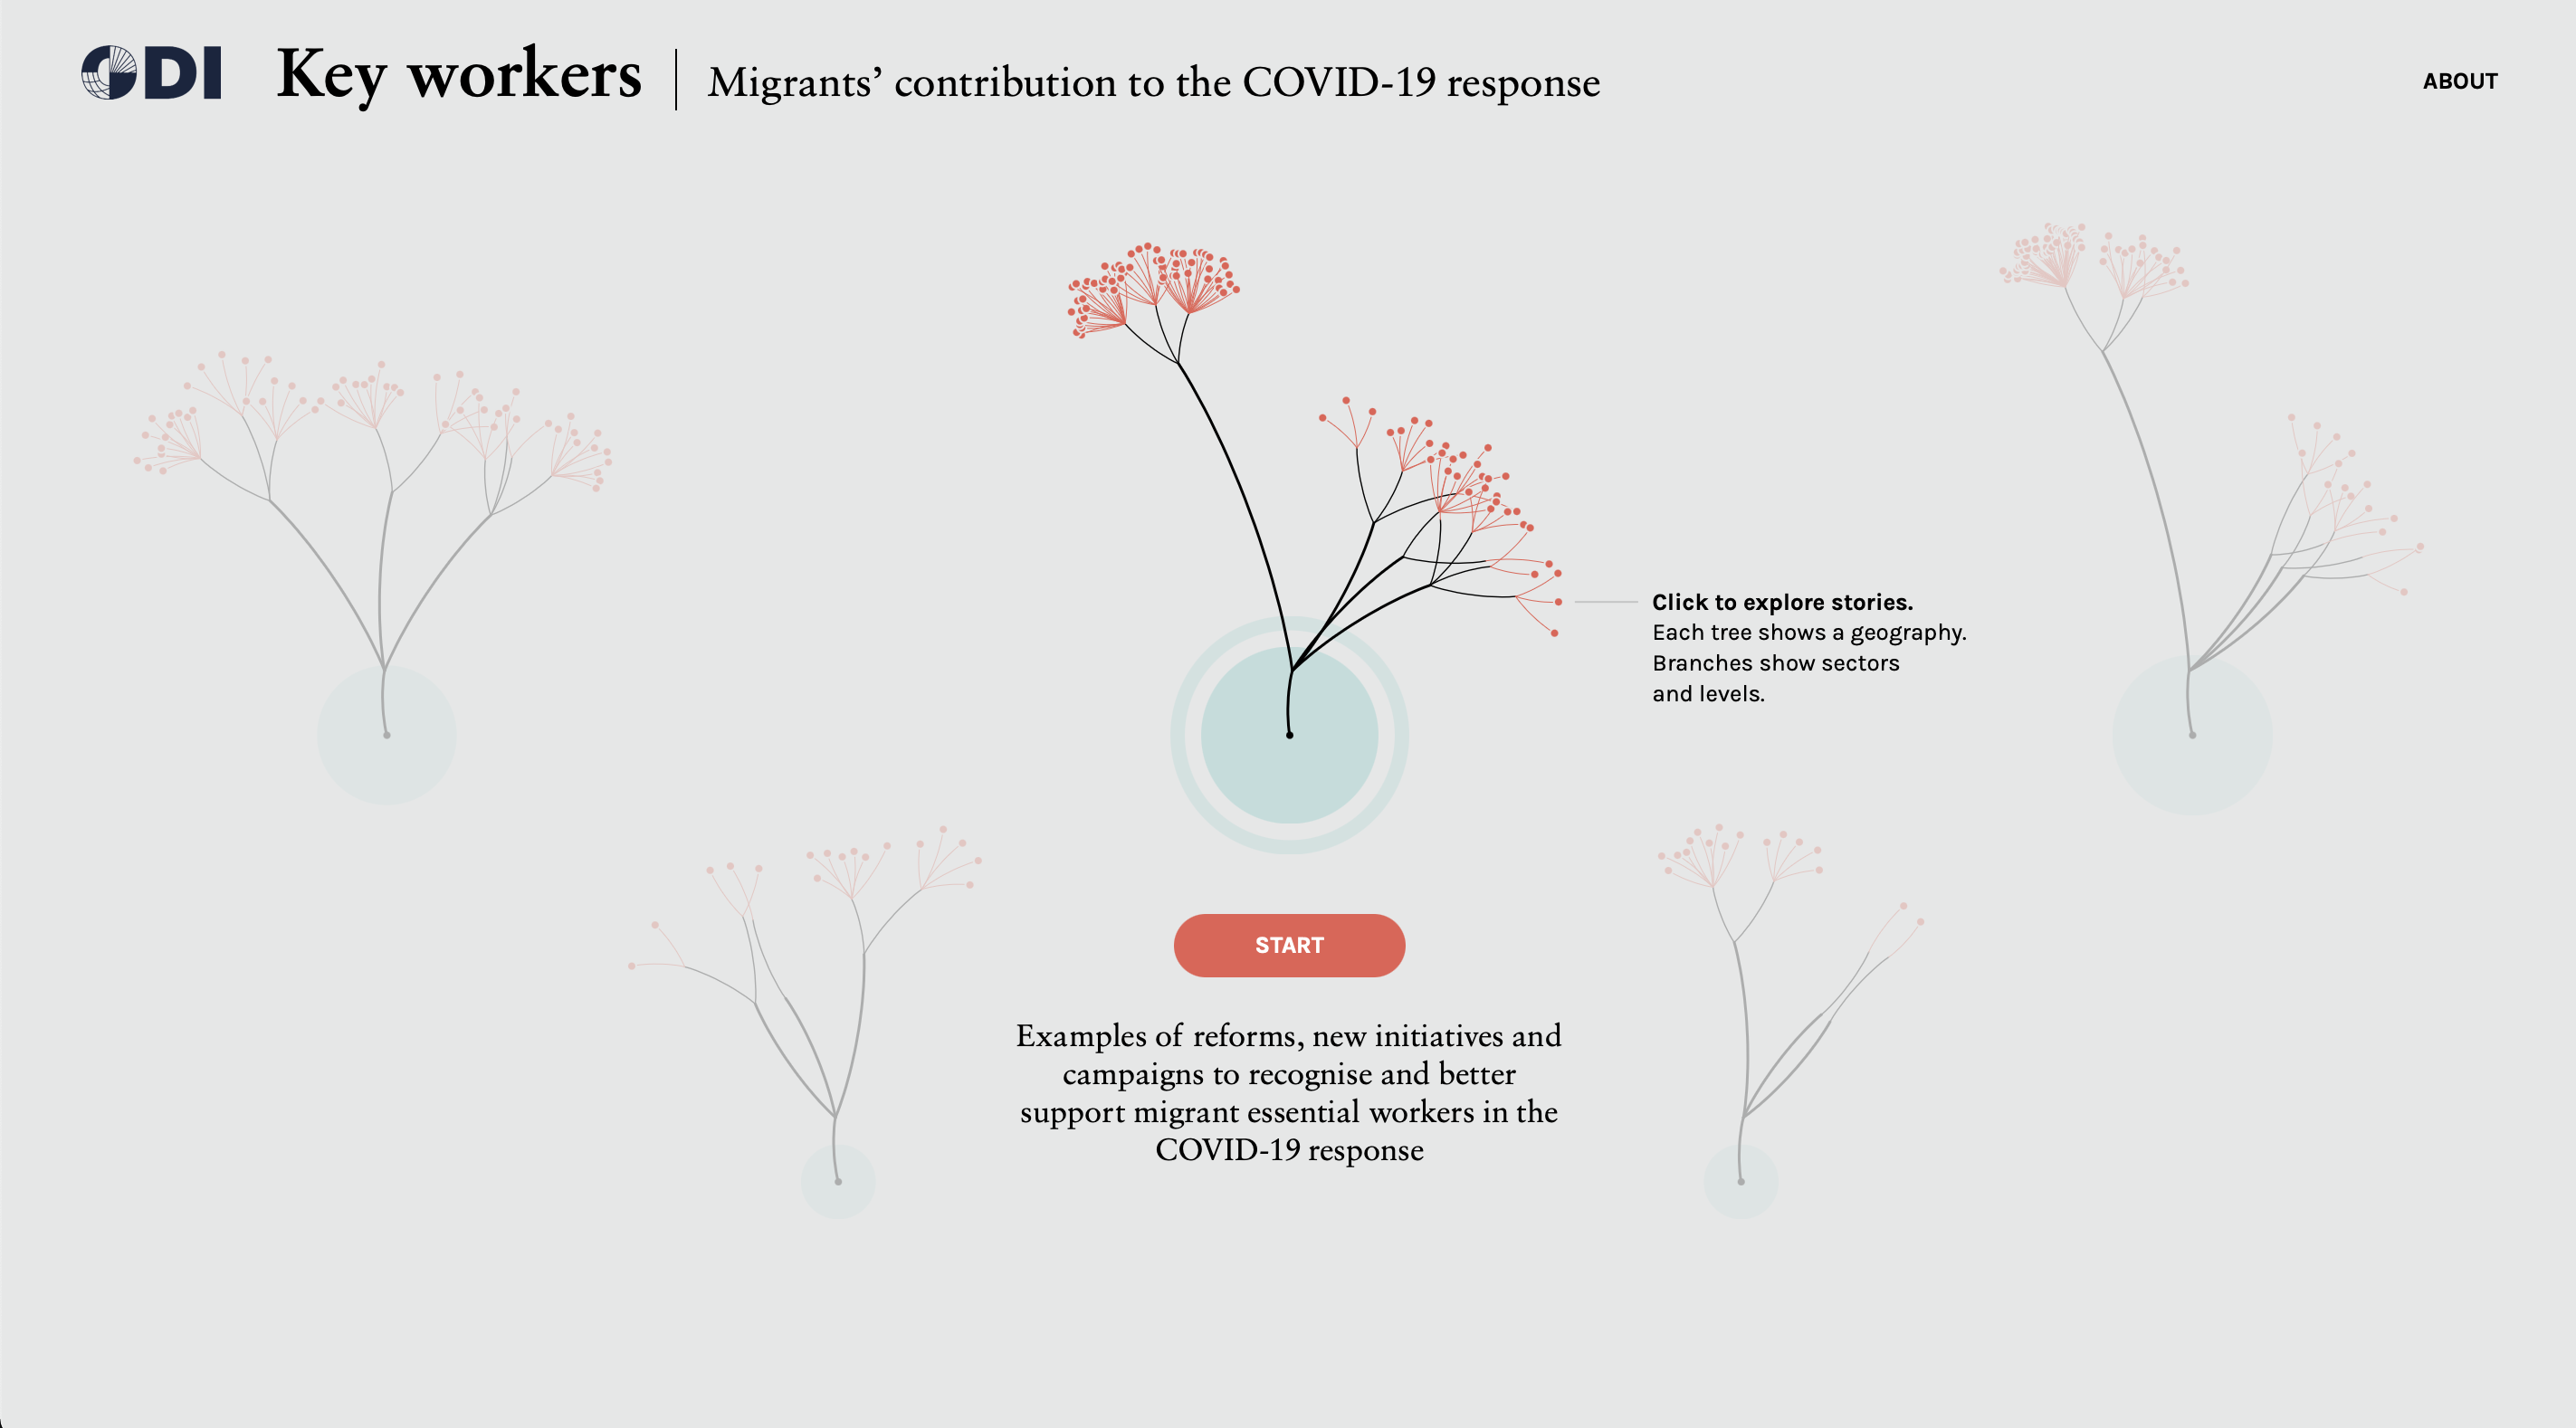
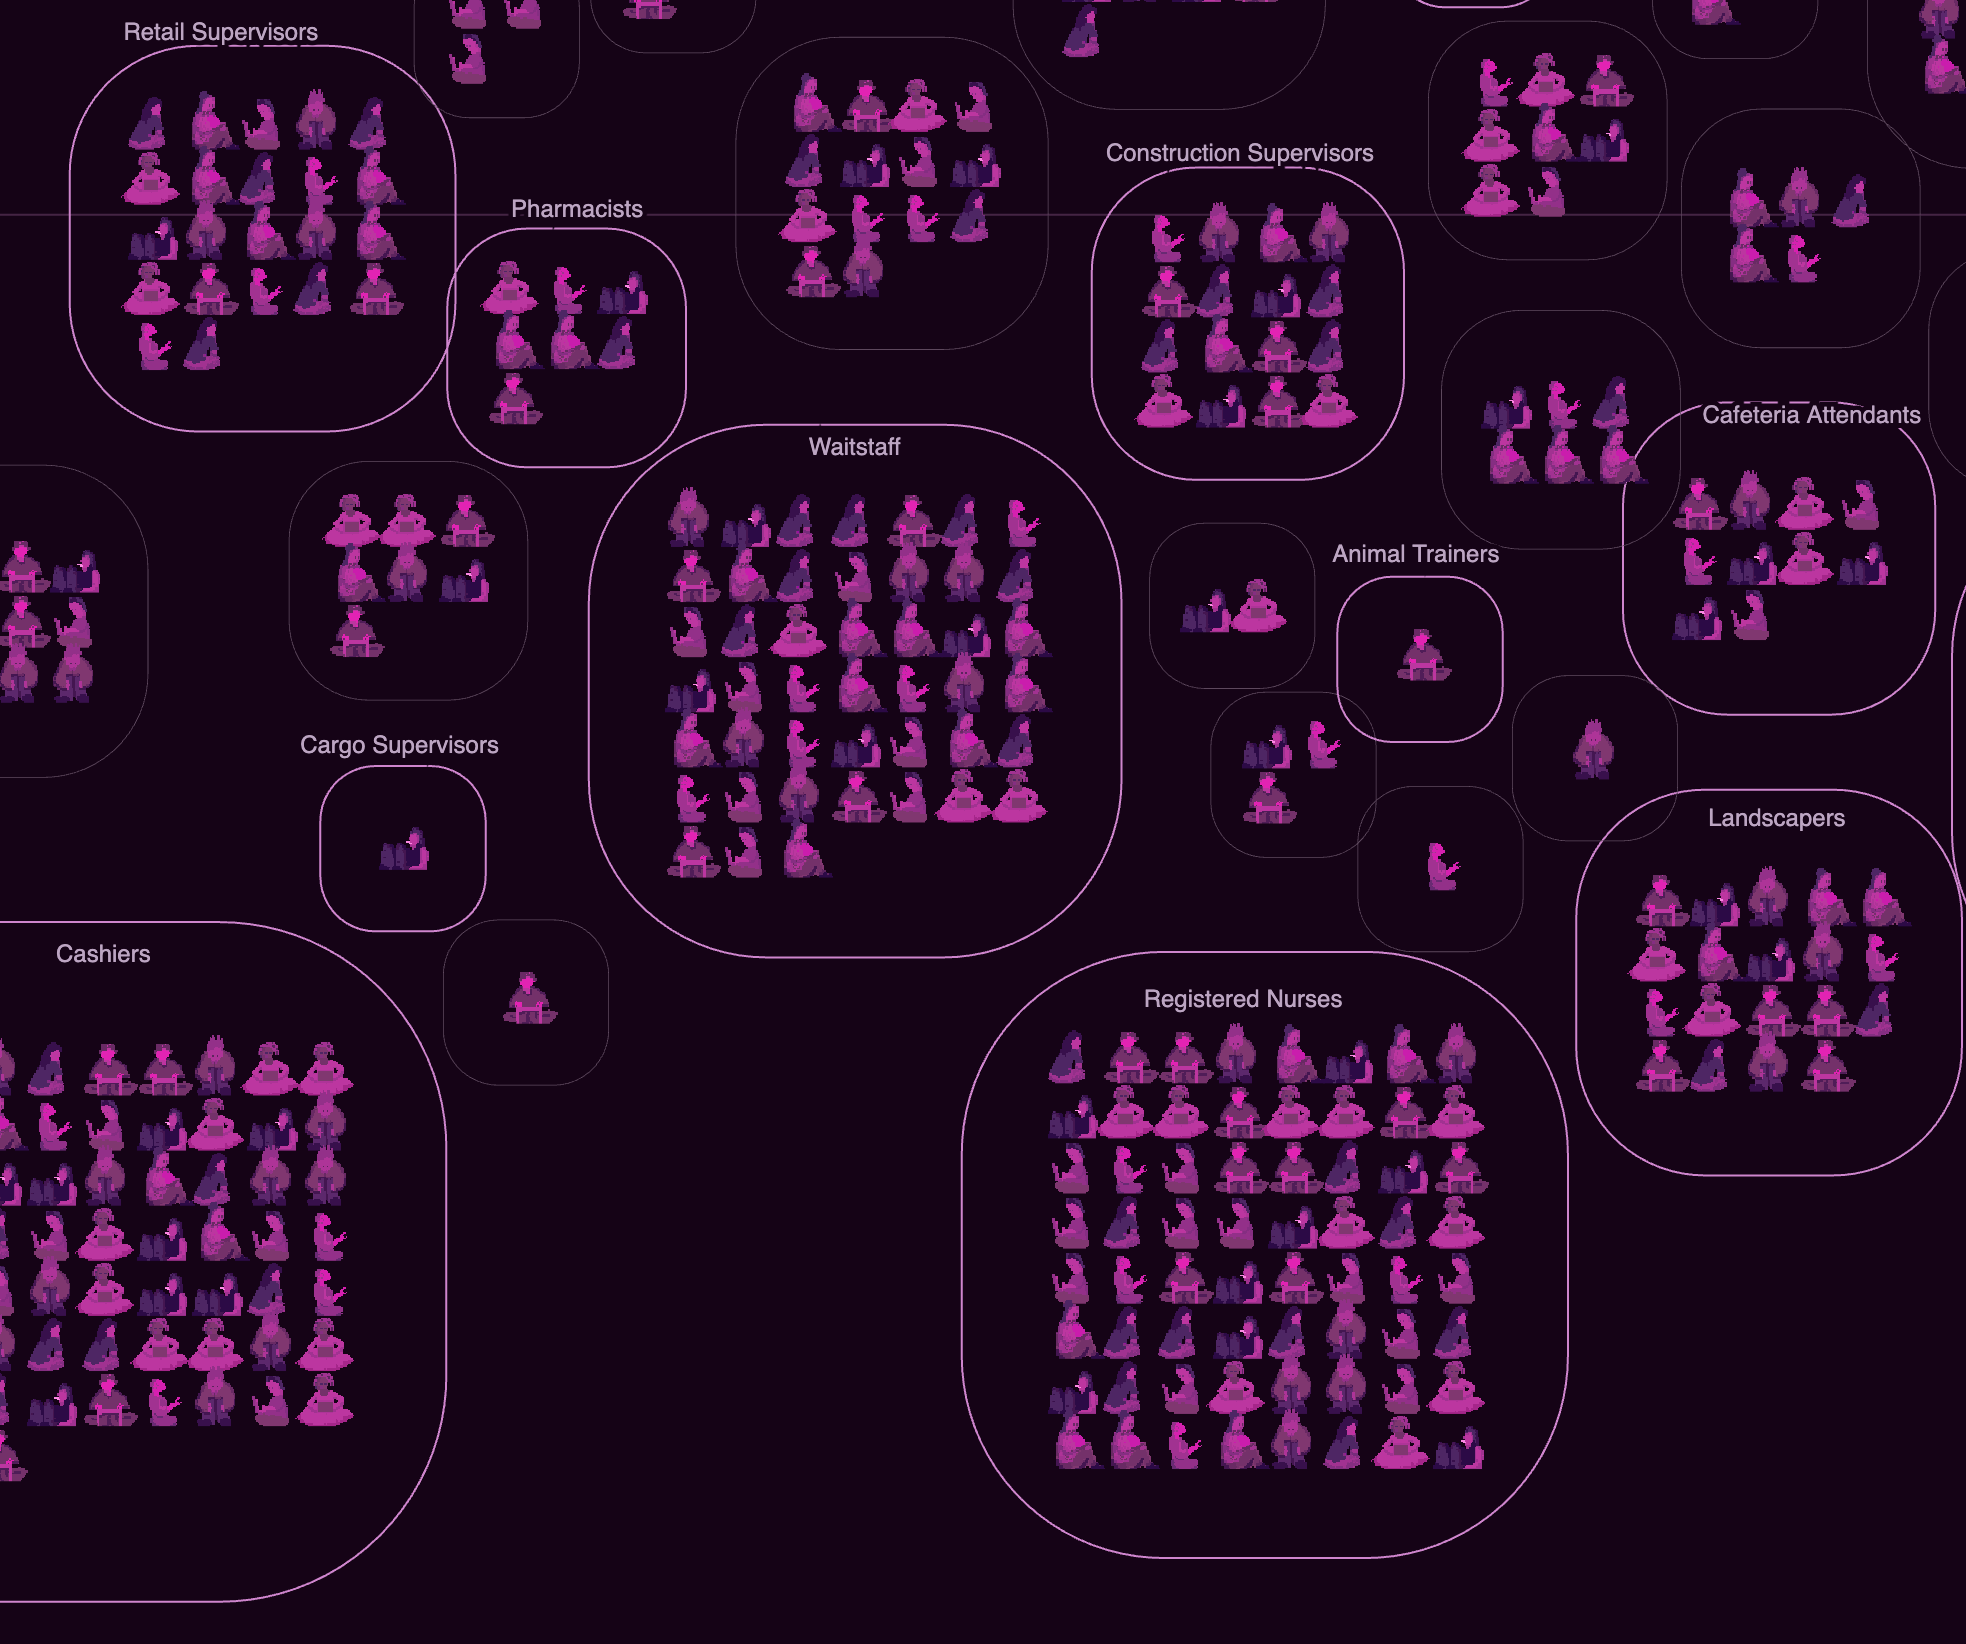
Key Workers
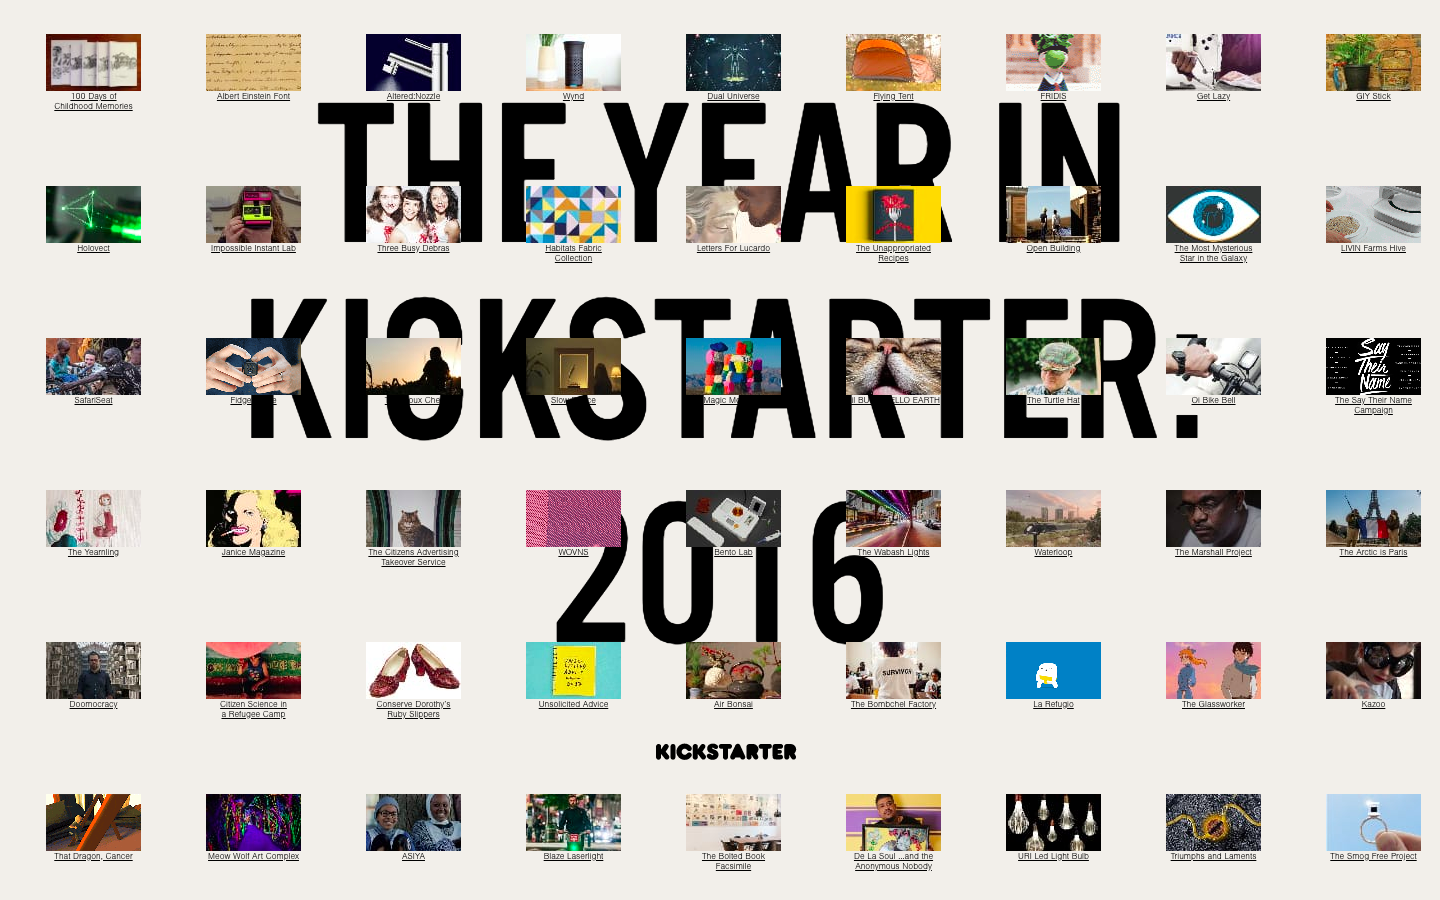
Kickstarter Review 2016

KiHealth
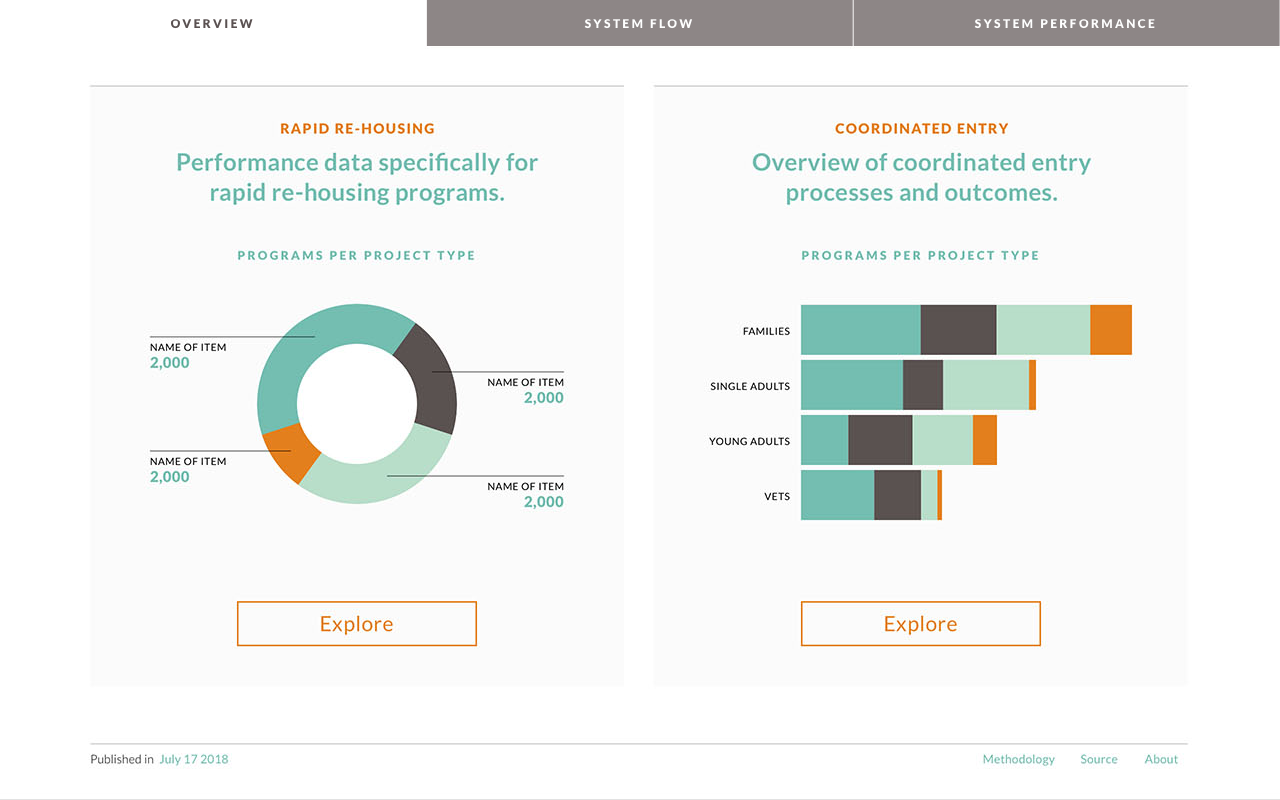
King County All Home Dashboard
Kite Locator
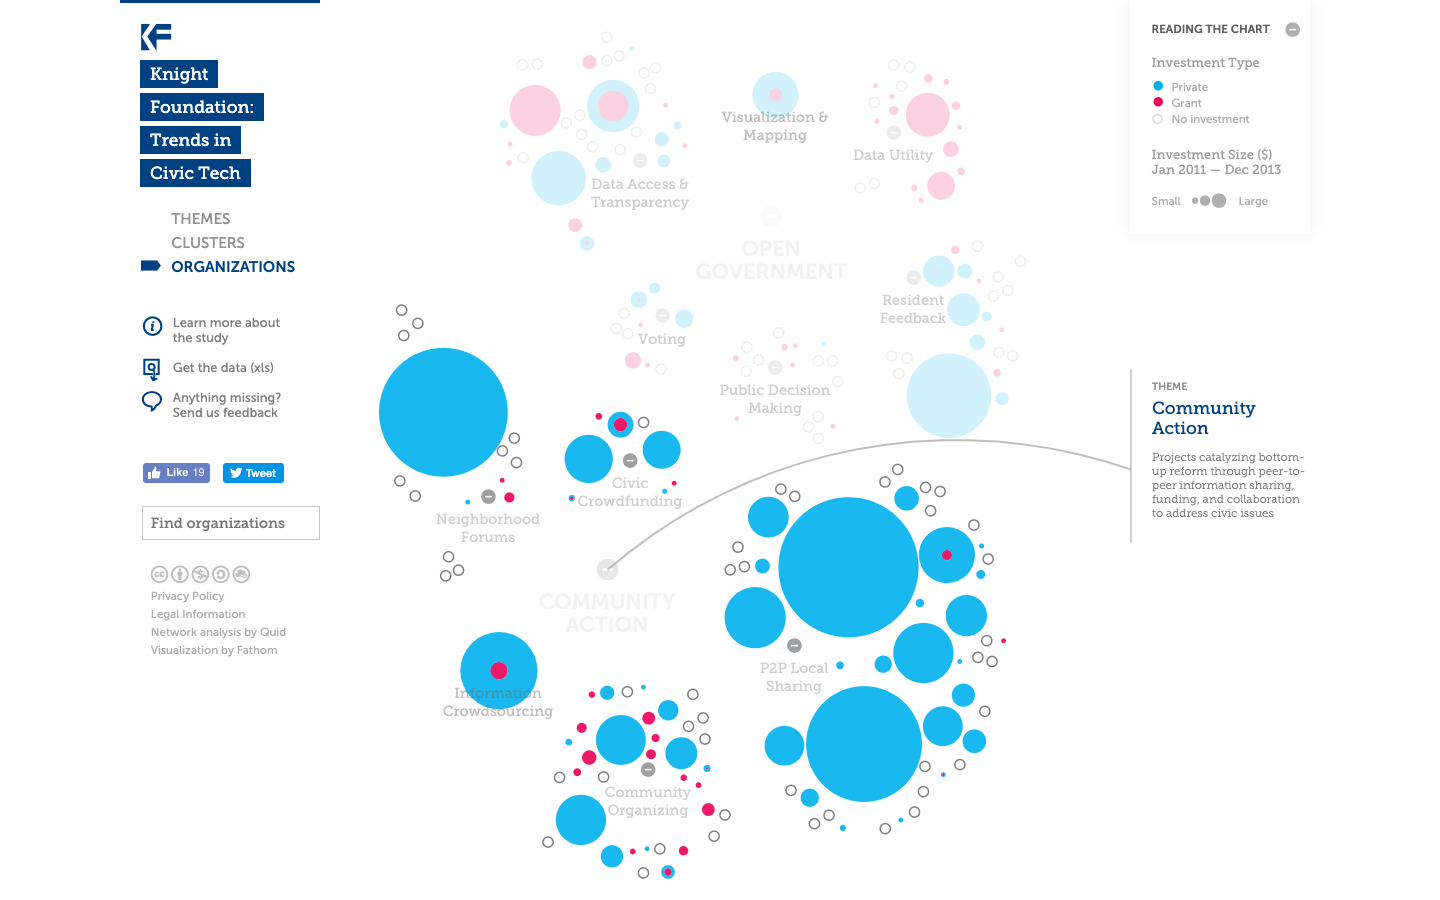
Knight Foundation Trends in Civic Tech 2013
Knight Foundation
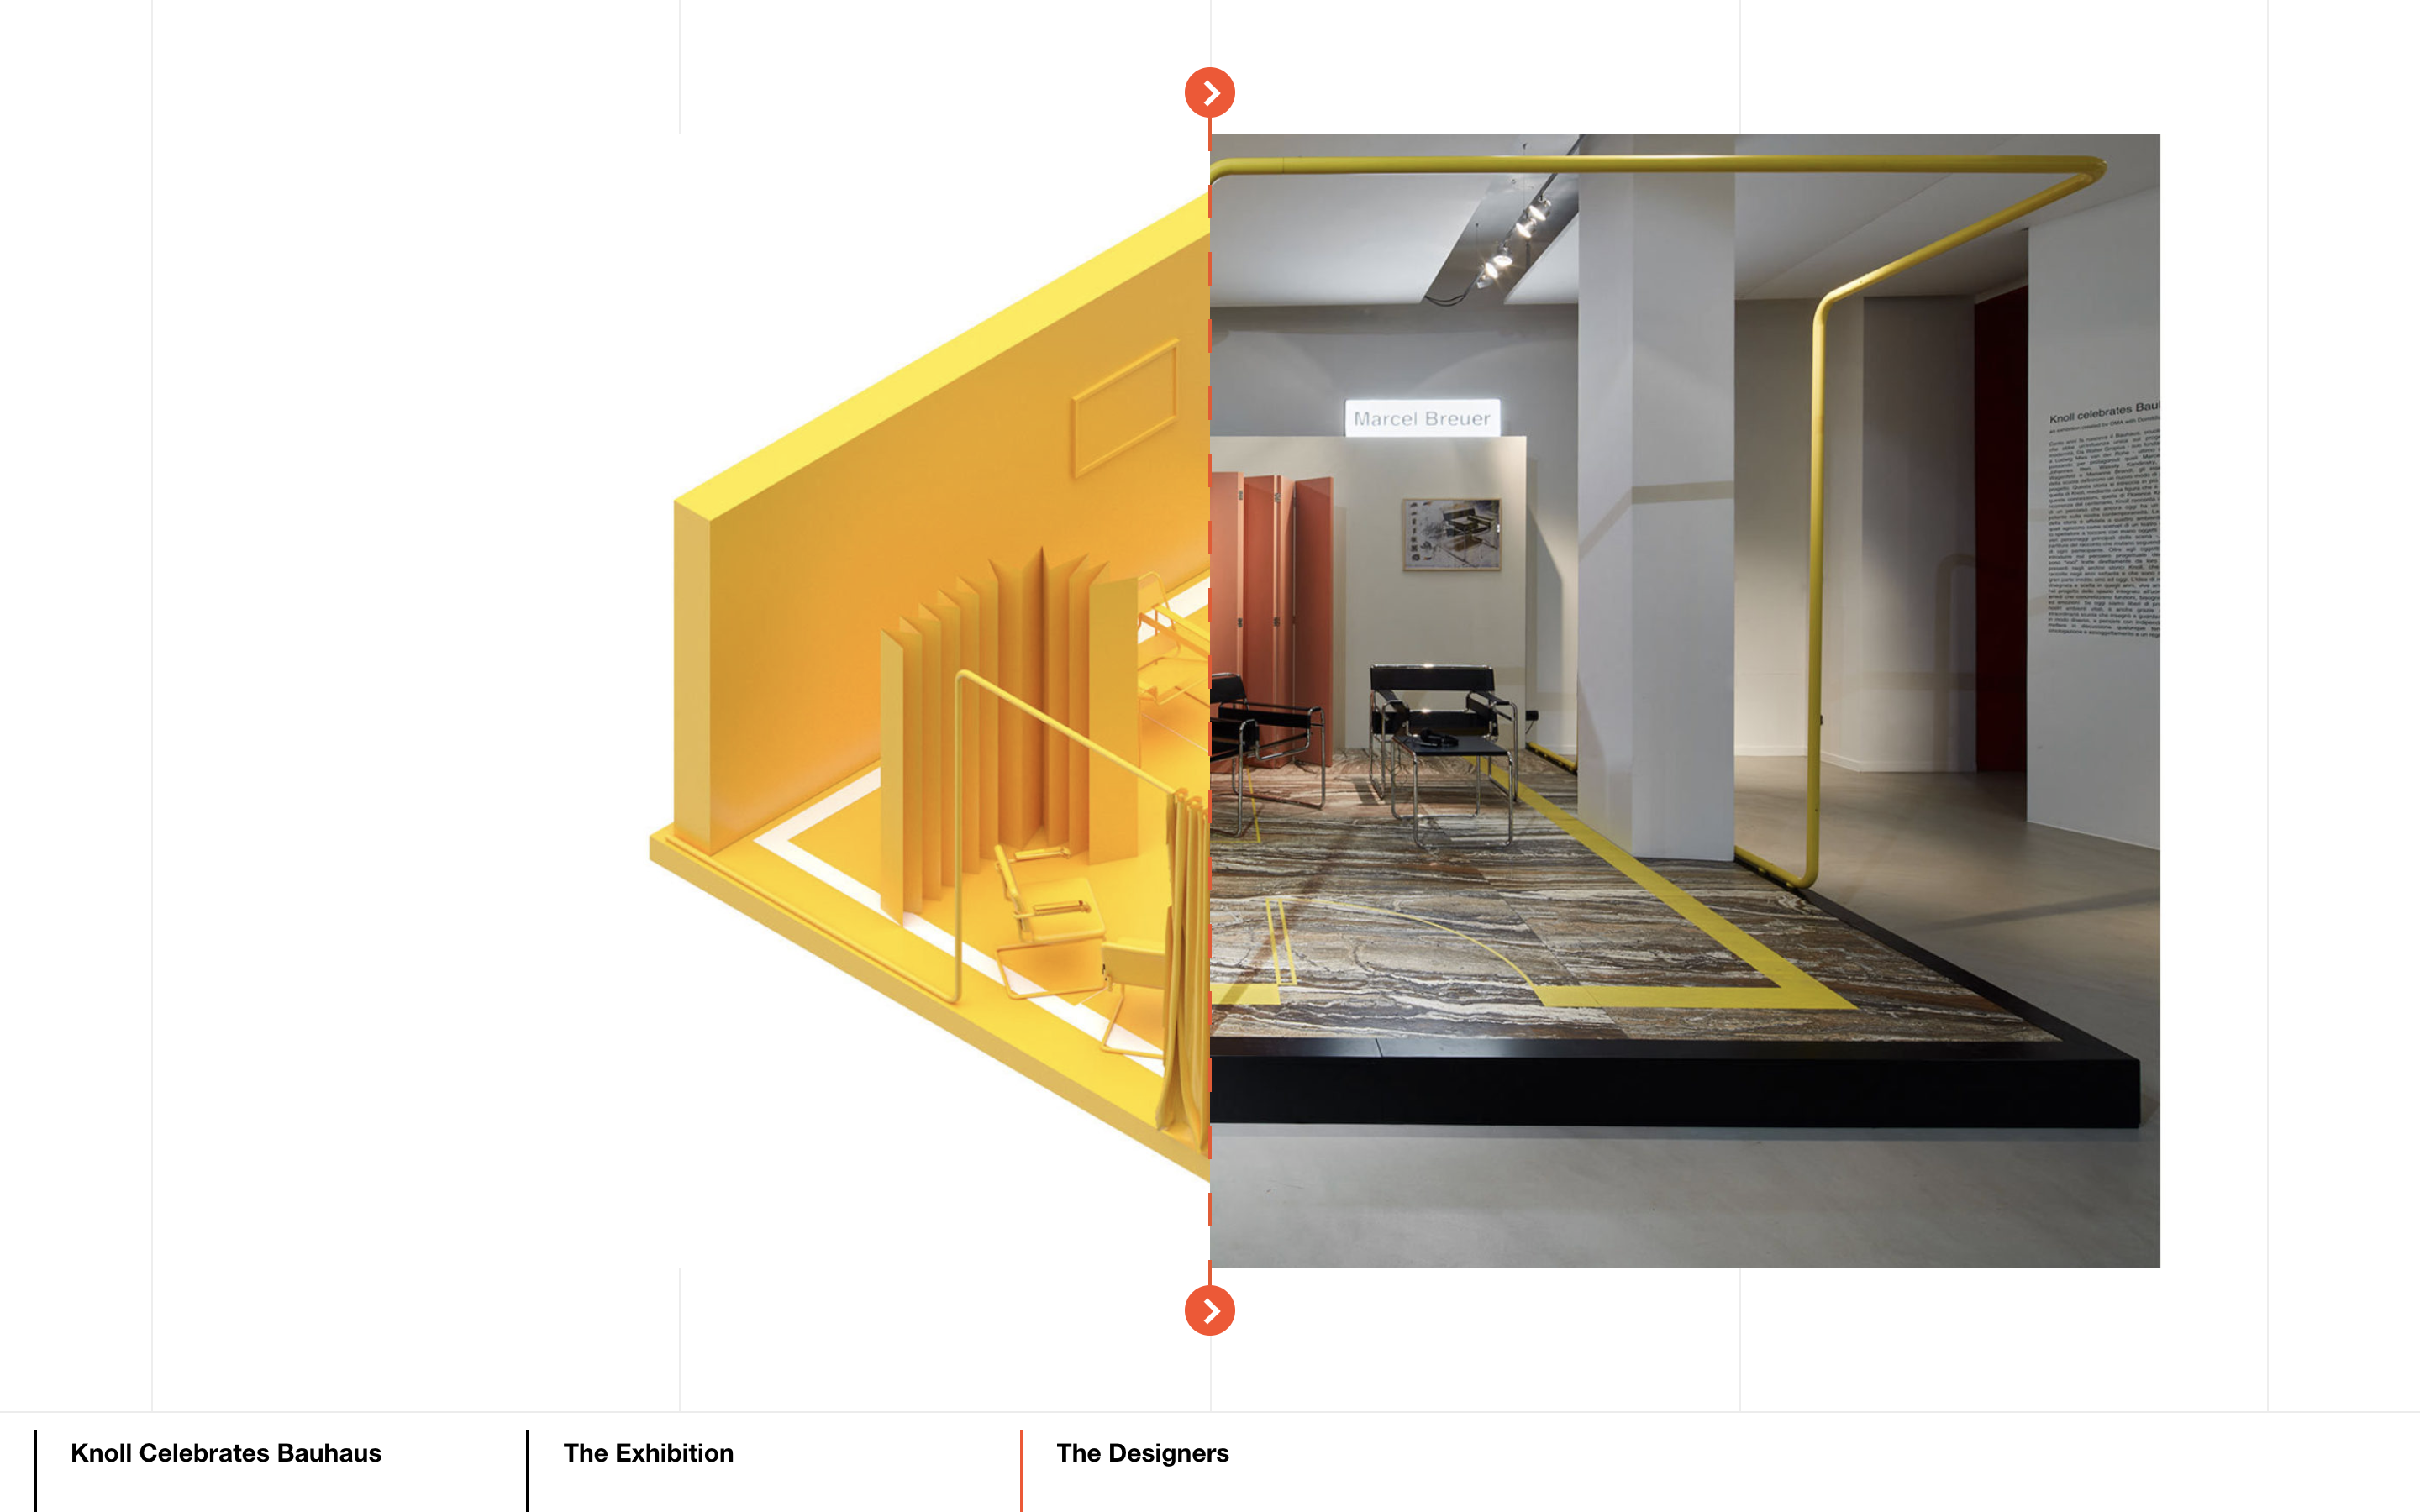
Knoll Archive
Schema Design
Knoll Digital Brochures
Schema Design

Knoll Pricelist
Schema Design
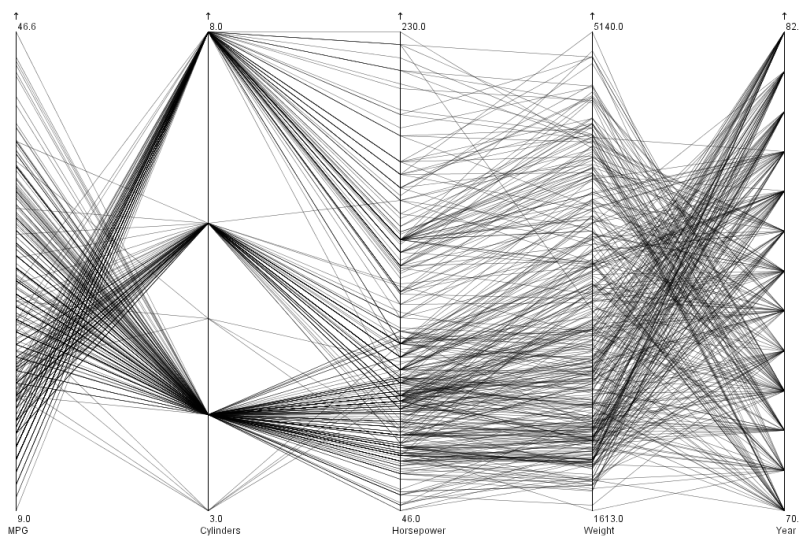
Kosara Parallel Projection
Robert Kosara
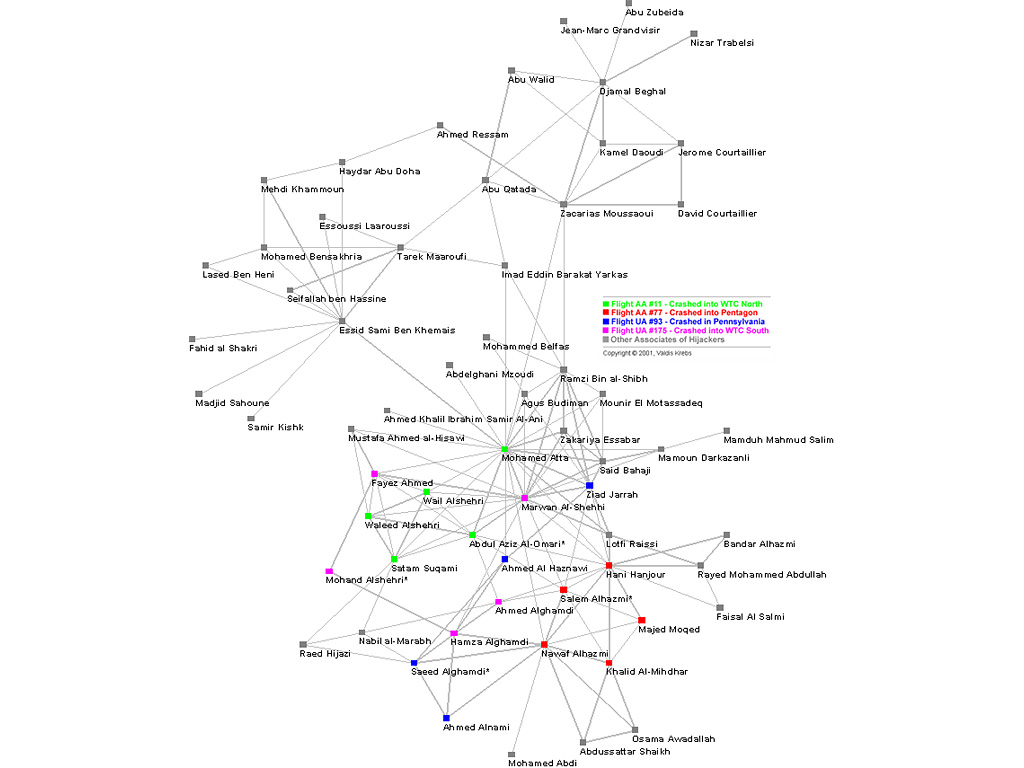
Krebs Hijackers Network
Valdis Krebs

Kudos Proof of Attendance Protocol for SXSW (POAP)
Schema Design

Kühl & Han
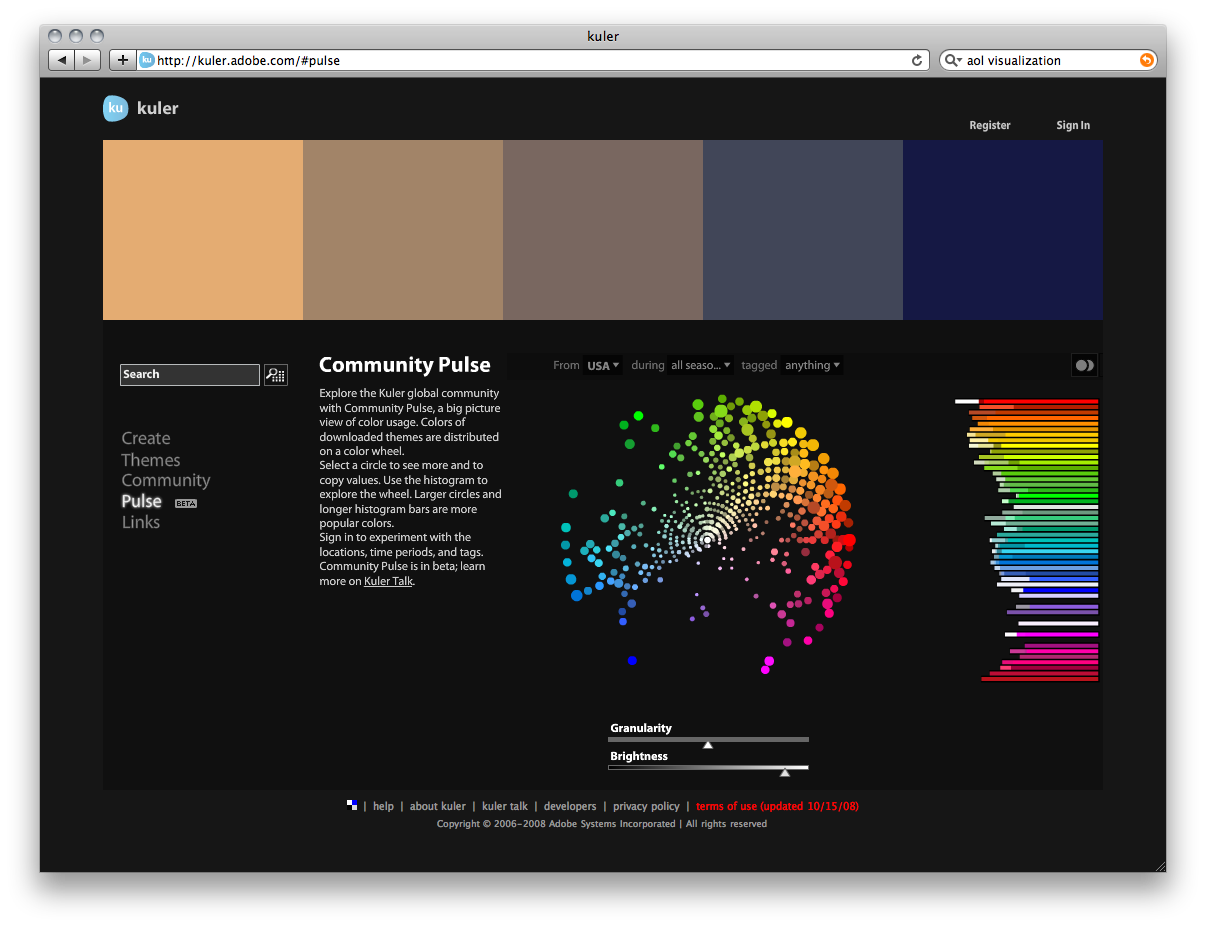
Kuler Color Maps
Stamen Design
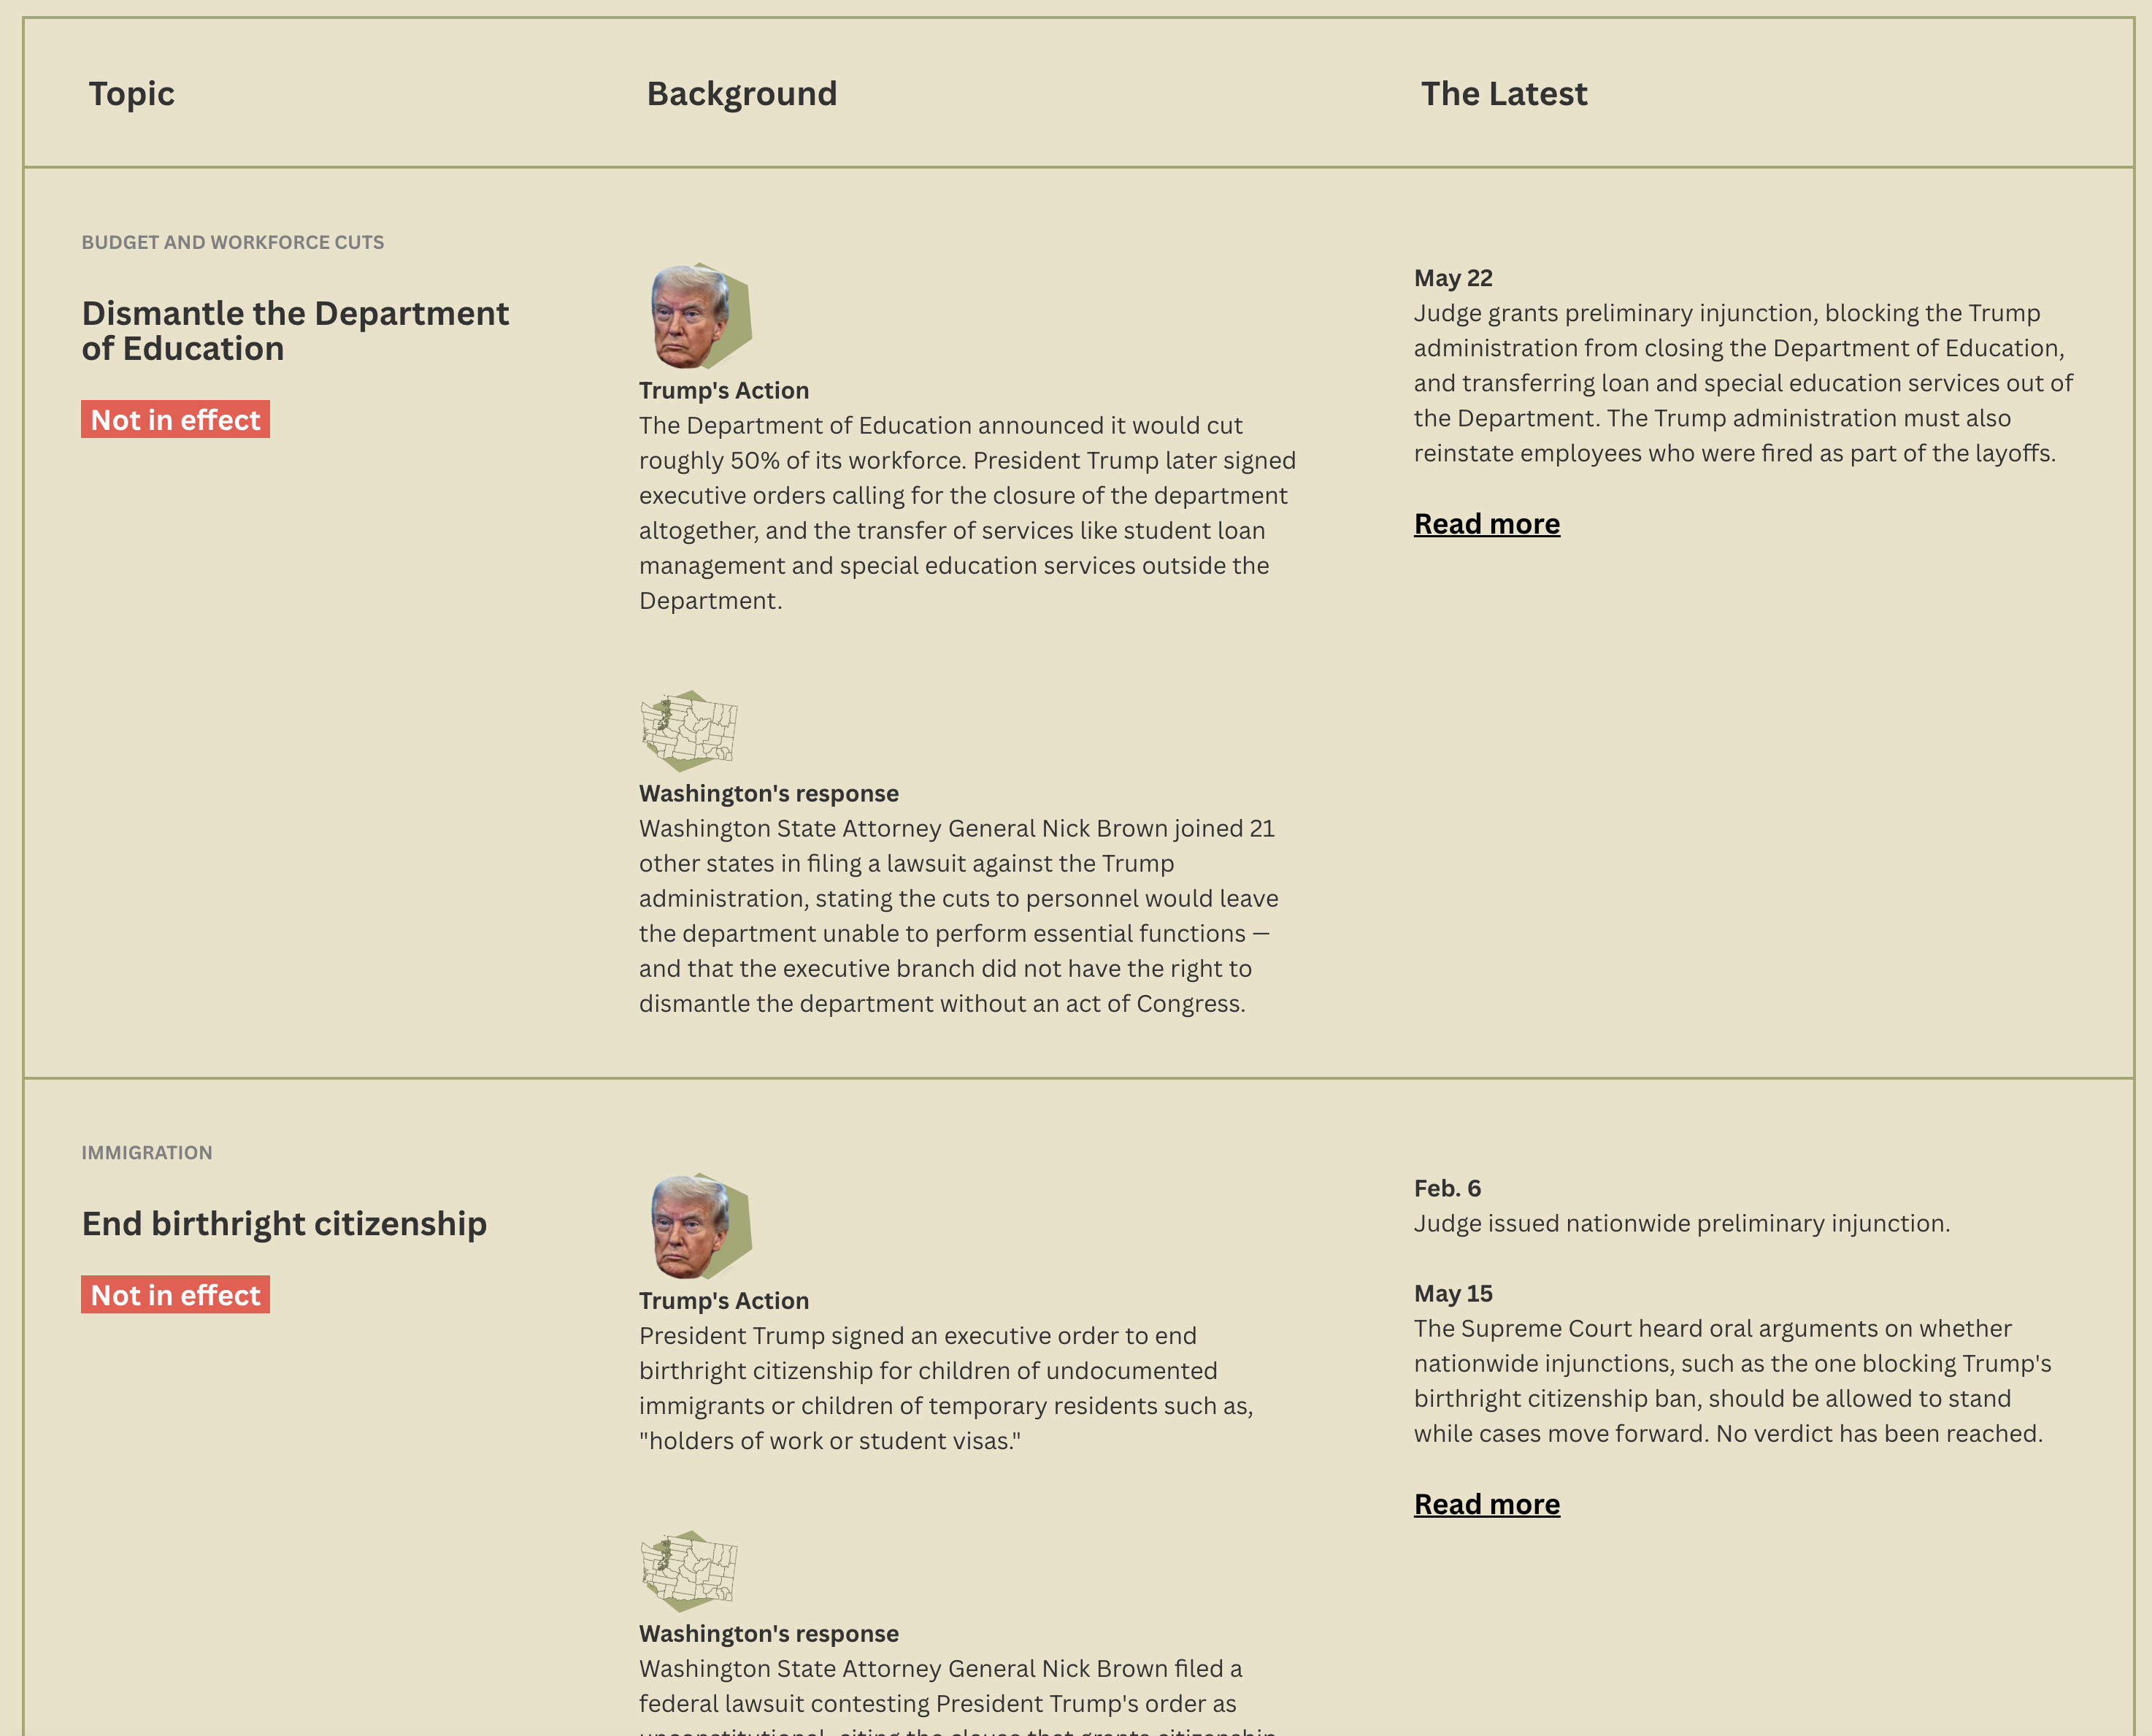
KUOW - Trump Tracker
NPR
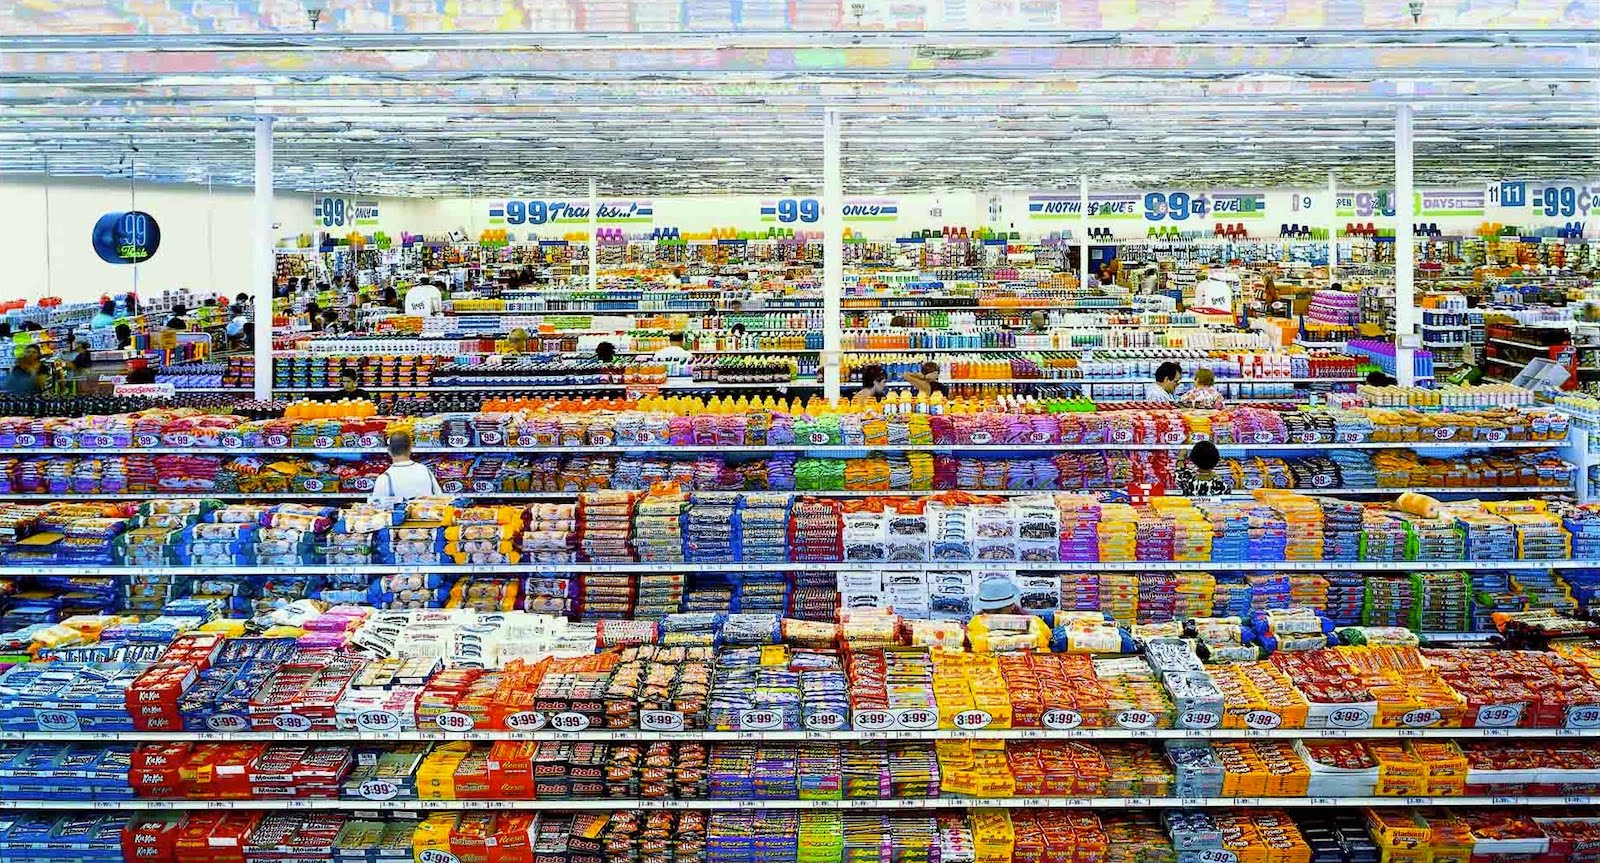
Large-Scale Photographs
Andreas Gursky

Last Clock
Jussi Ängeslevä & Ross Cooper

Late Night Triad
Jason Salavon

Laura Kurgan Projects
Laura Kurgan
Legislative Explorer: U.S.
Schema Design
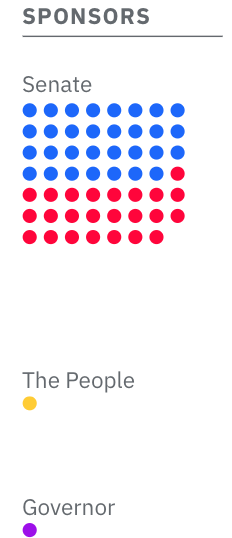
Legislative Explorer: Washington State
Schema Design
Leisure Arts Is The New
Leisure Arts
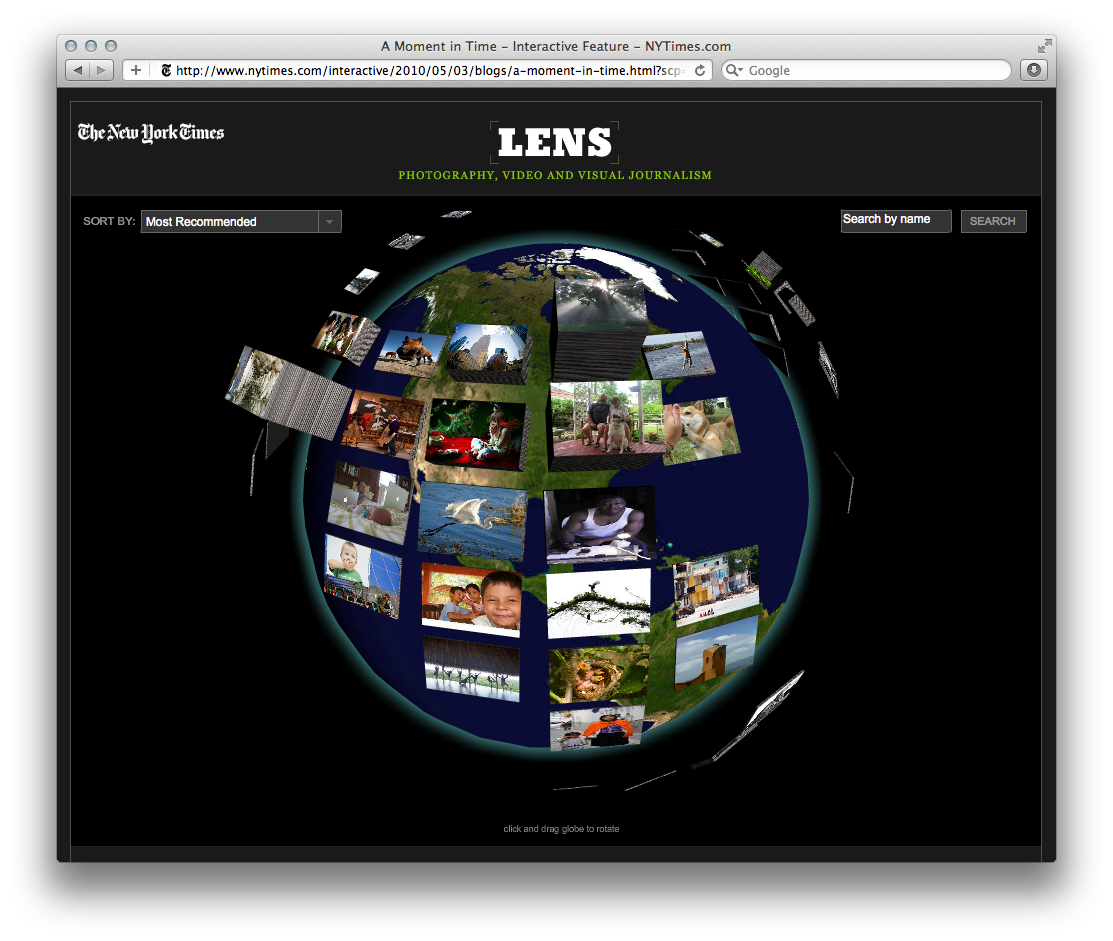
Lens
New York Times
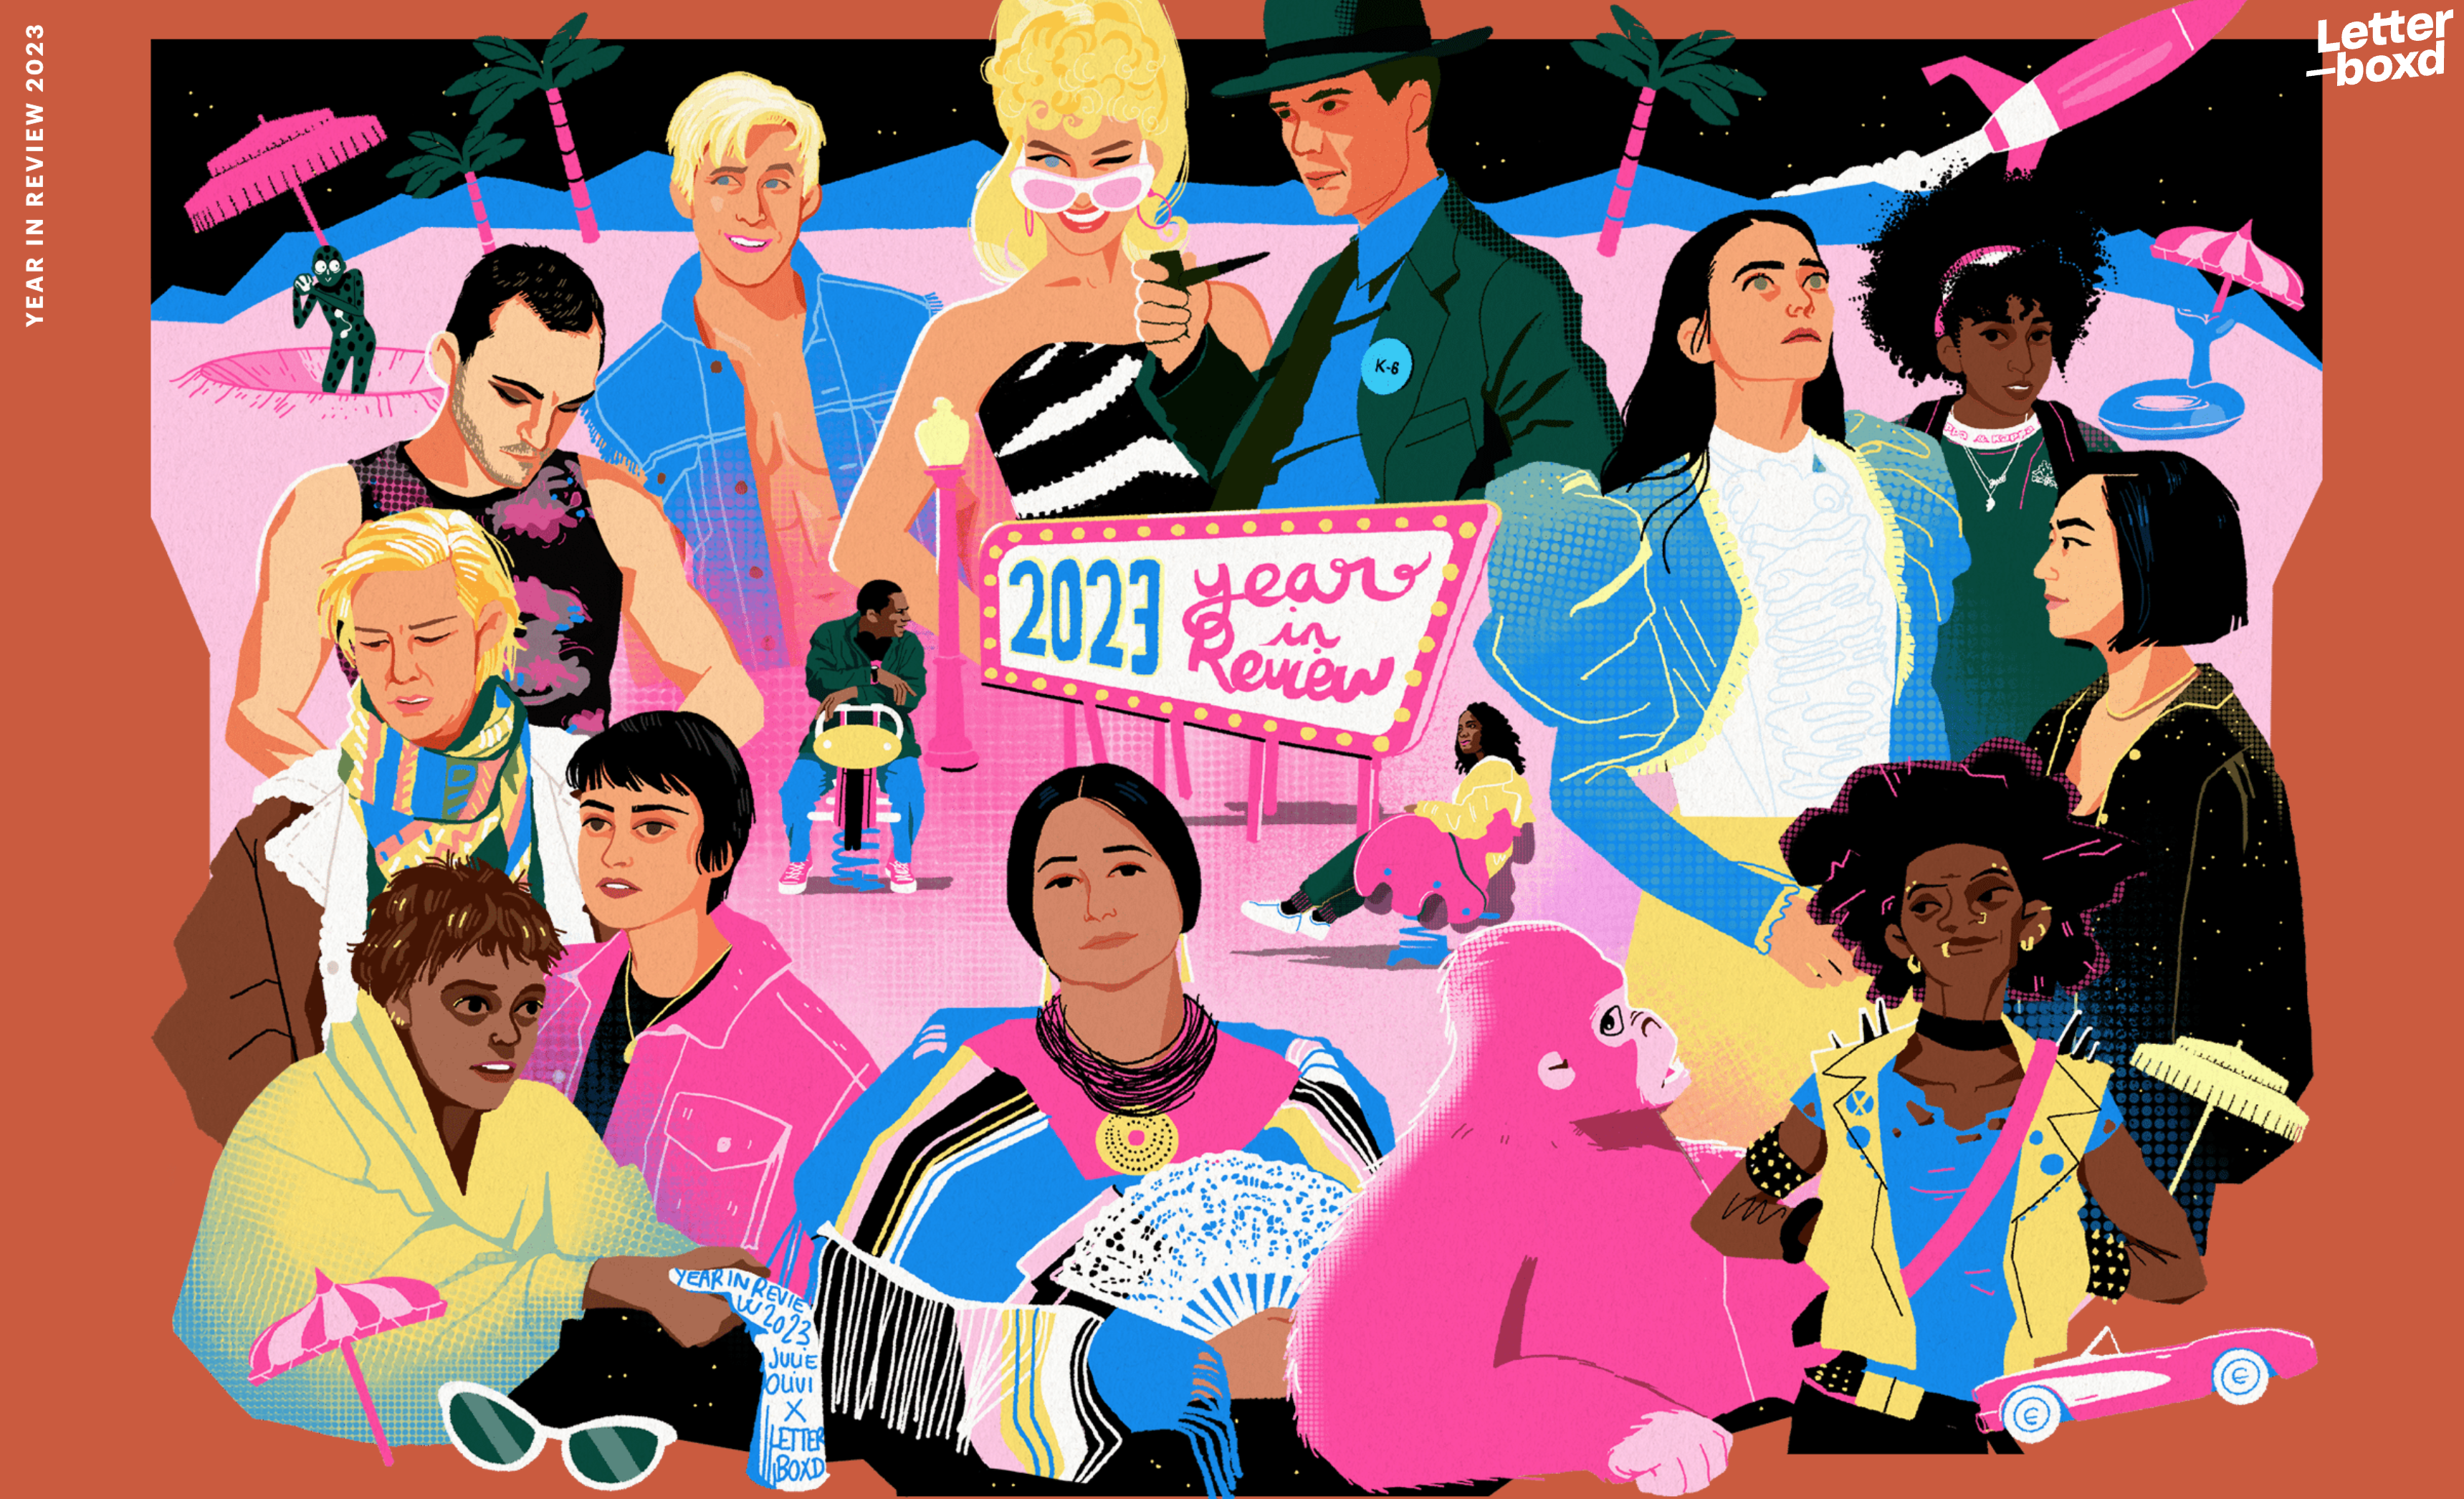
Letterboxd Year in Review 2023
Letterboxd
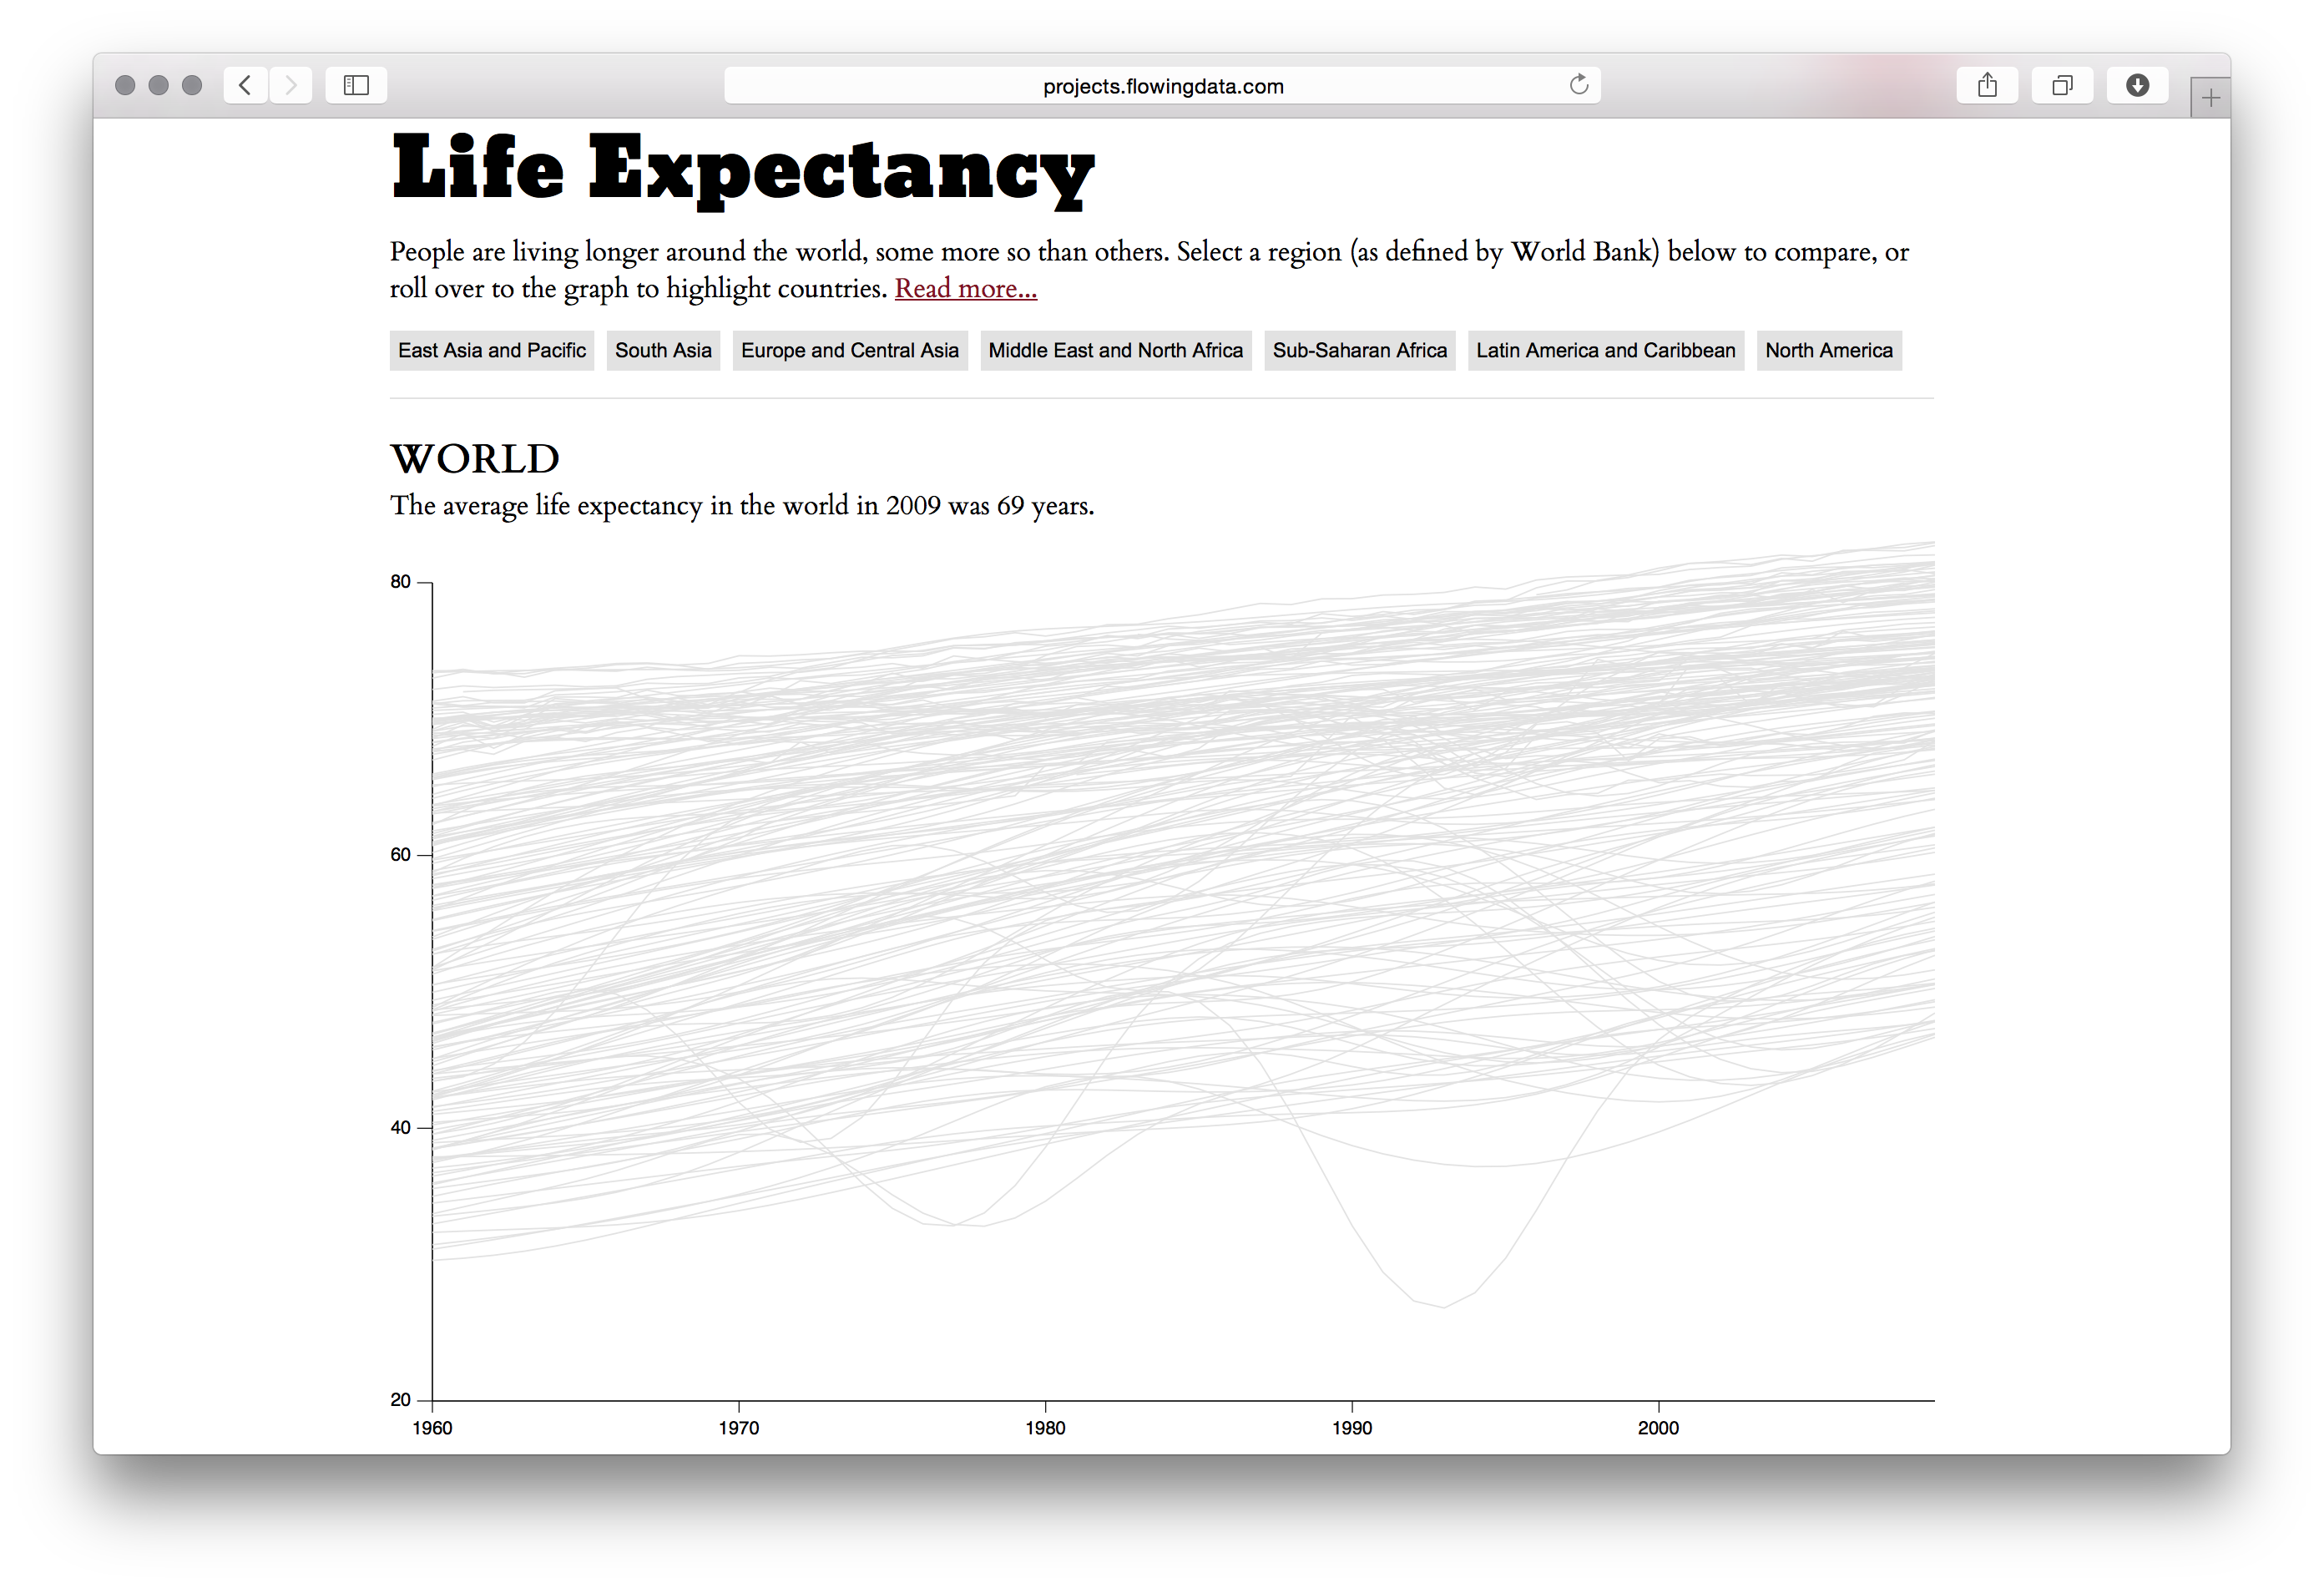
Life Expectancy
Nathan Yau / Flowing Data

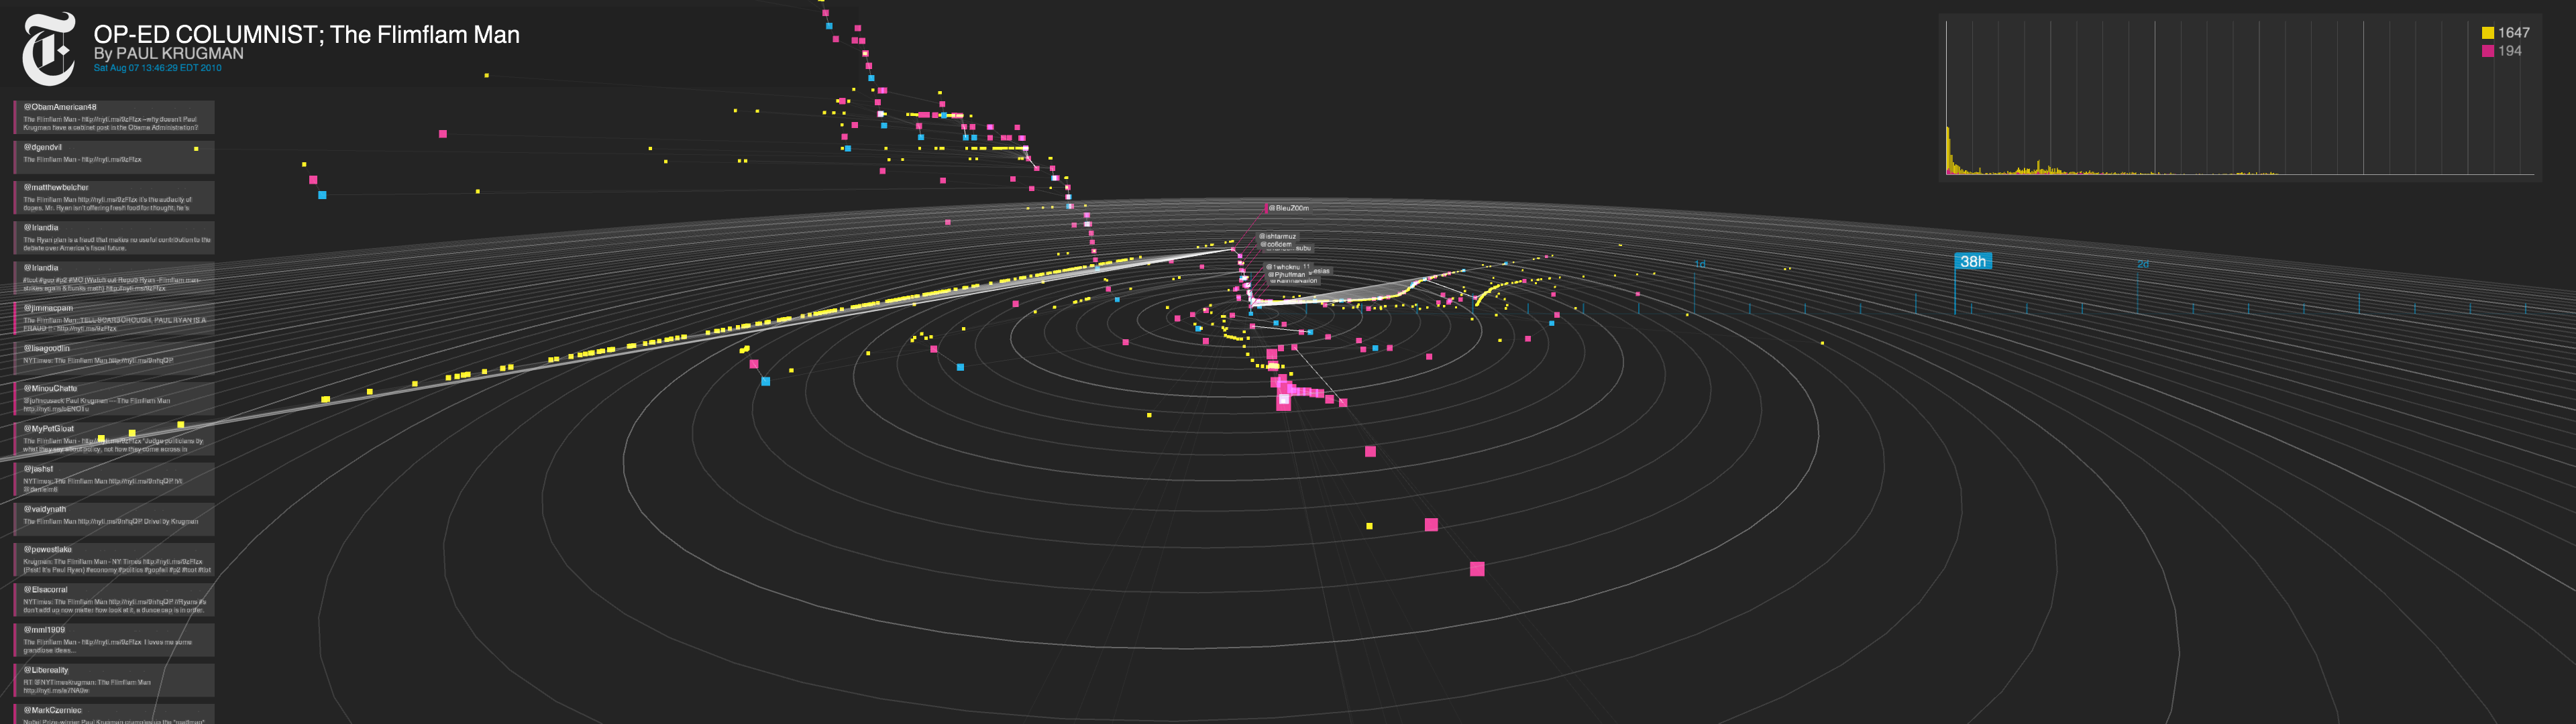
Lifespan of News

Lin Vietnam Memorial
Maya Lin
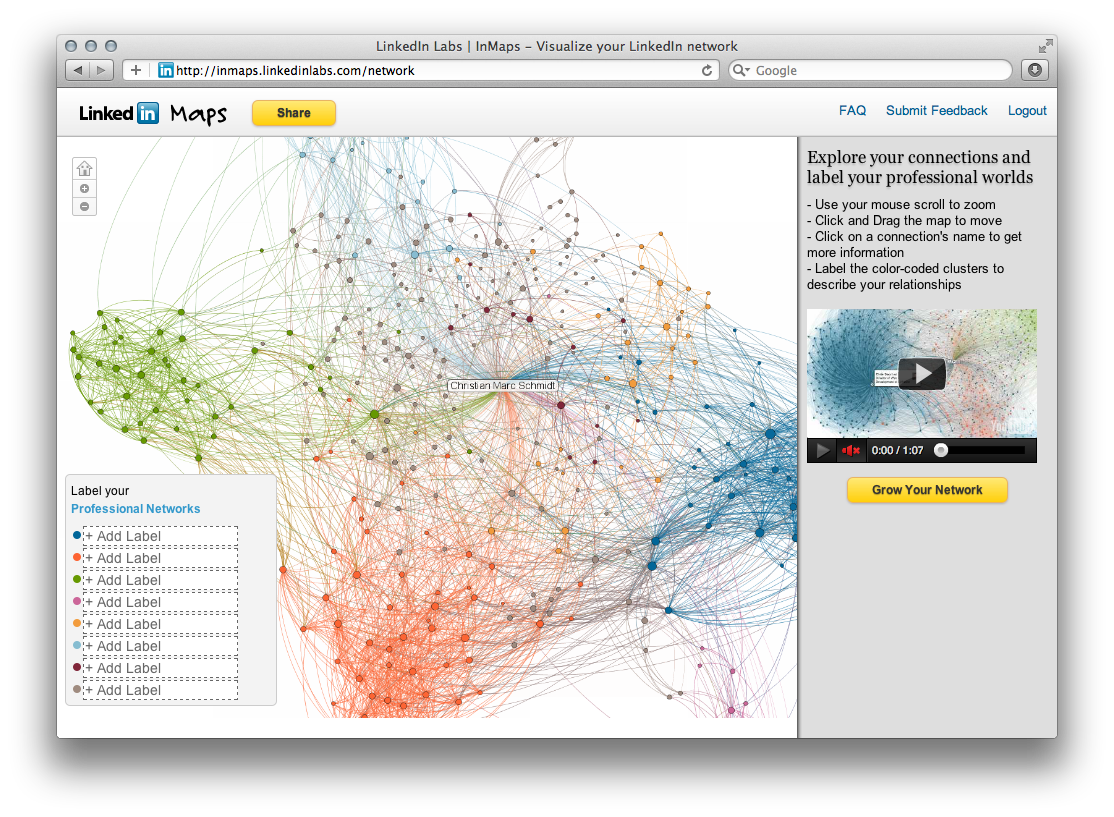
Linked In Labs In Maps
LinkedIn Labs
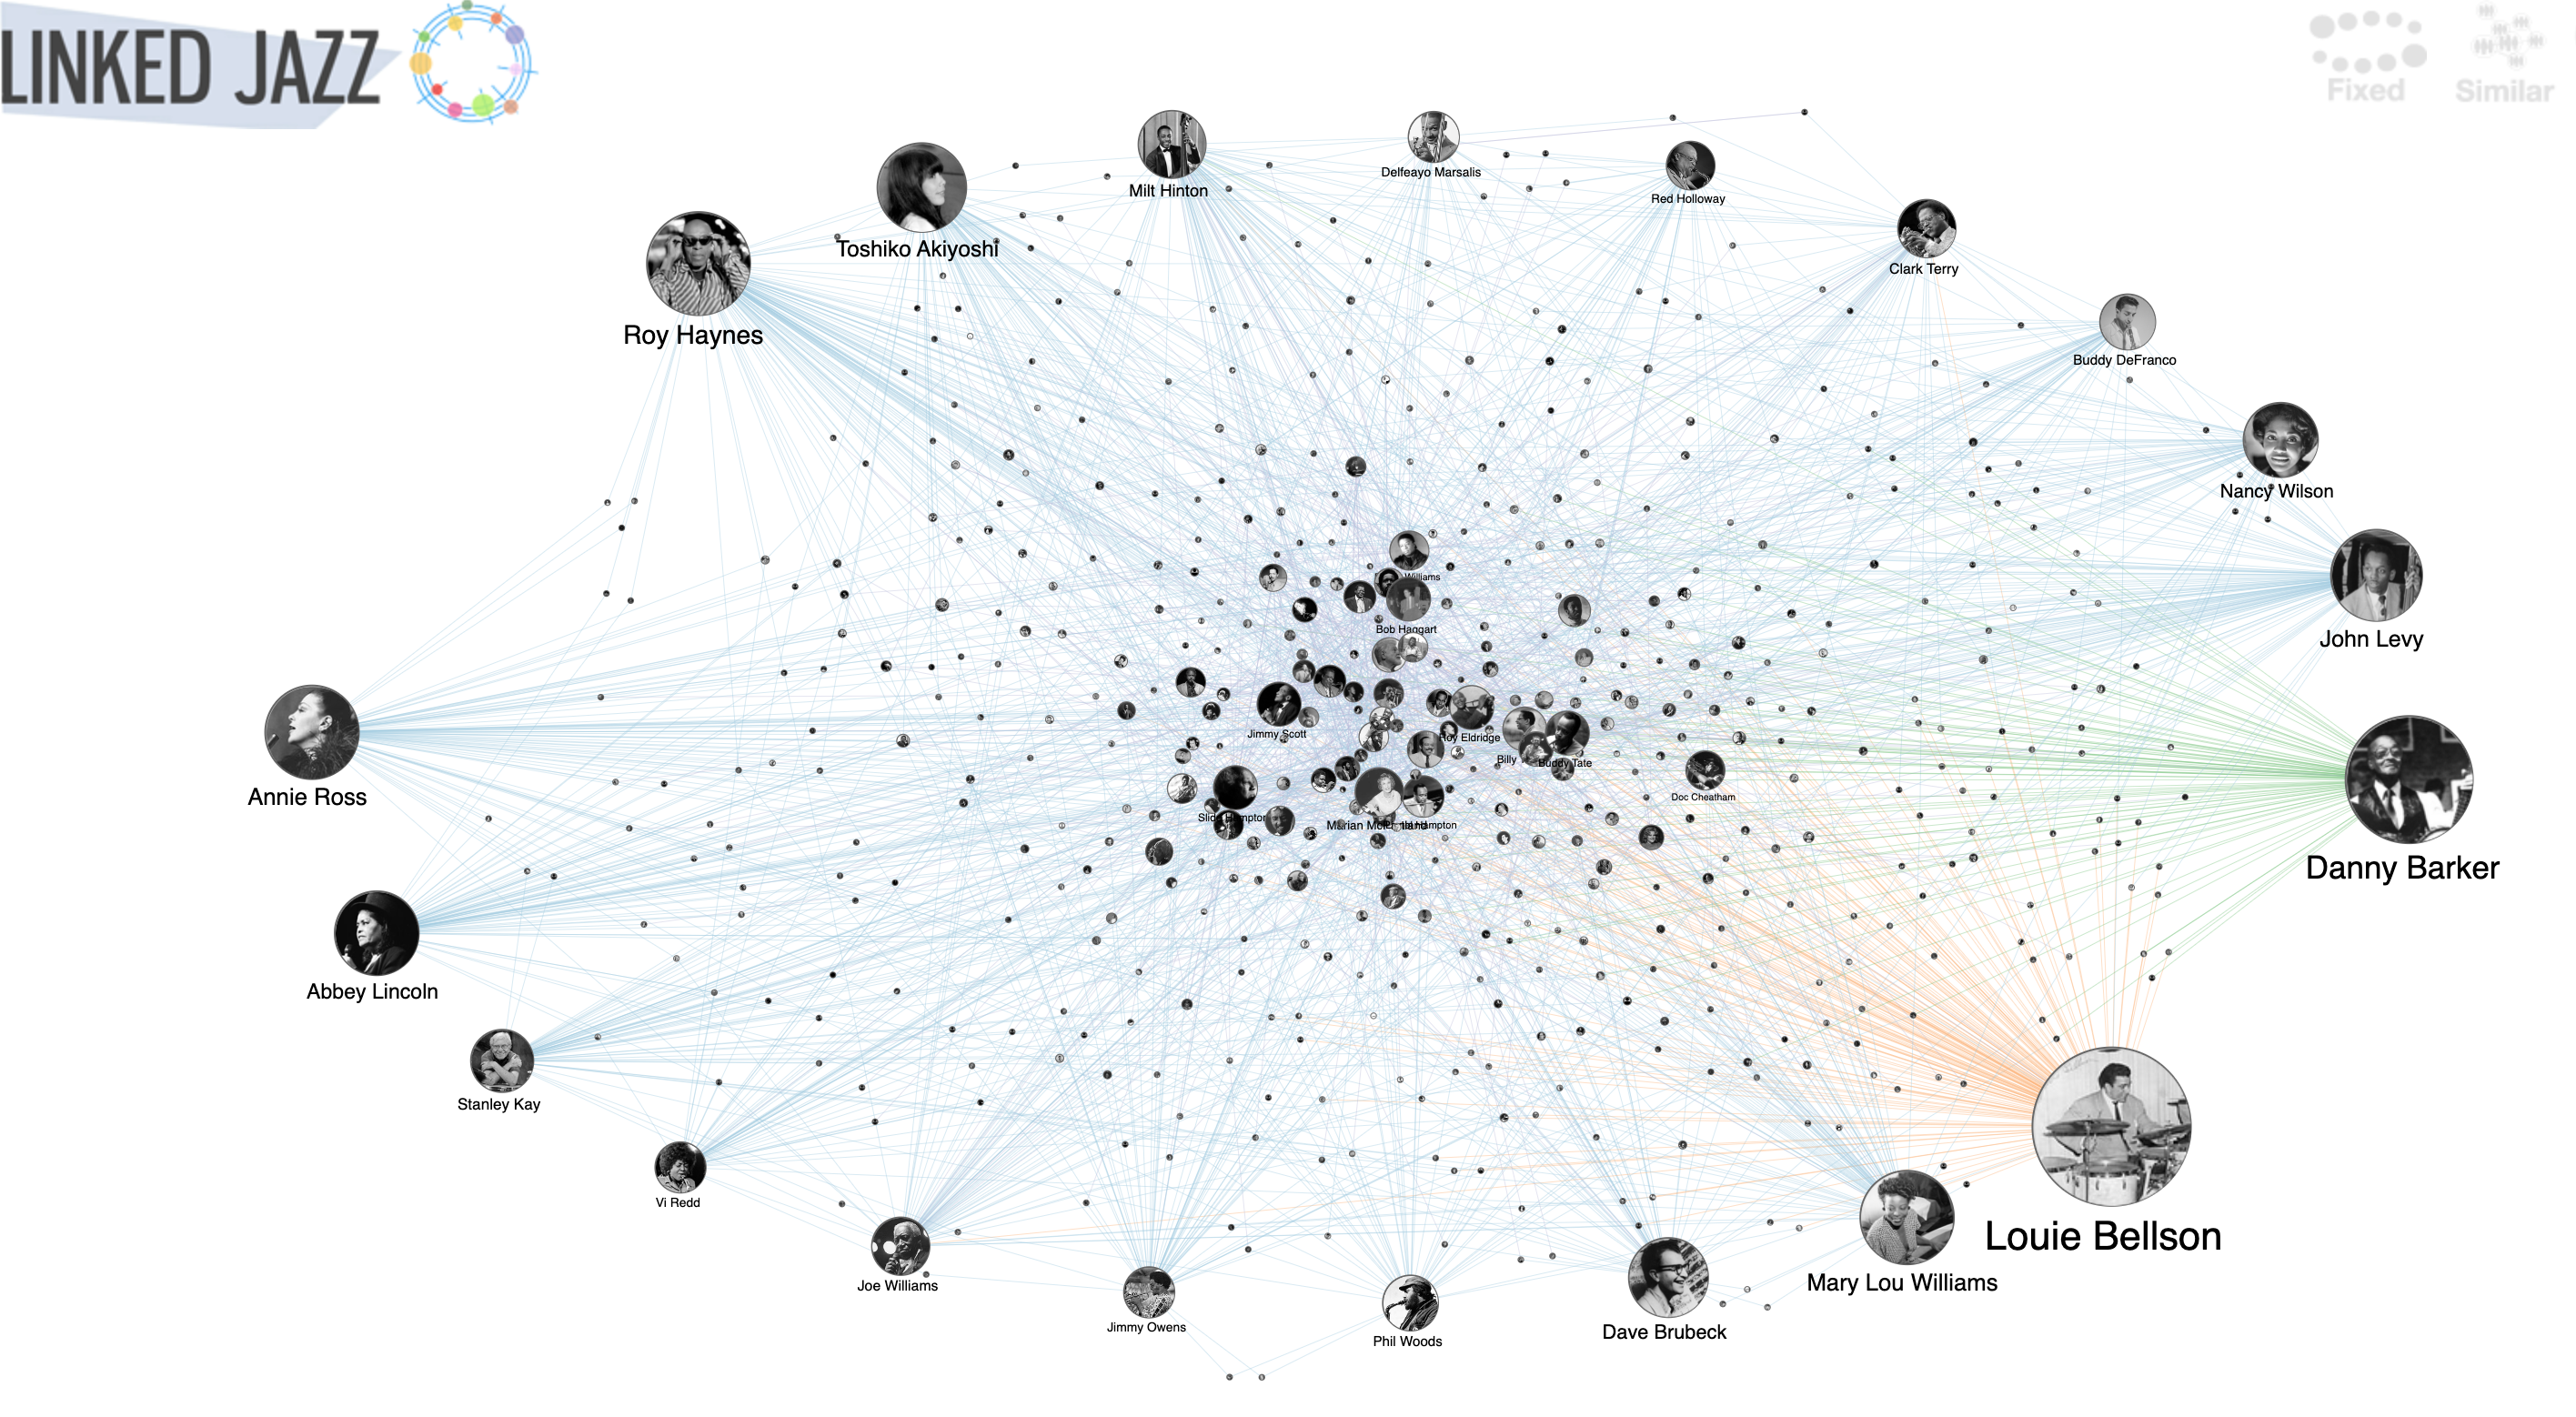
Linked Jazz
Lisa Strausfeld Projects
Lisa Strausfeld
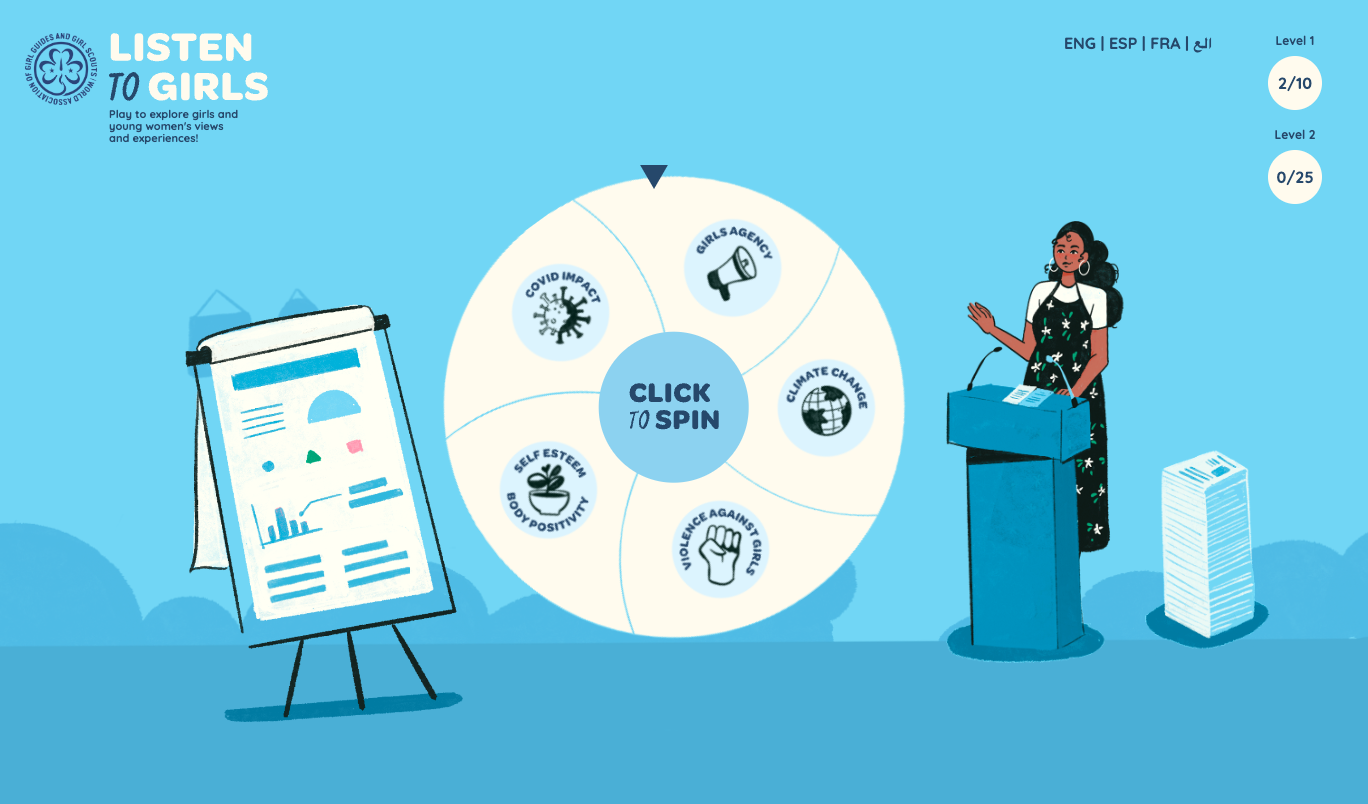
Listen to Girls
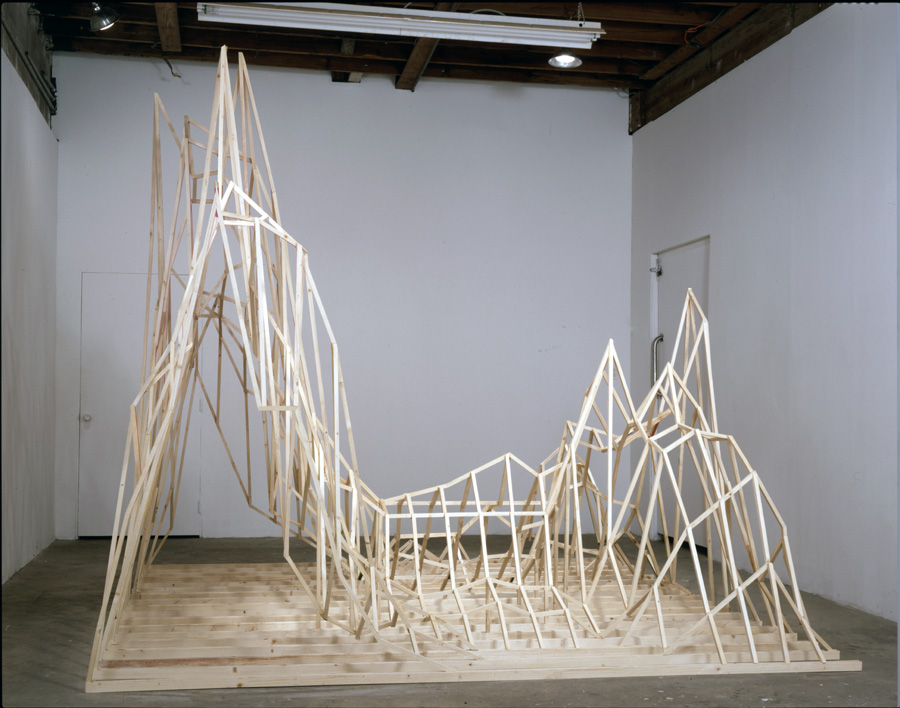
Lobo EMF
Nicolas Lobo
Local Projects
Local Projects
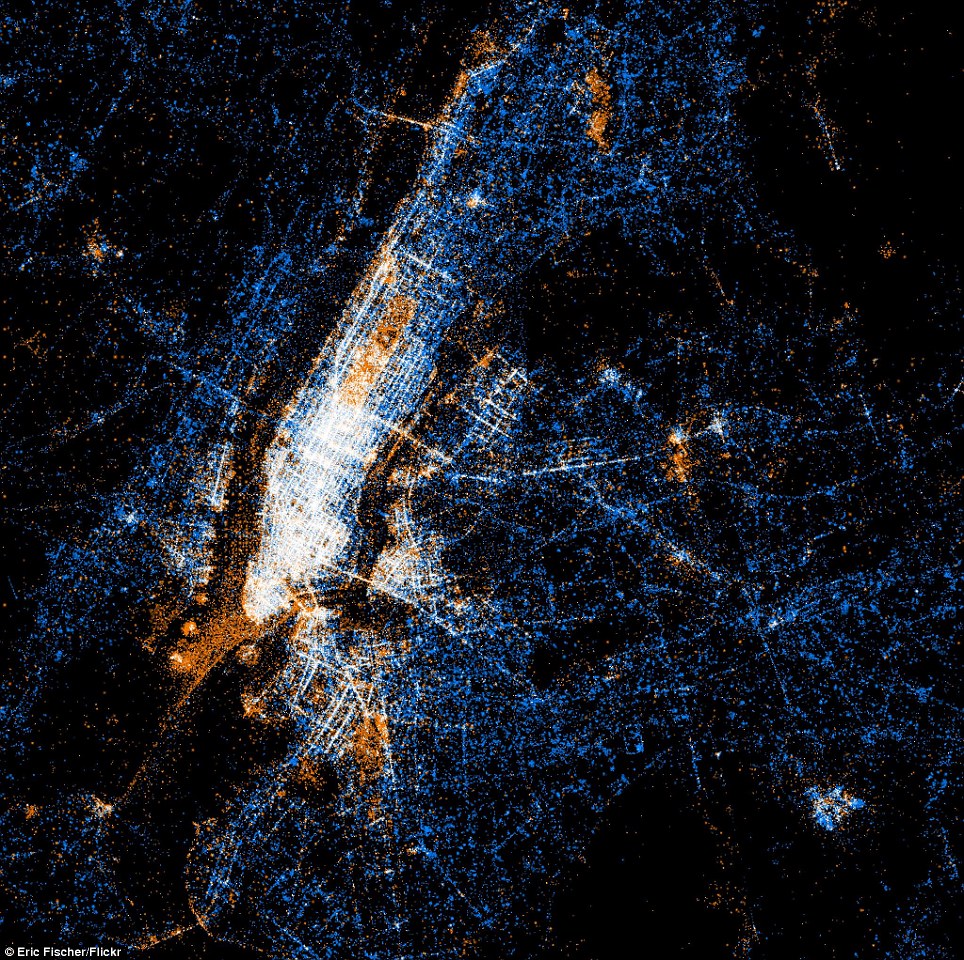
Locals and Tourists
Eric Fischer
London Tube Usage
Unknown

Luna Maurer Projects
Luna Maurer
Lusion
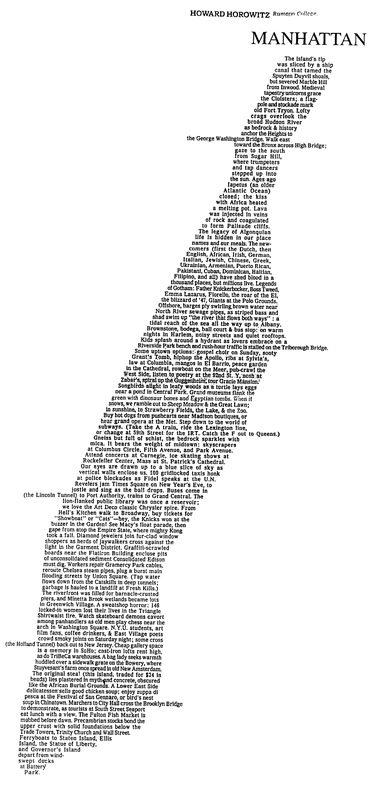
Manhattan Poem
Eli Horowitz
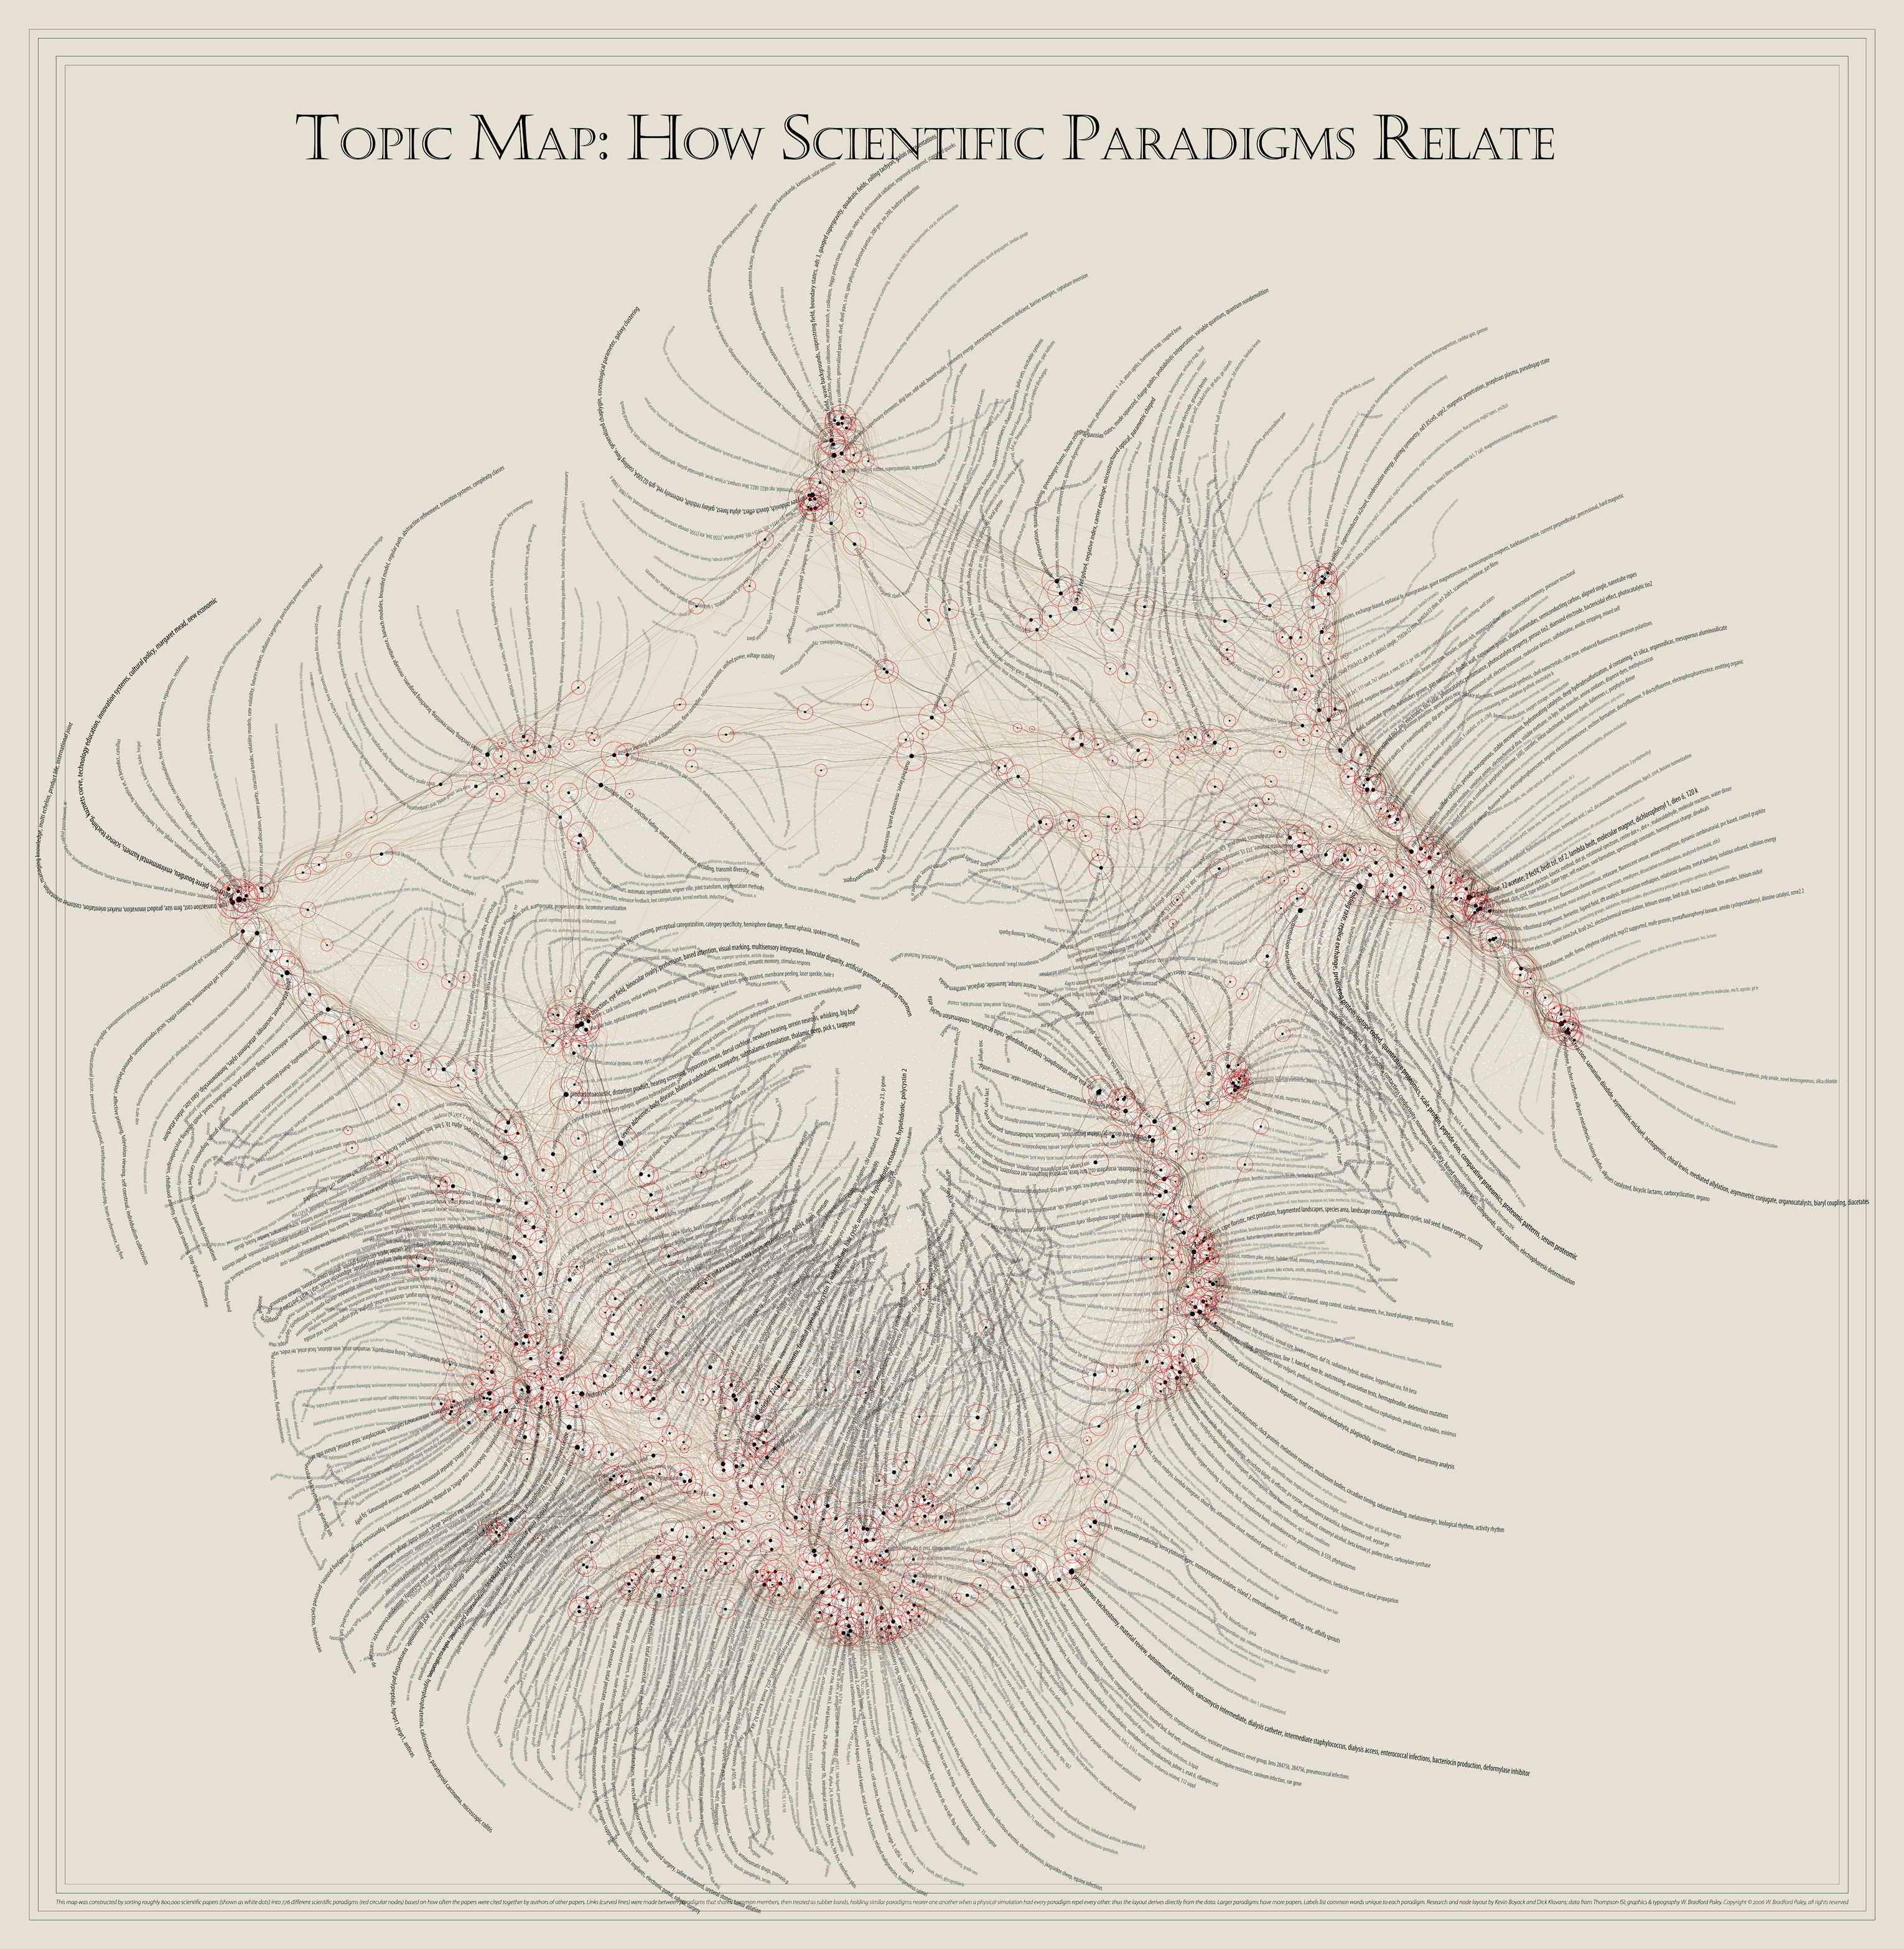
Map of Science
W. Bradford Paley
Map Yes
Stamen Design
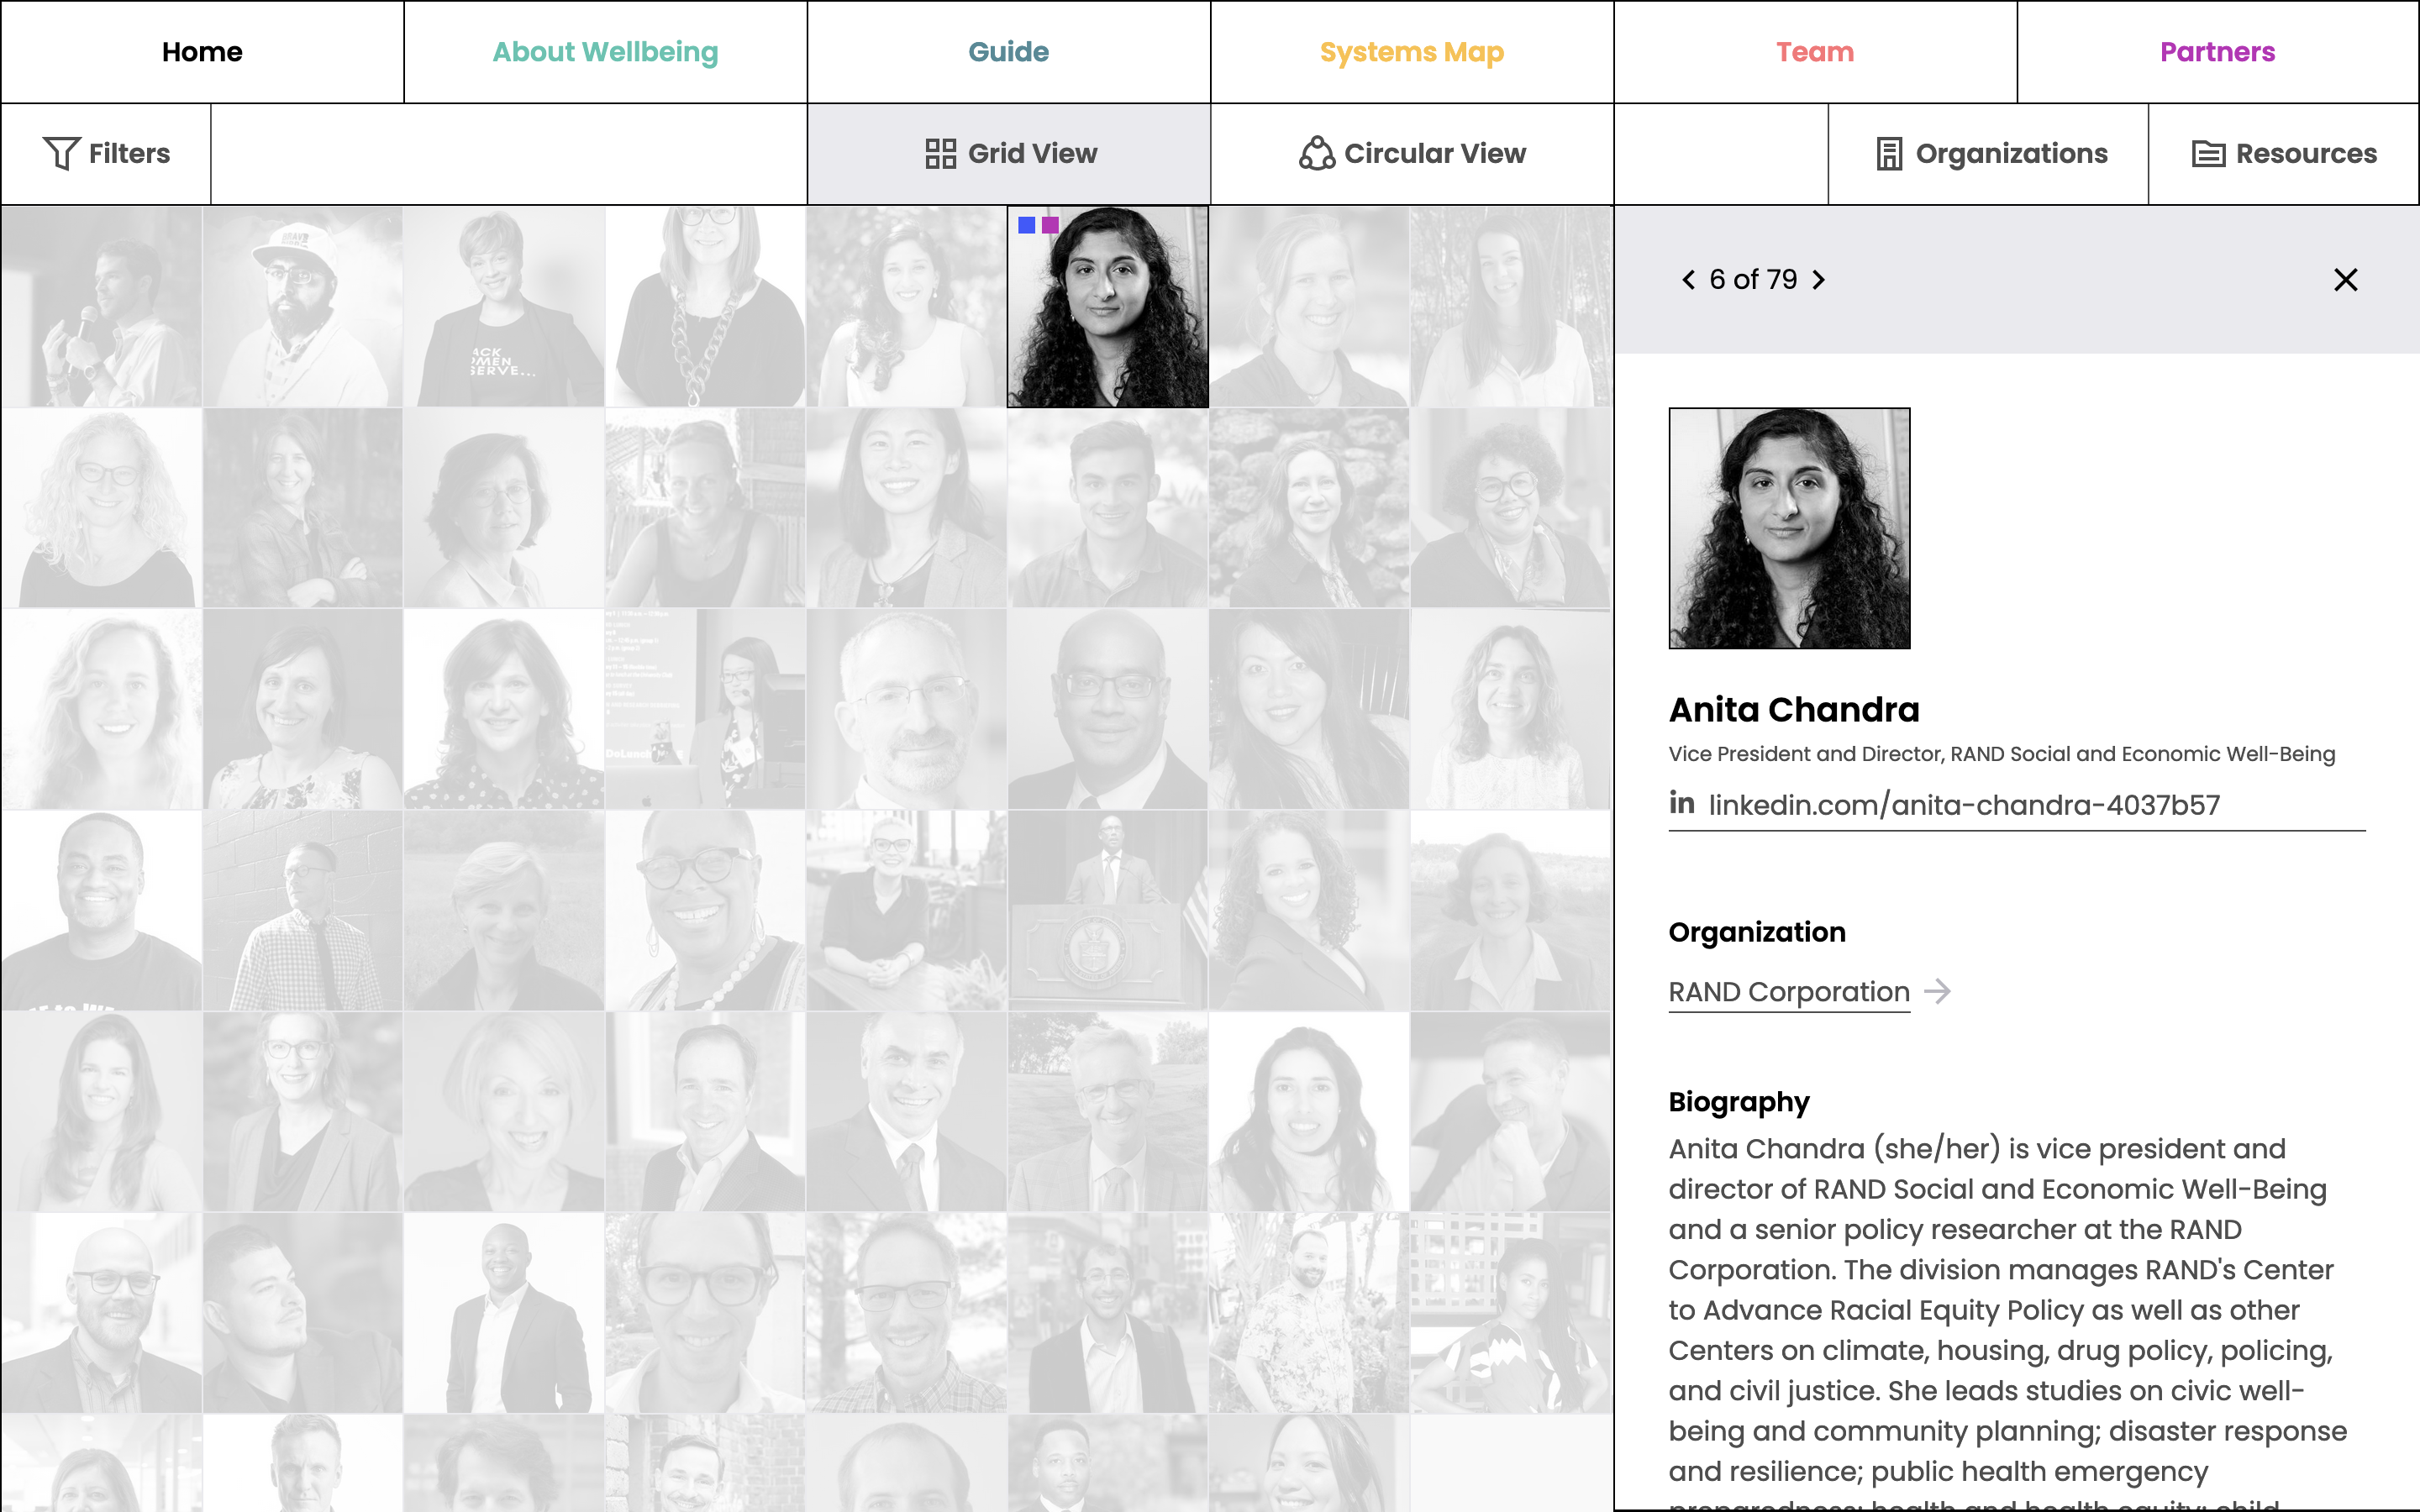
Mapping Collective Wellbeing
Schema Design
Mapping the Belt and Road Initiative and Illicit Trade
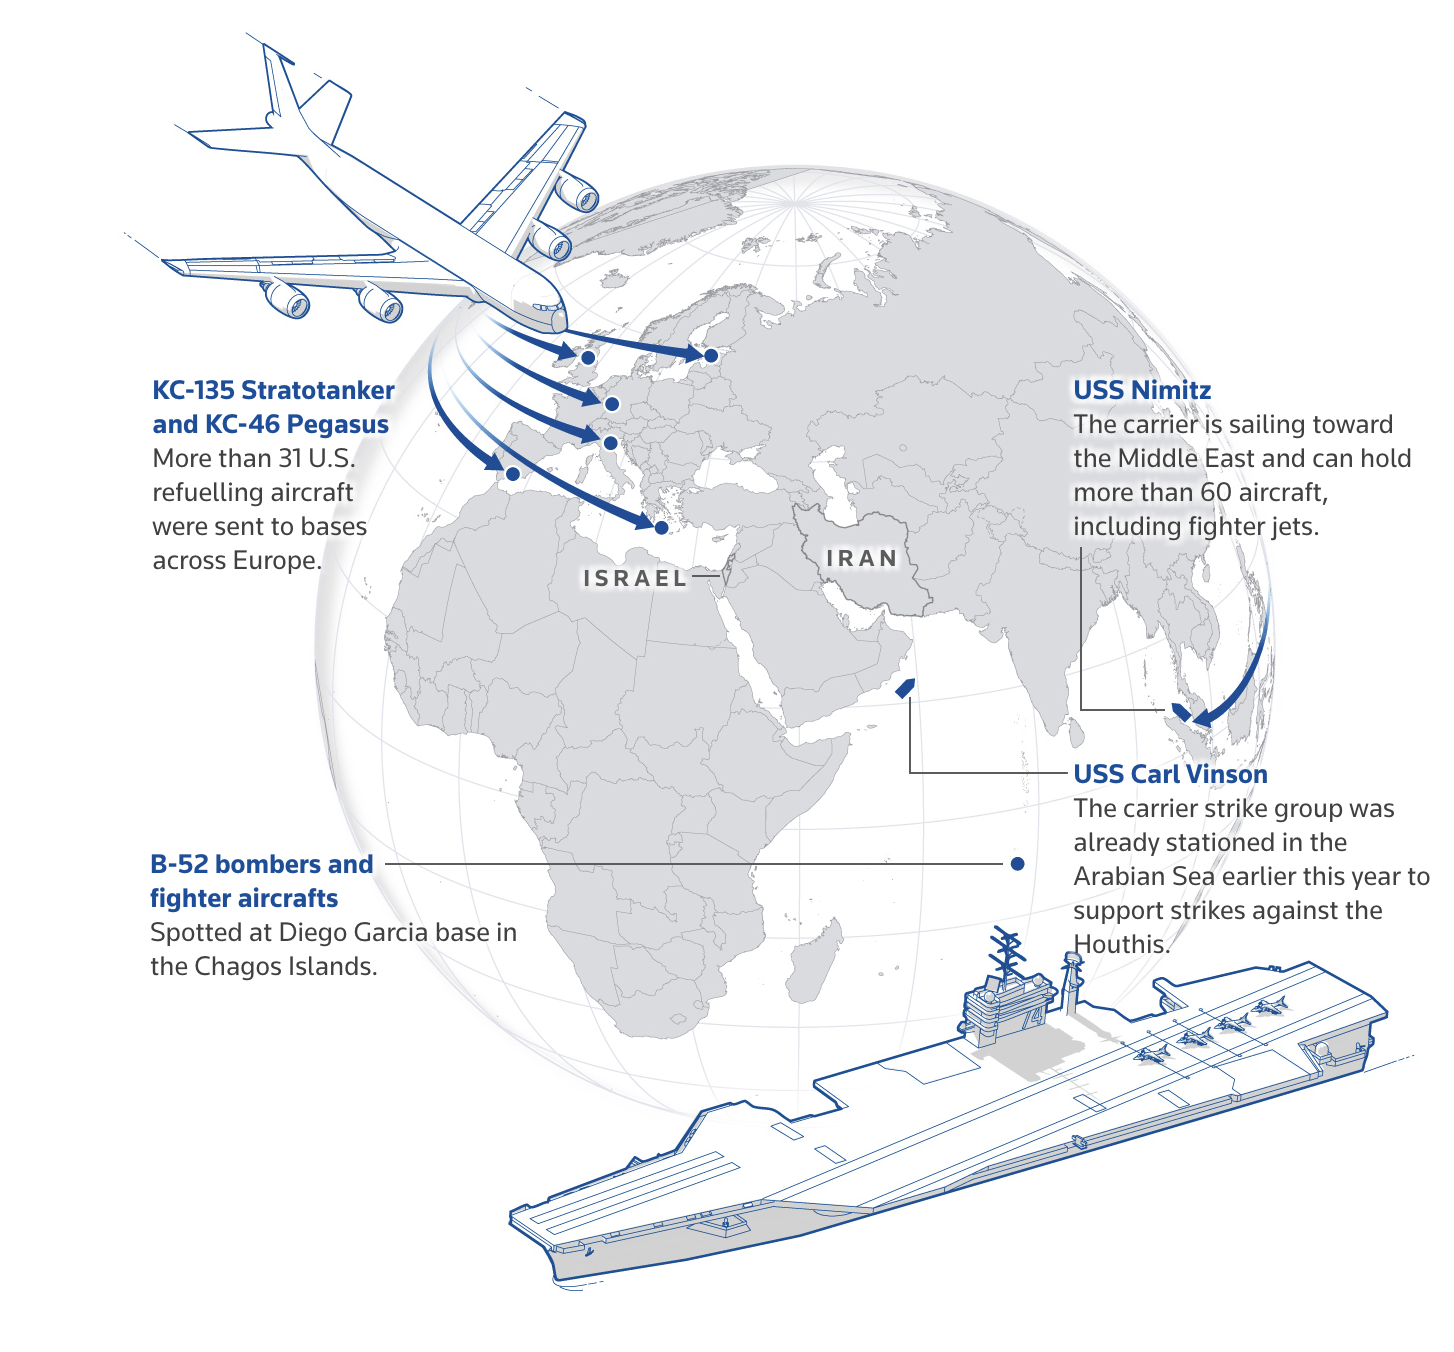
Mapping the Conflict between Israel and Iran
Reuters

MarcinIgnac EveryDayOfMyLife
Marcin Ignac
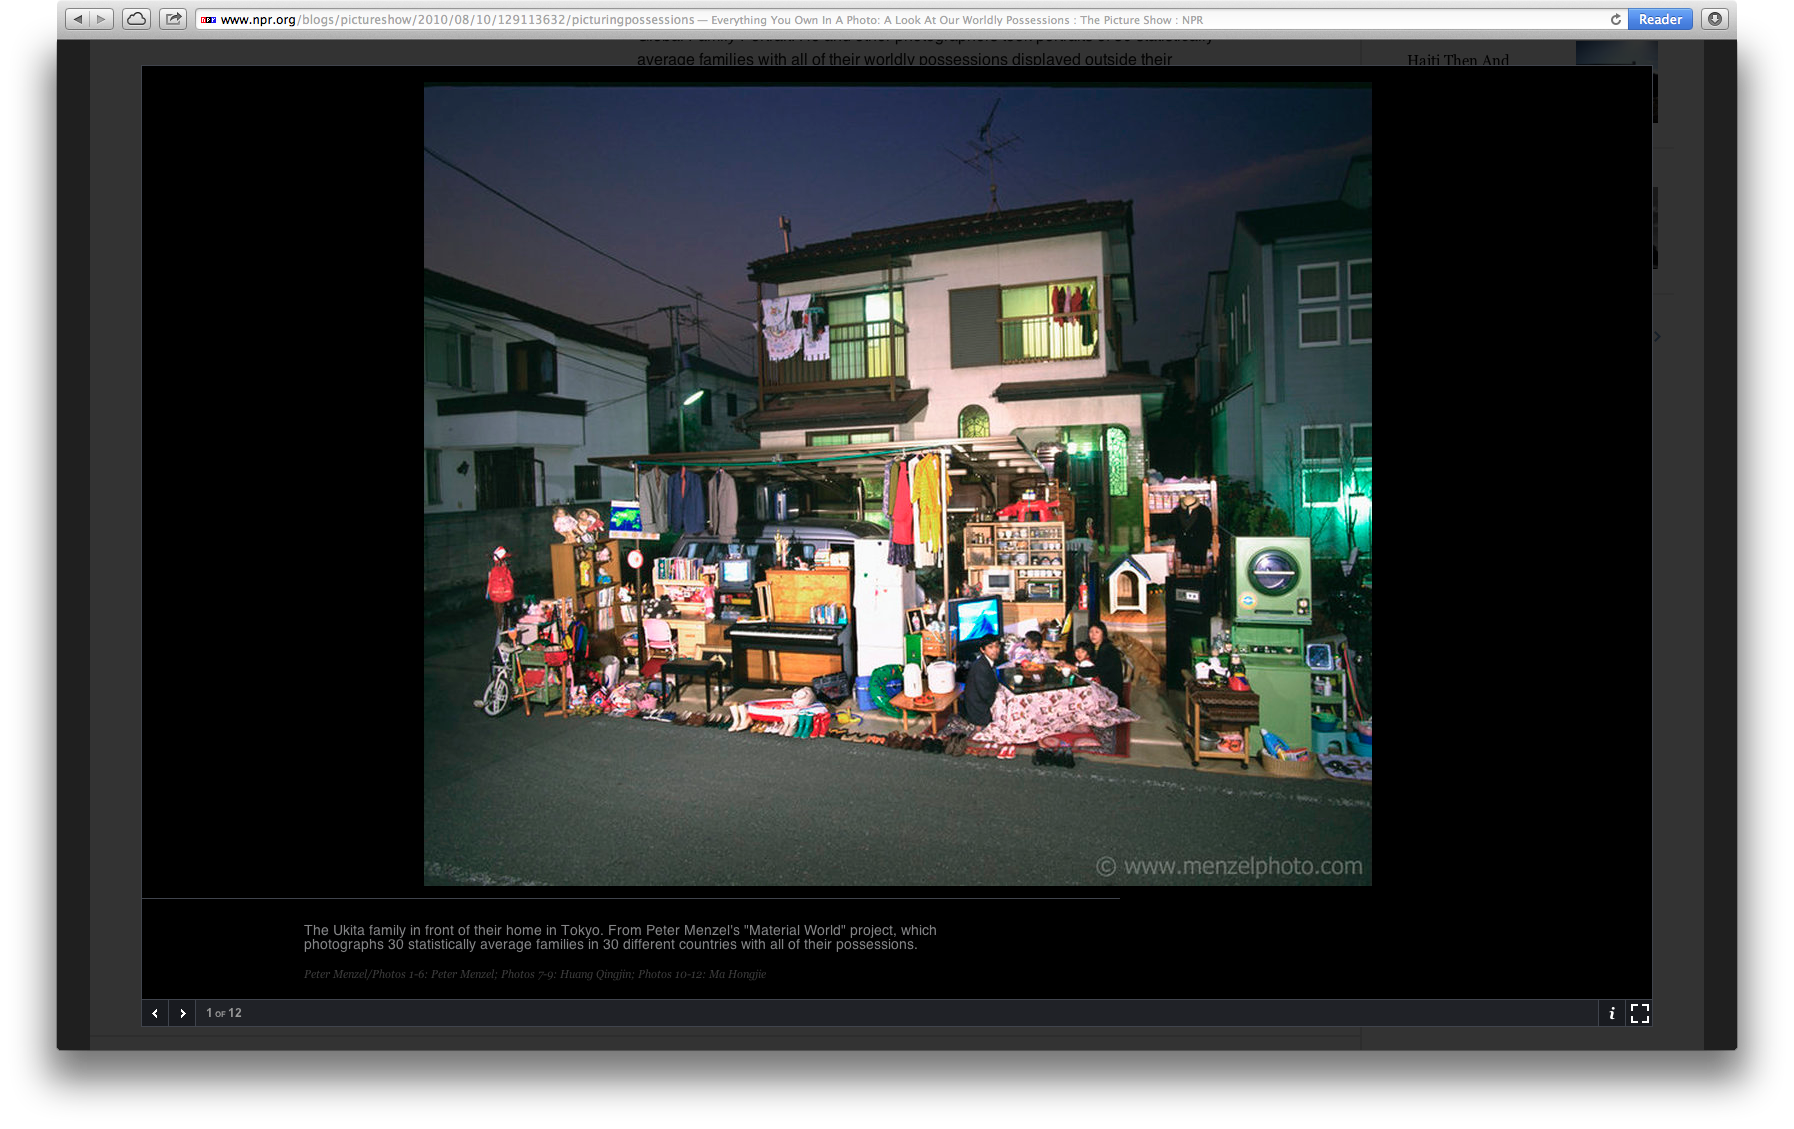
Material World
Peter Menzel
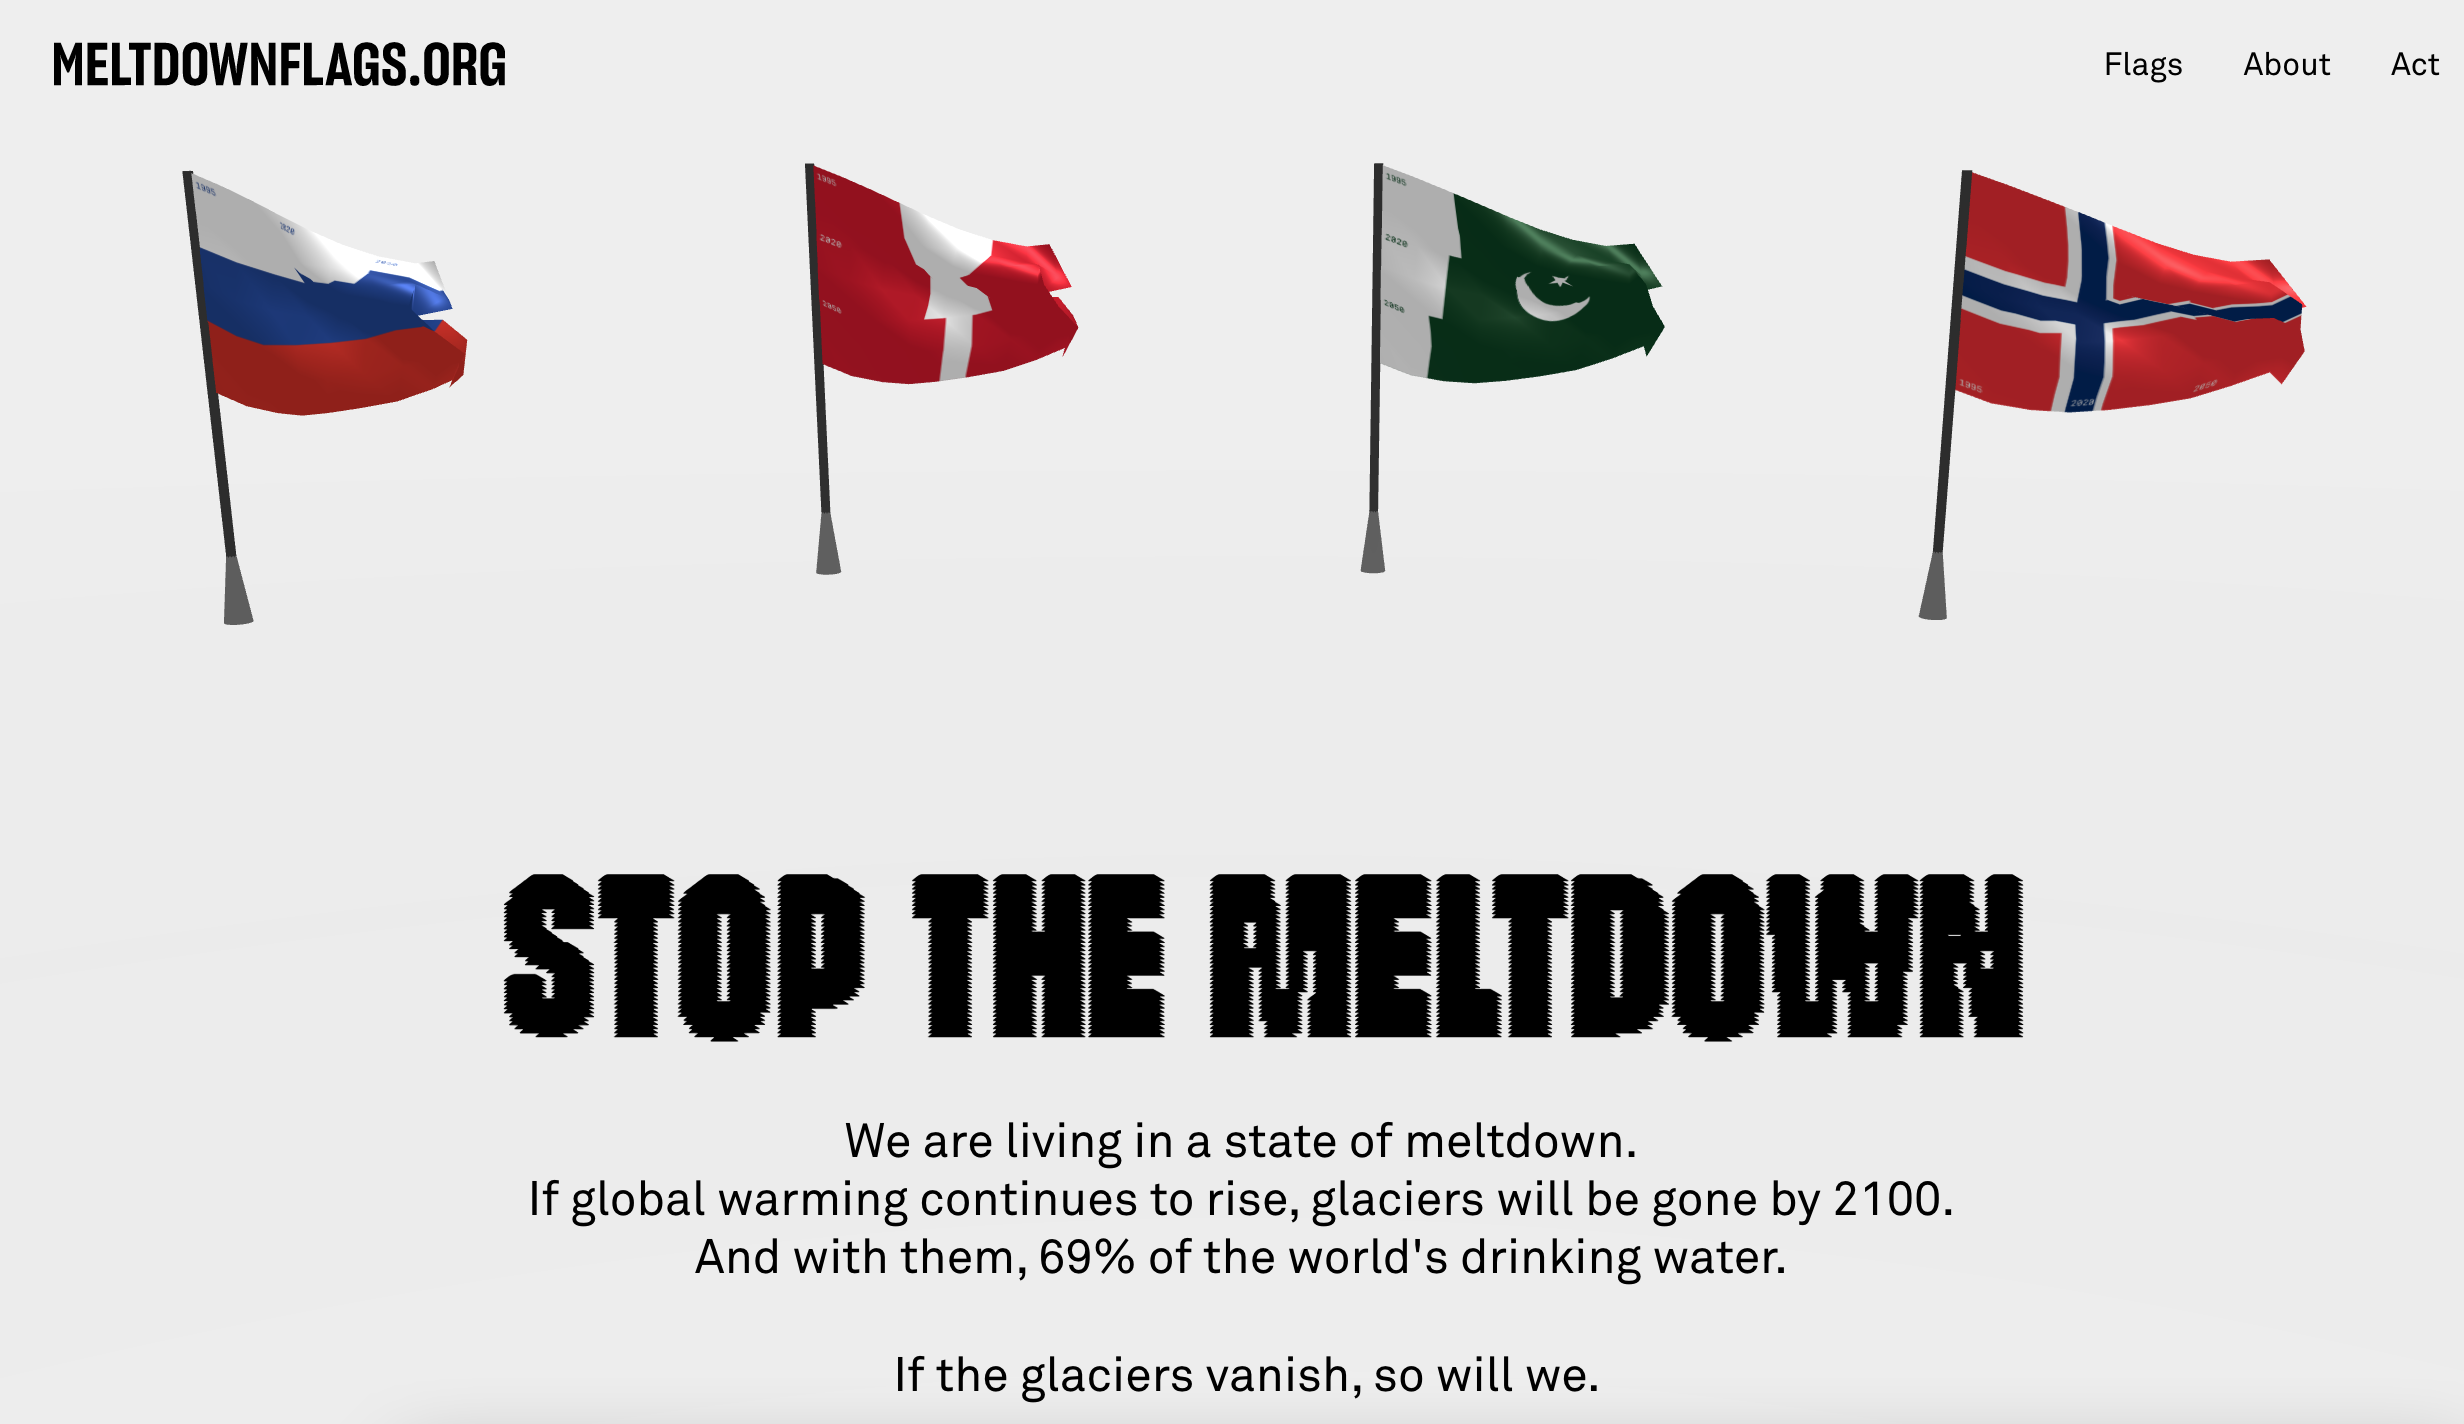
Meltdown Flags
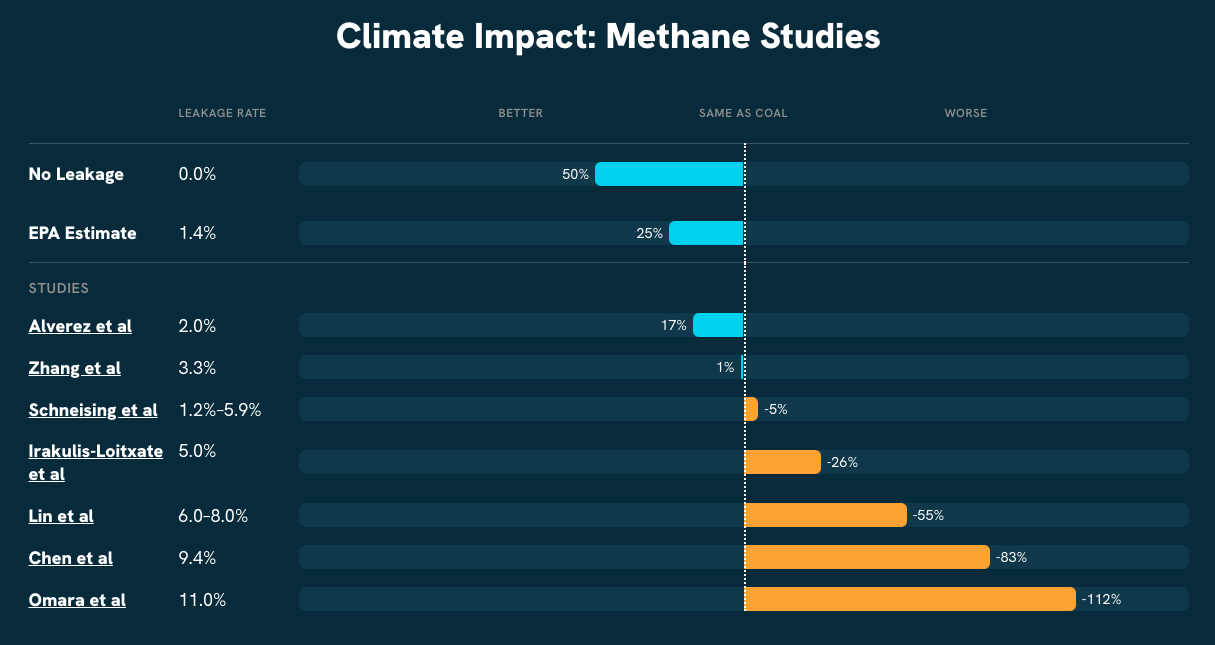
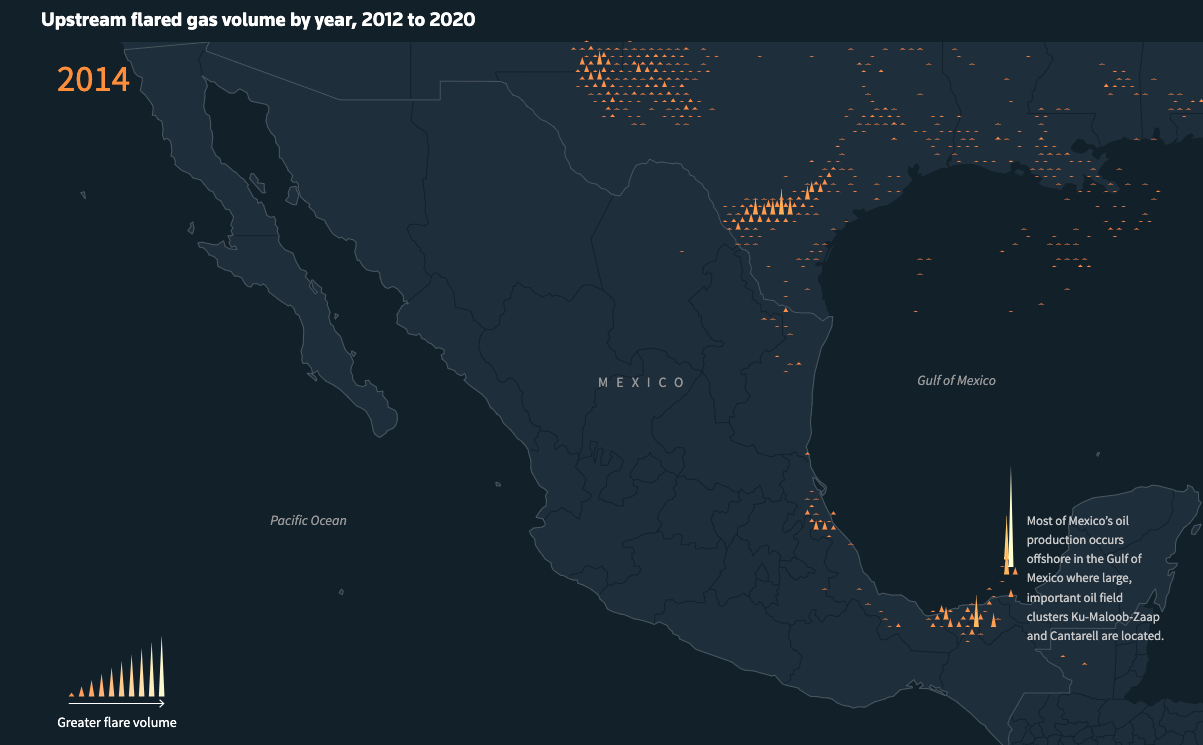
Methane V Coal Microsite
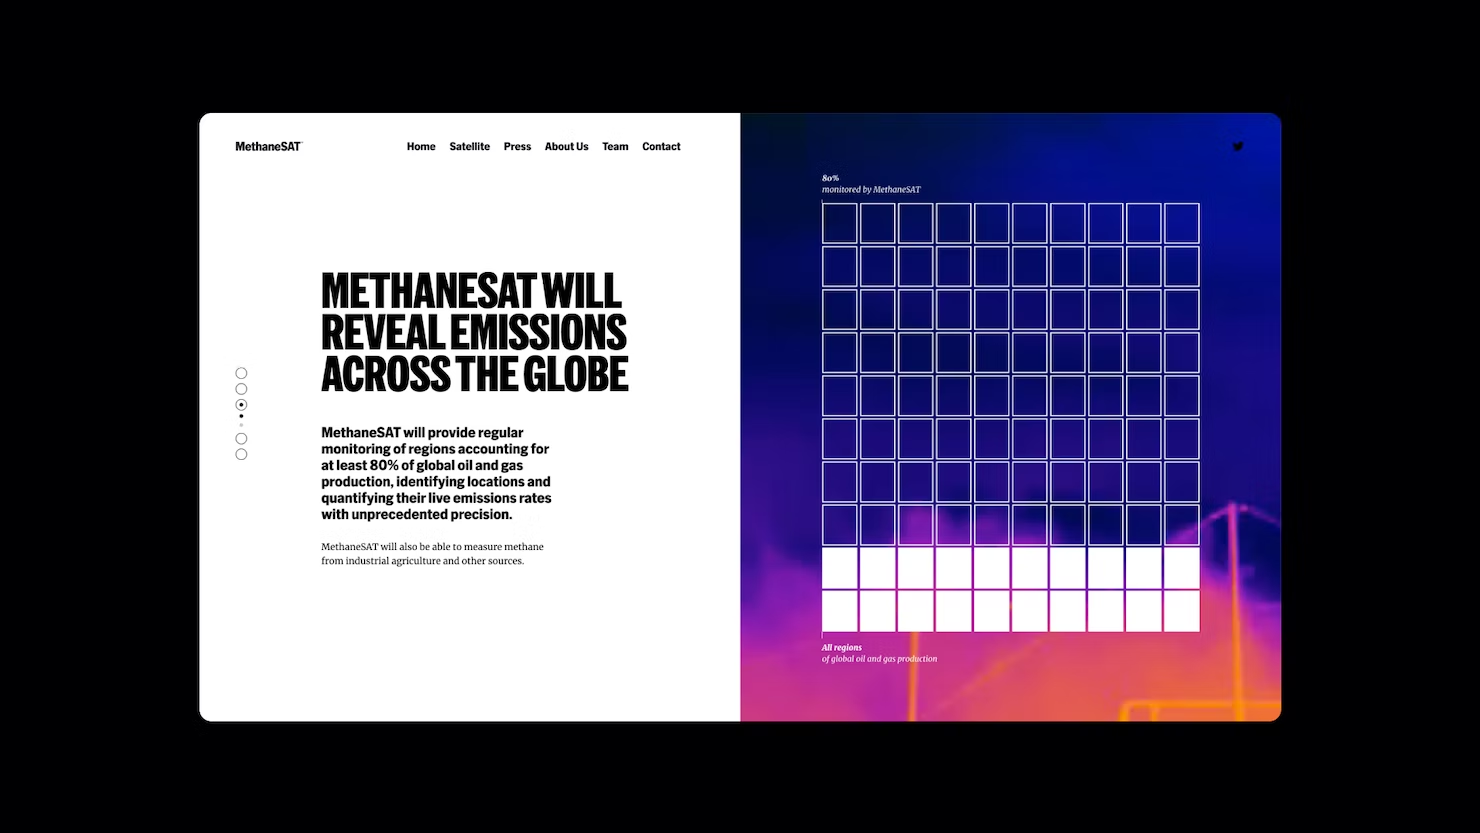
MethaneSat / Pentagram
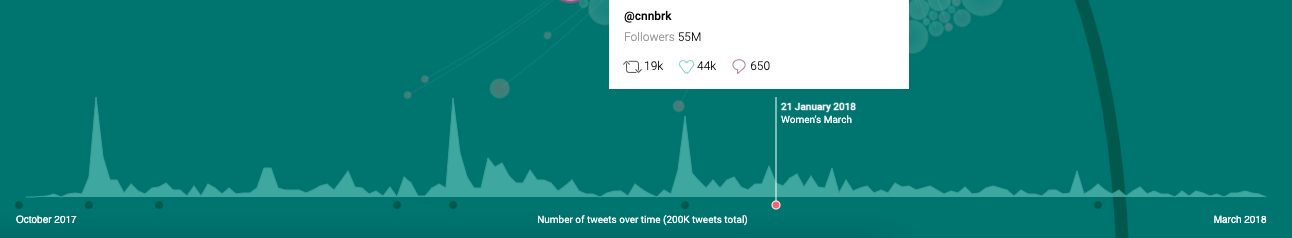
MeToomentum, by Valentina D'efilippo
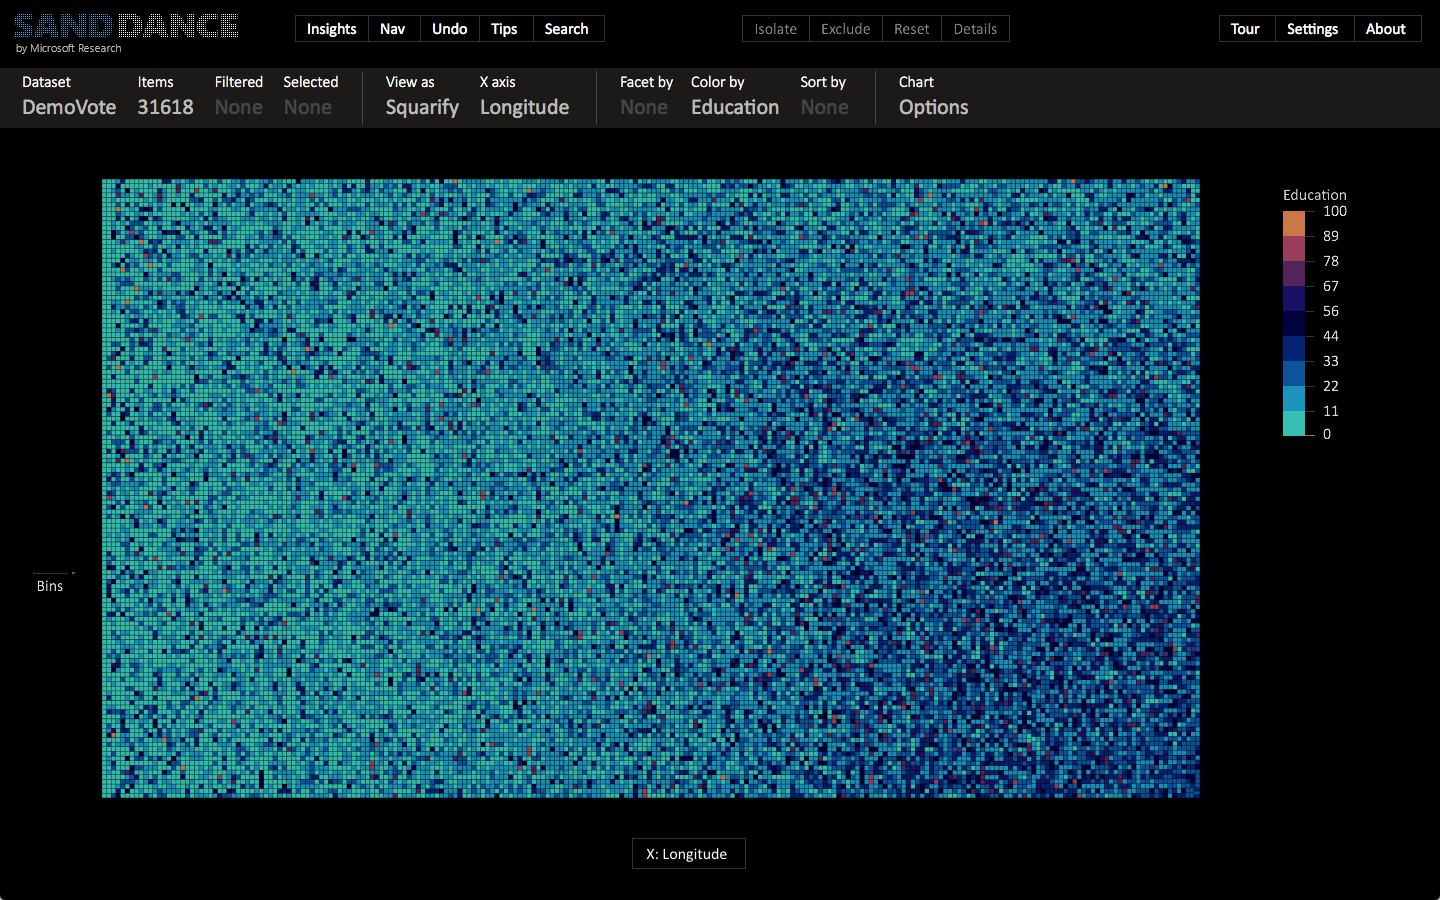
Microsoft Sanddance
Schema Design
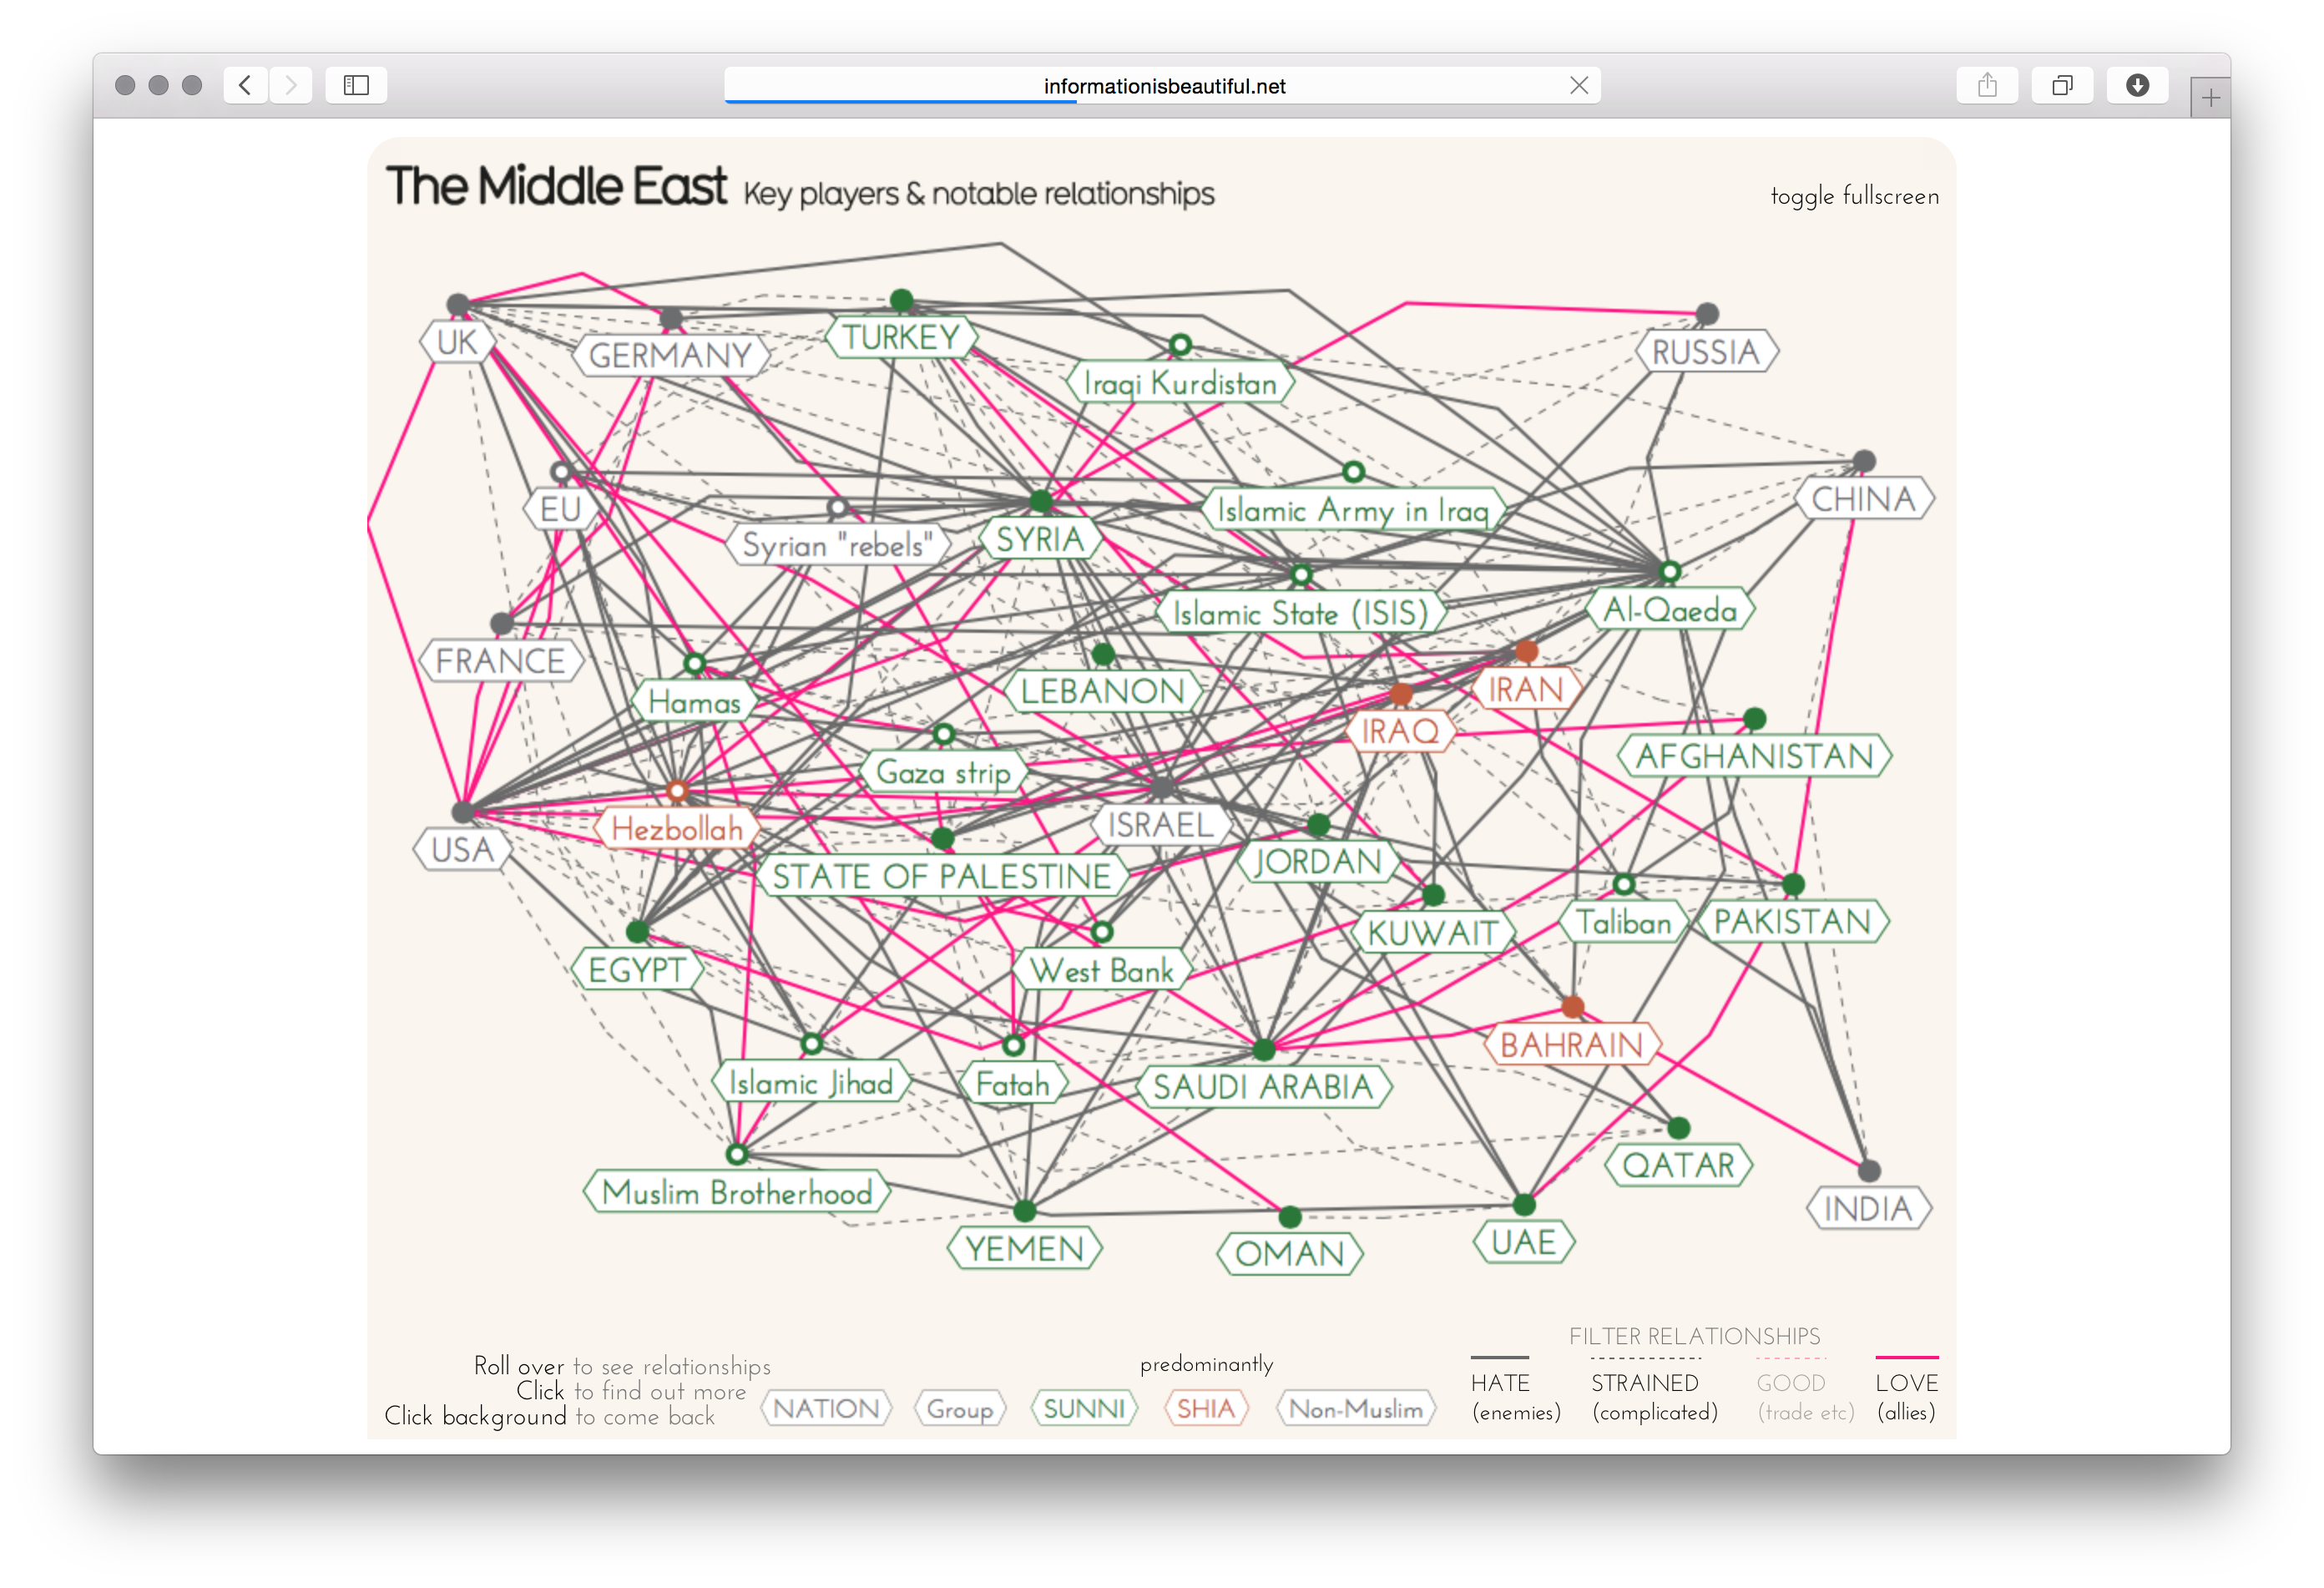
Middle East Explained
Information is Beautiful
Midterm Elections 2022: the Issues That Matter to Americans
Axios
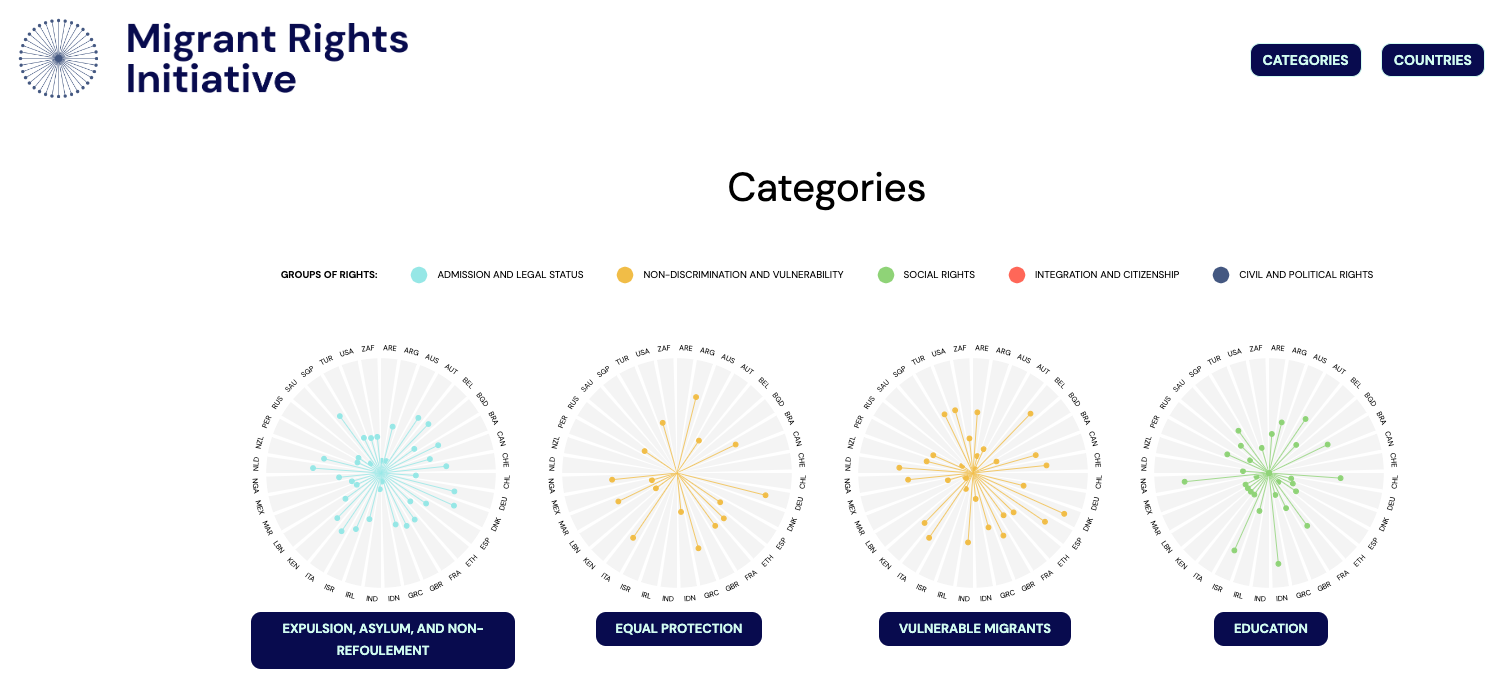
Migrants Rights Initiative
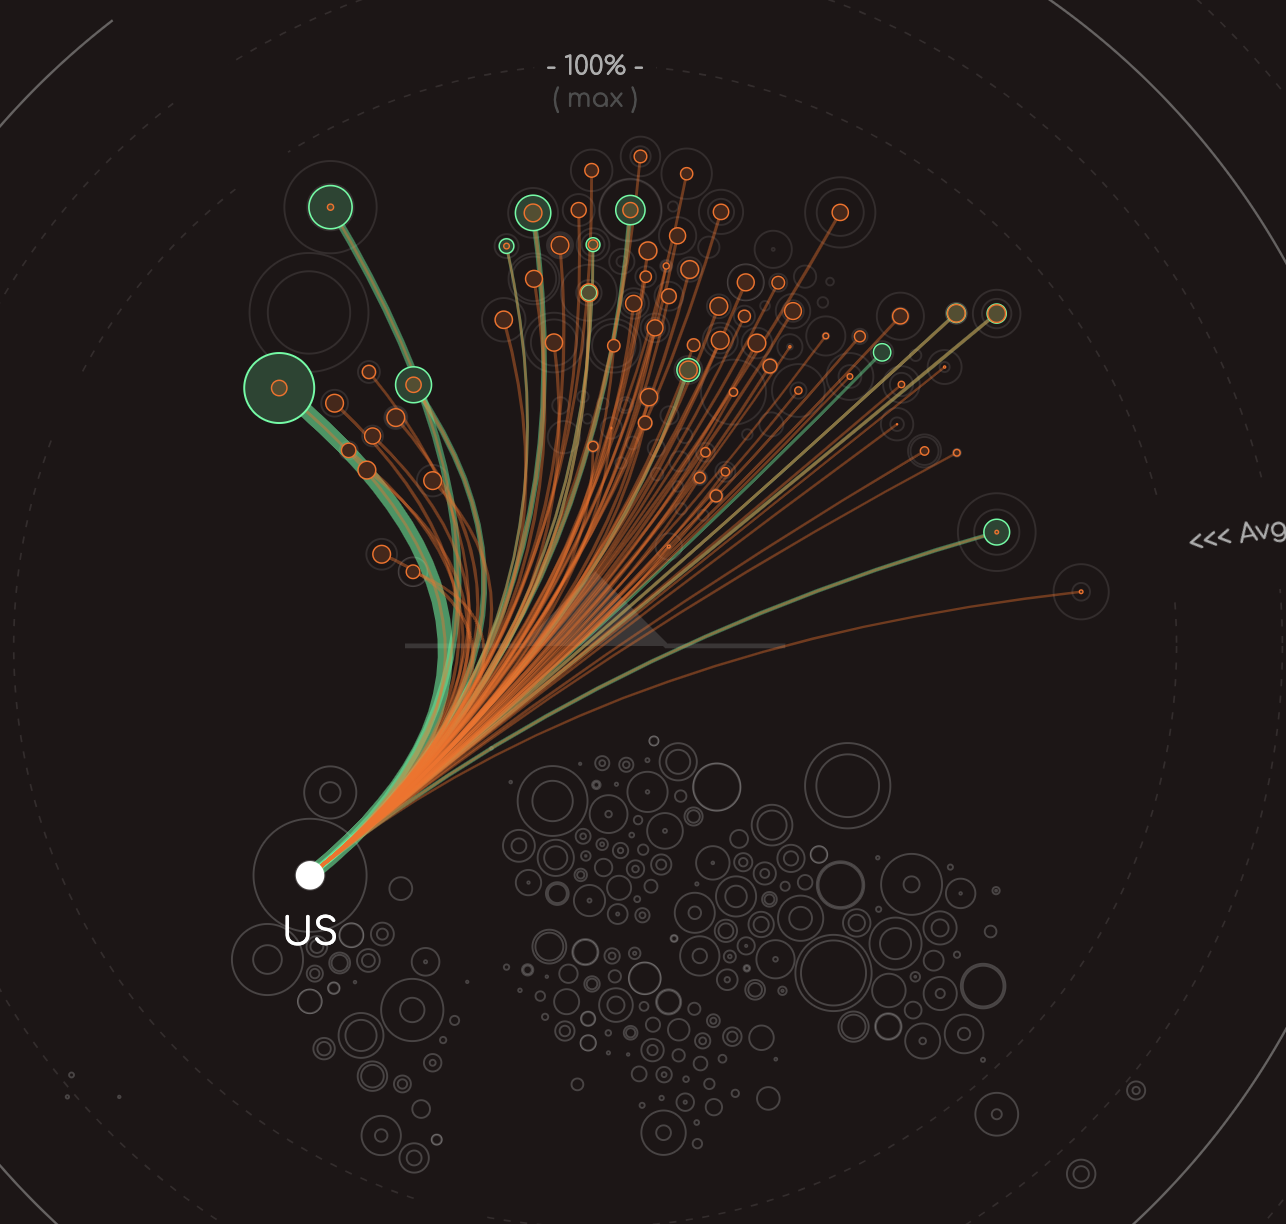
Migration between Search and Reality
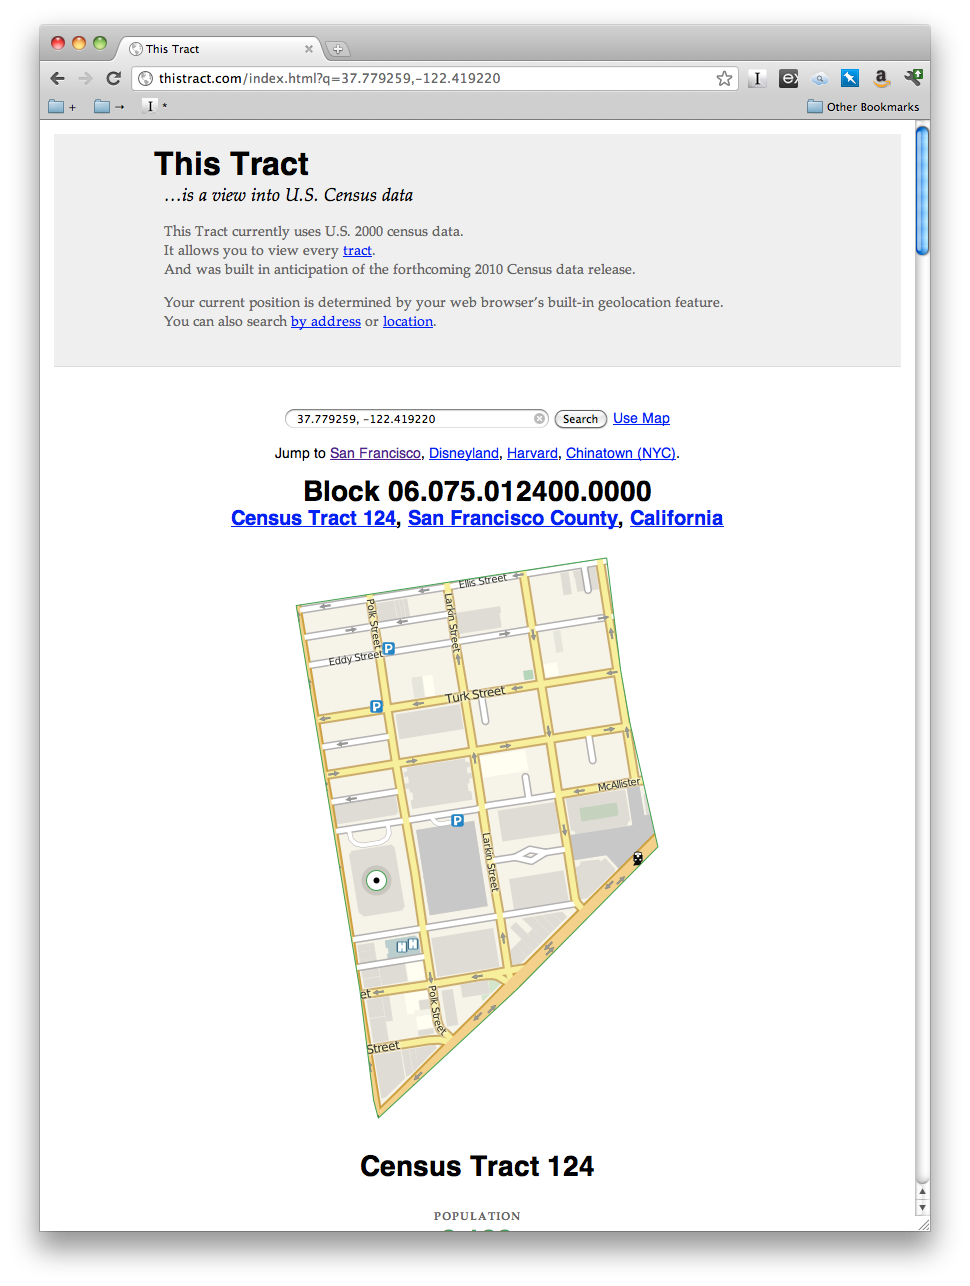
Migurski This Tract
Mike Migurski
Mirroring Hope
Schema Design
MoMA Collection Site
MoMA
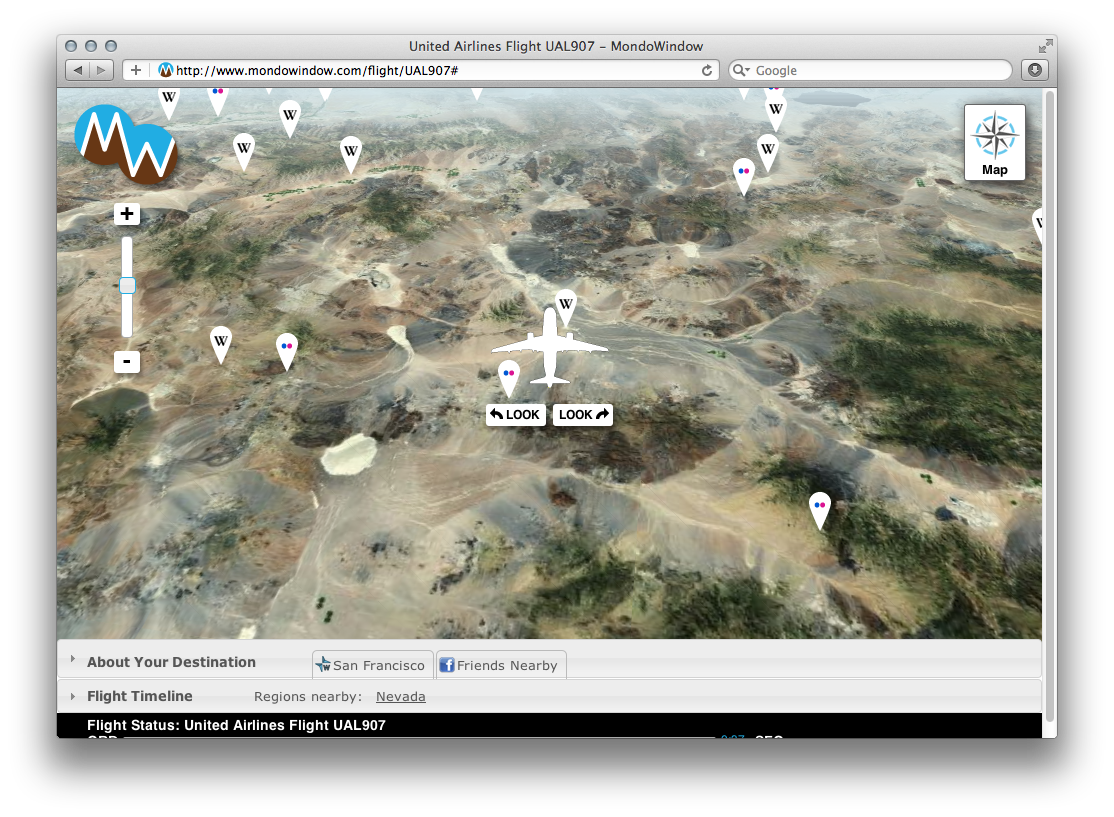
Mondo Window
Stamen Design

Moon Phases de Bondt
de Bondt
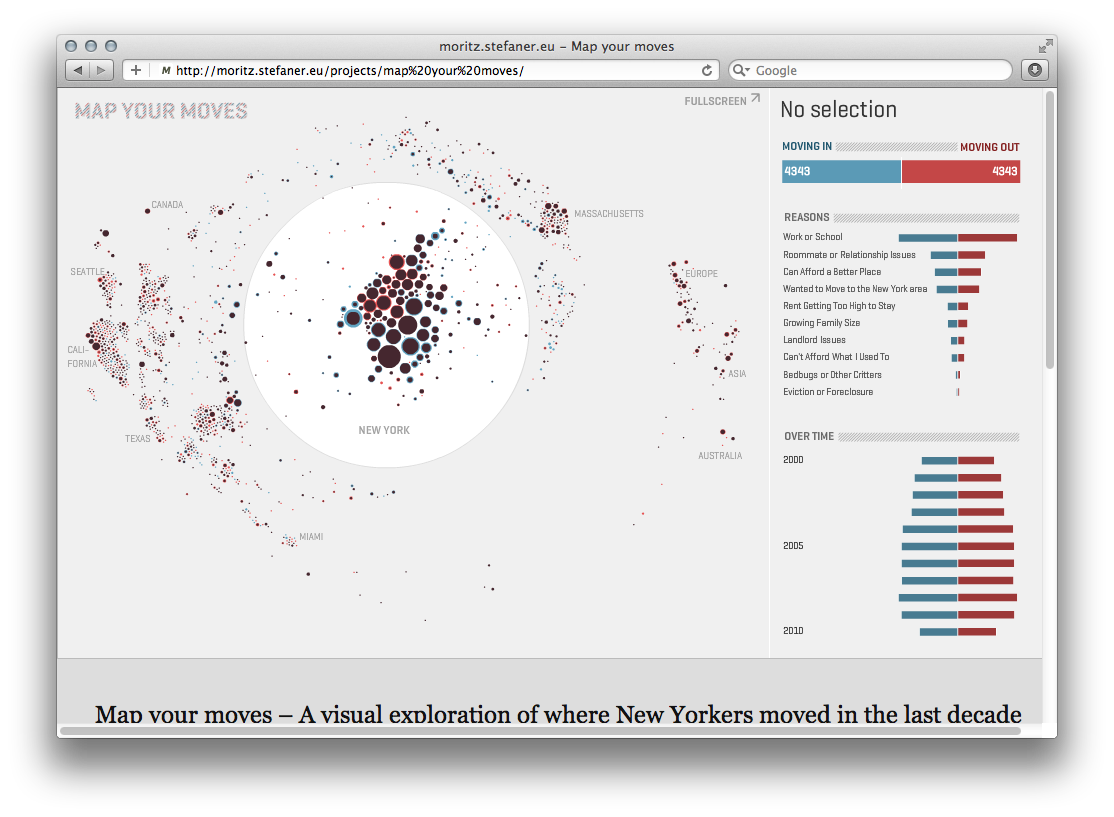
Moritz Stefaner Projects
Moritz Stefaner
Morningstar Sustainable Investing Summit 2023
Schema Design
Morningstar Sustainable Investing Summit 2024
Schema Design

Most Wanted / Least Wanted
Komar & Melamid
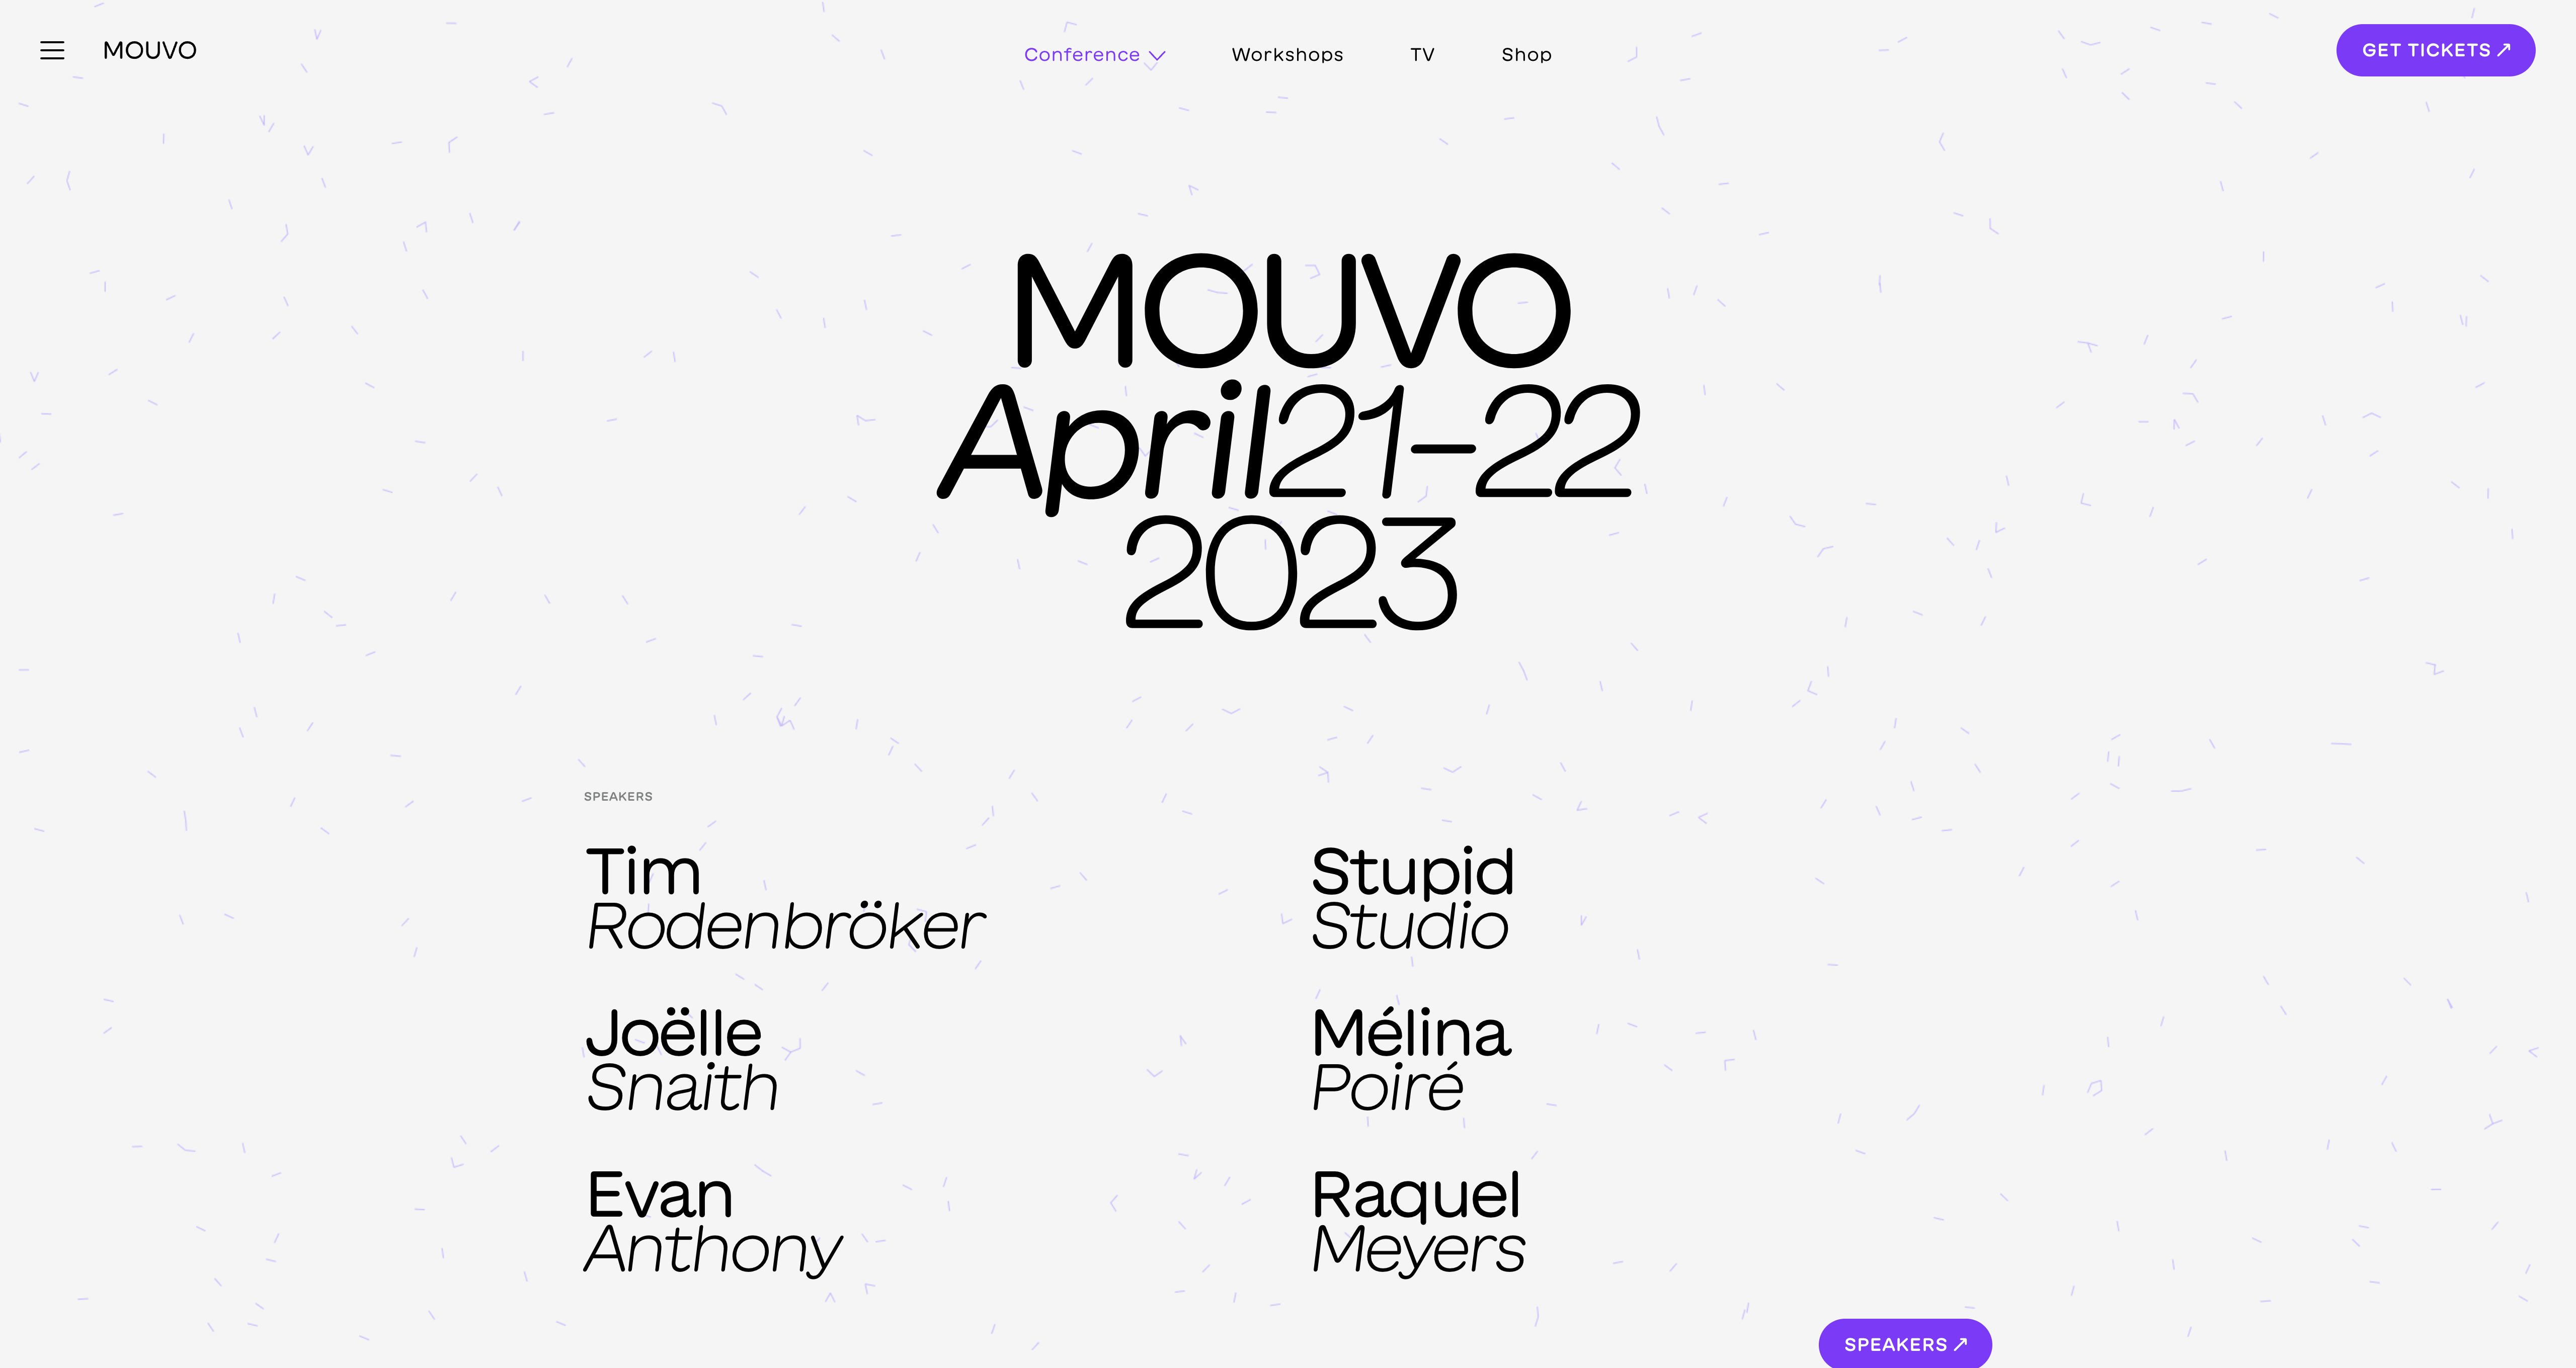
Mouvo
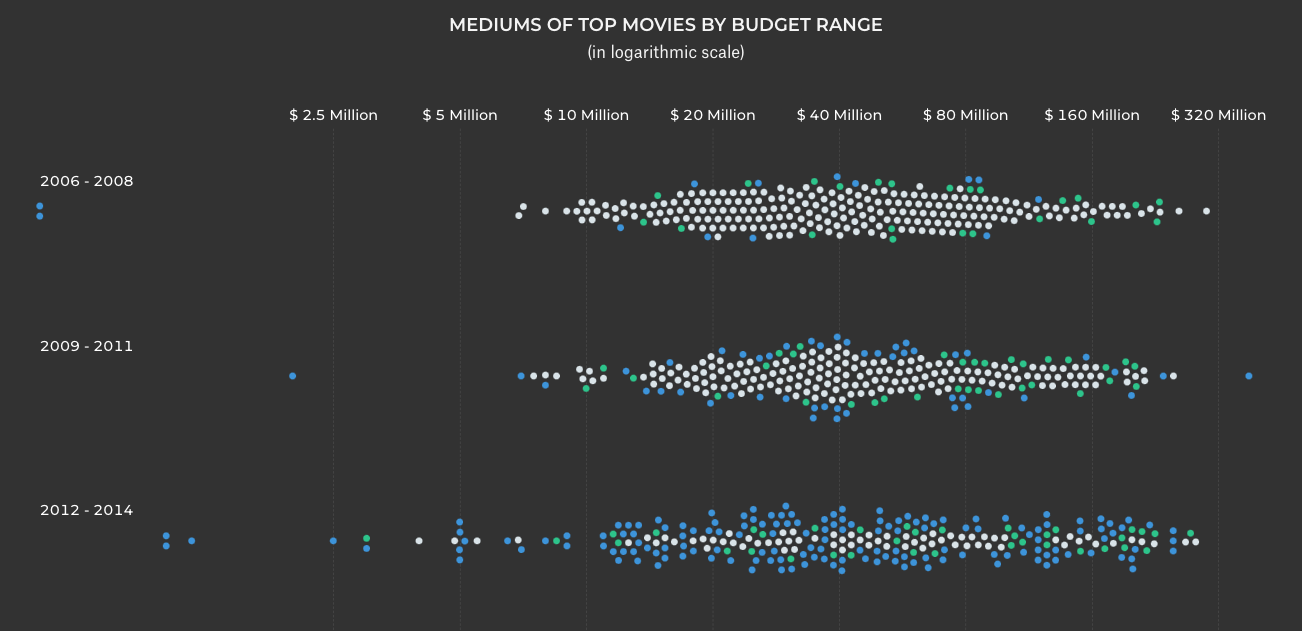
Movie Waves in 21st Century
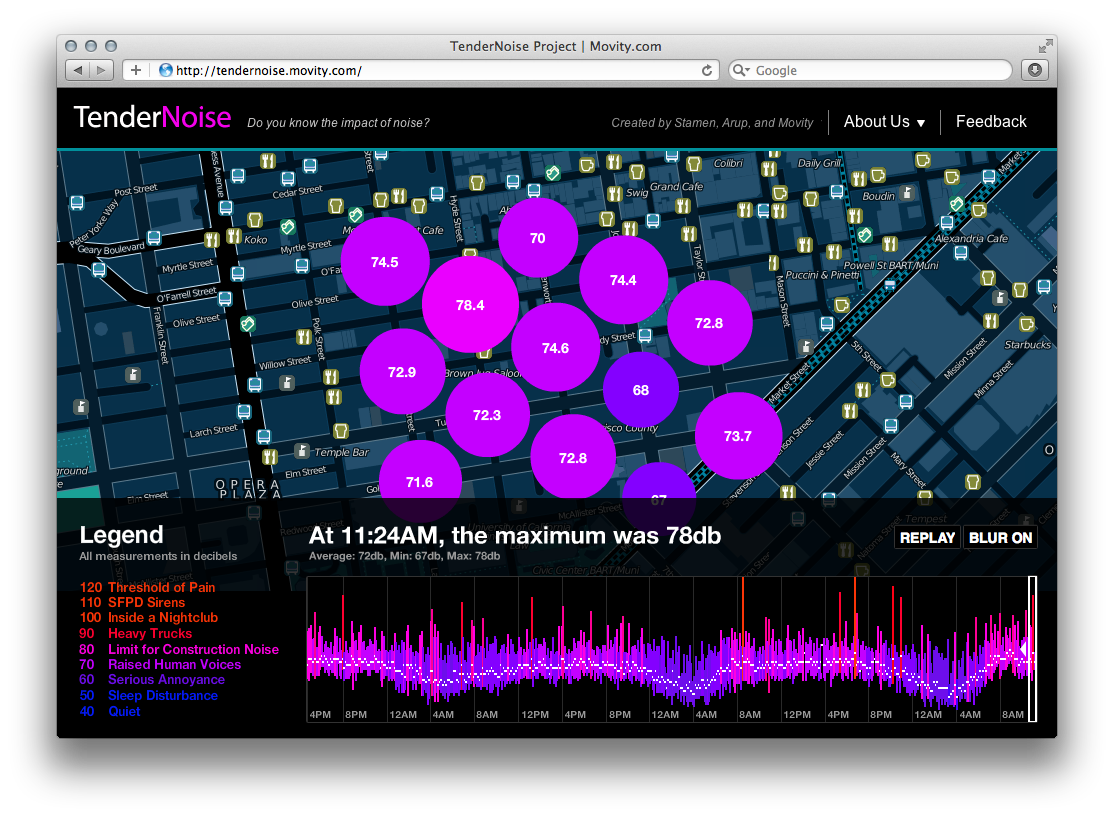
Movity Tendernoise
Stamen, Arup, Movity
Mr. Biden, Tear Down This Highway
The New York Times
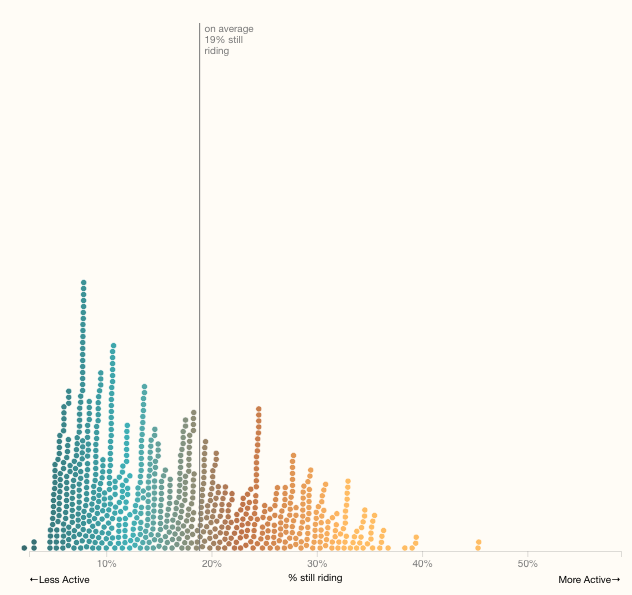
MTA: Ridership Changes Due to COVID-19
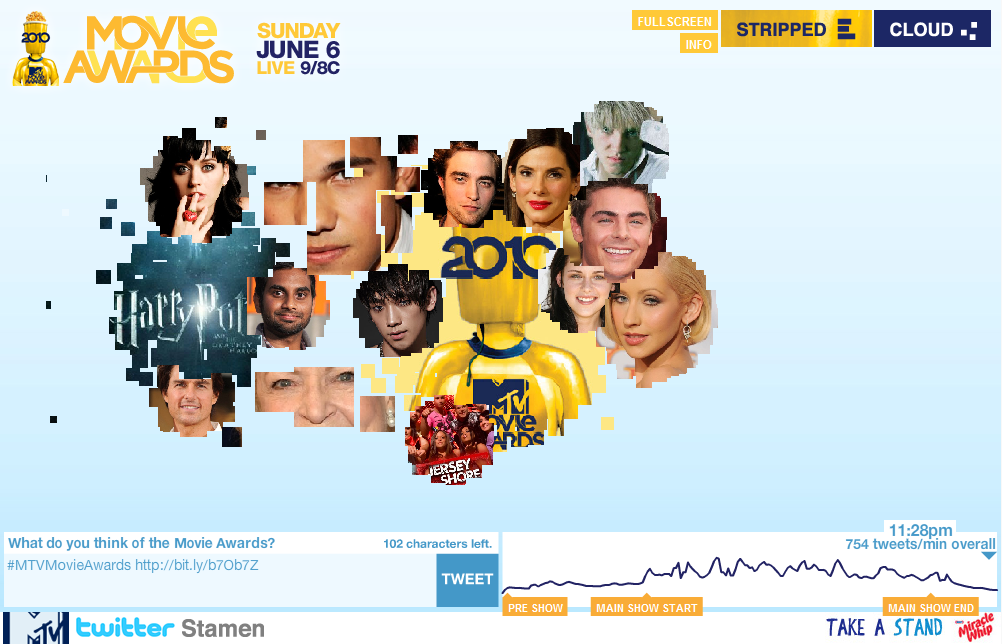
MTV Movie Awards
Stamen Design
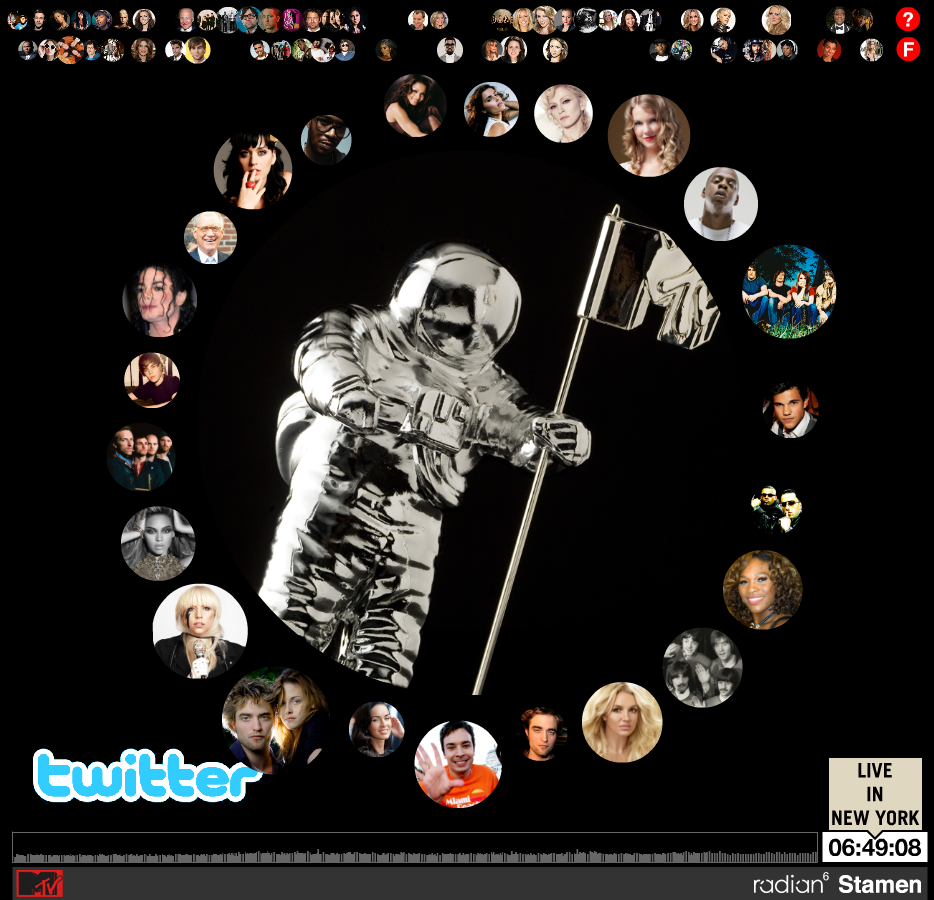
MTV Video Music Awards
Stamen Design
Museo Jumex Landing Page
Museo Jumex

Museum Für Gestaltung Eguide
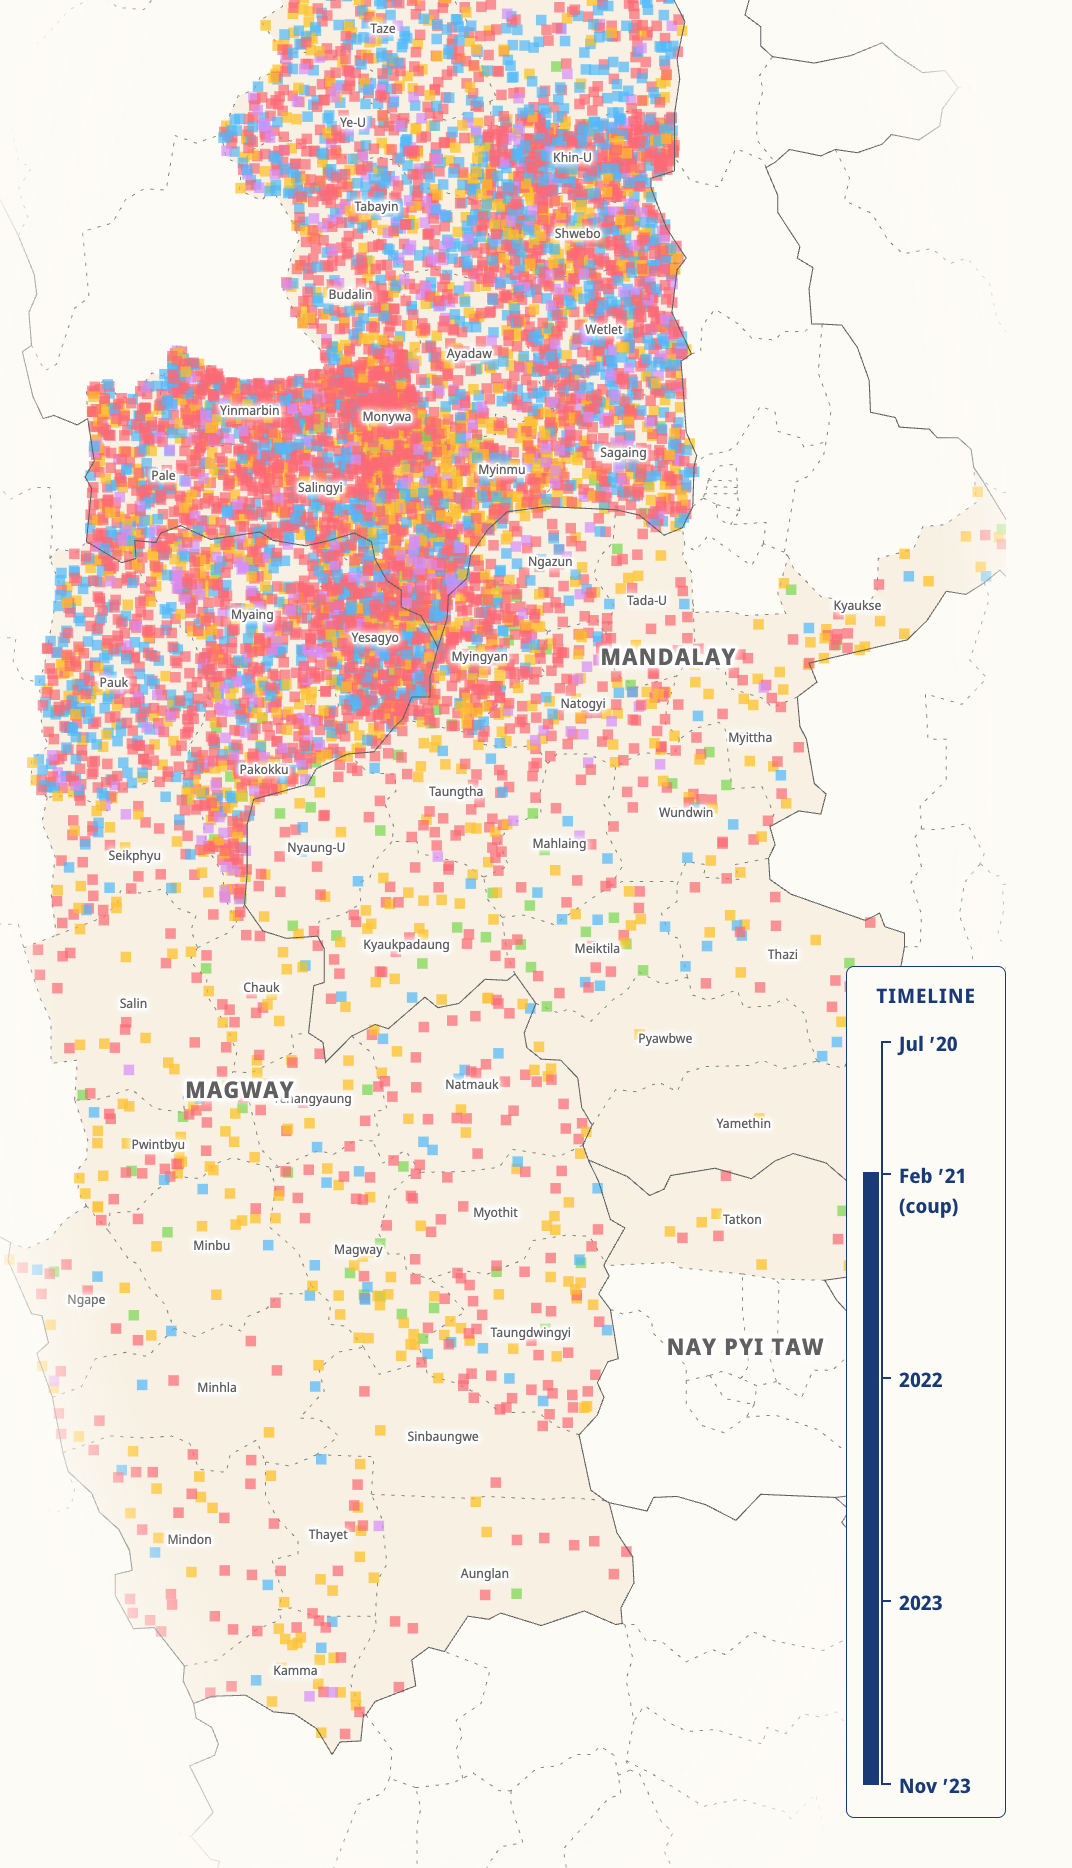
Myanmar Conflict Map
NAE Cities Index
New American Economy
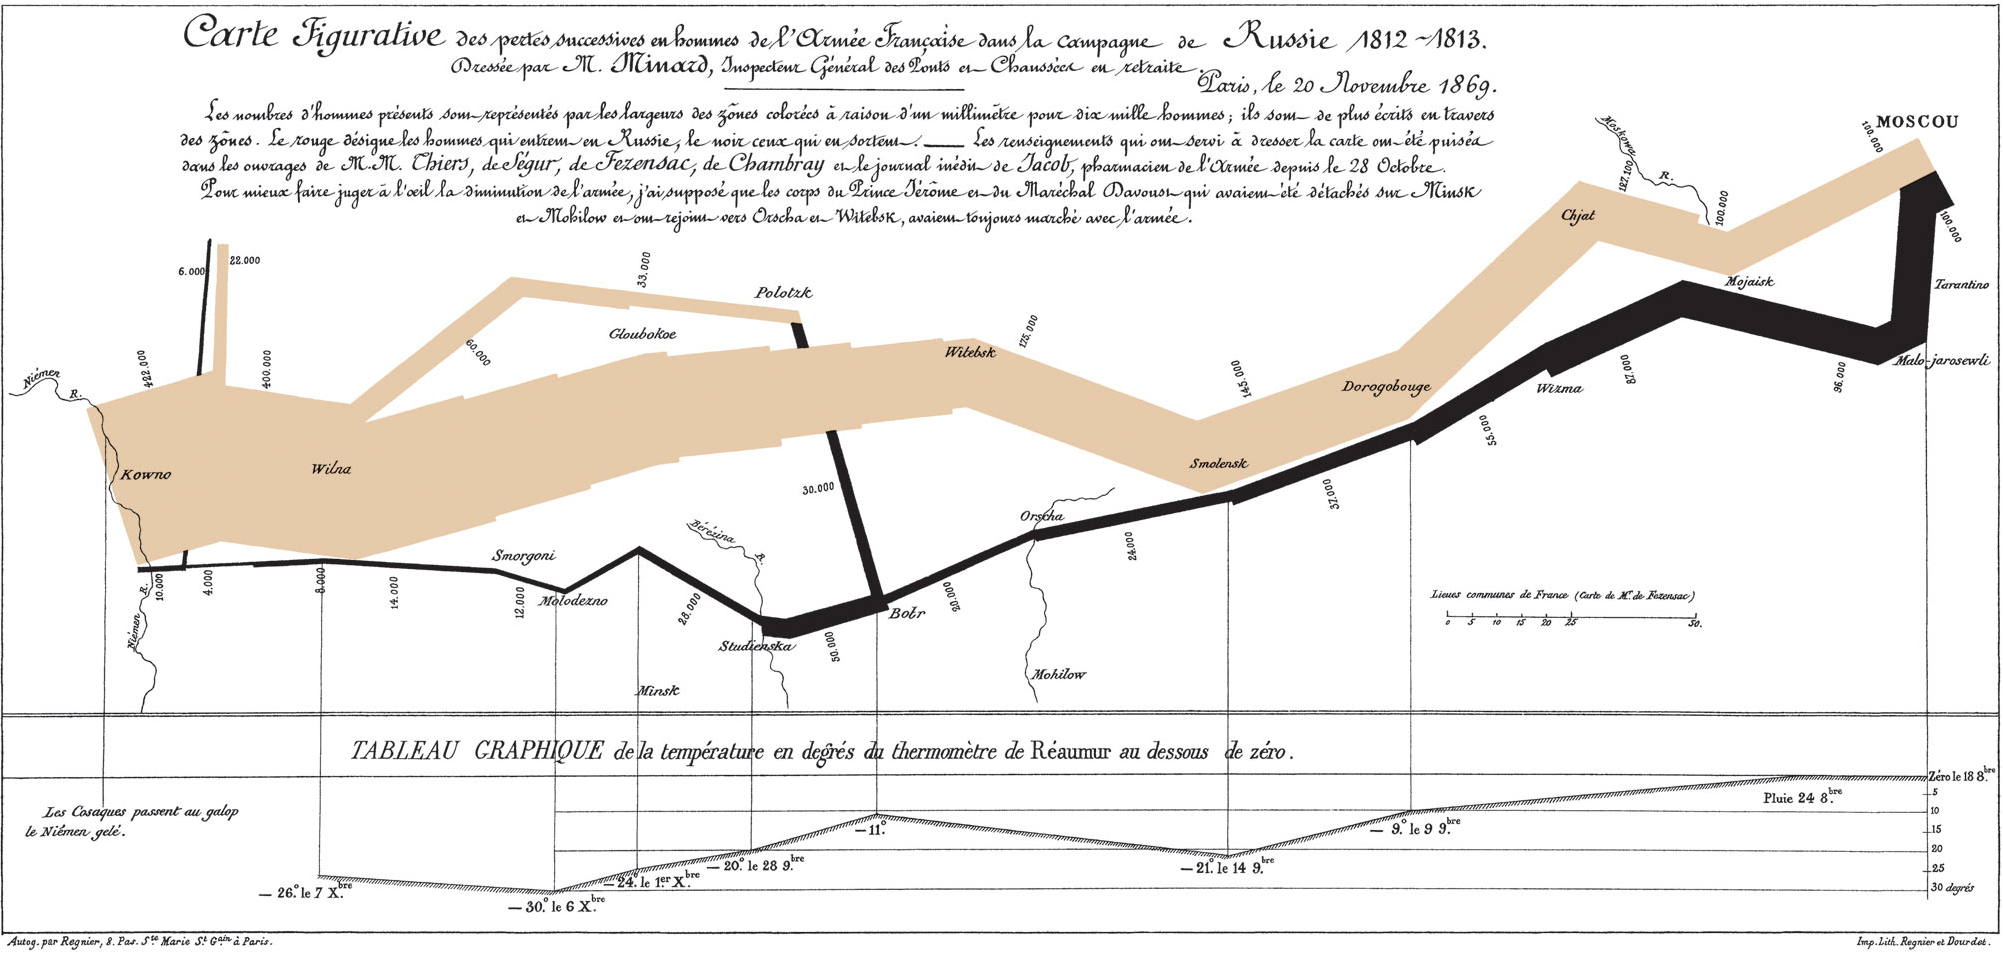
Napoleon's March
Charles Joseph Minard
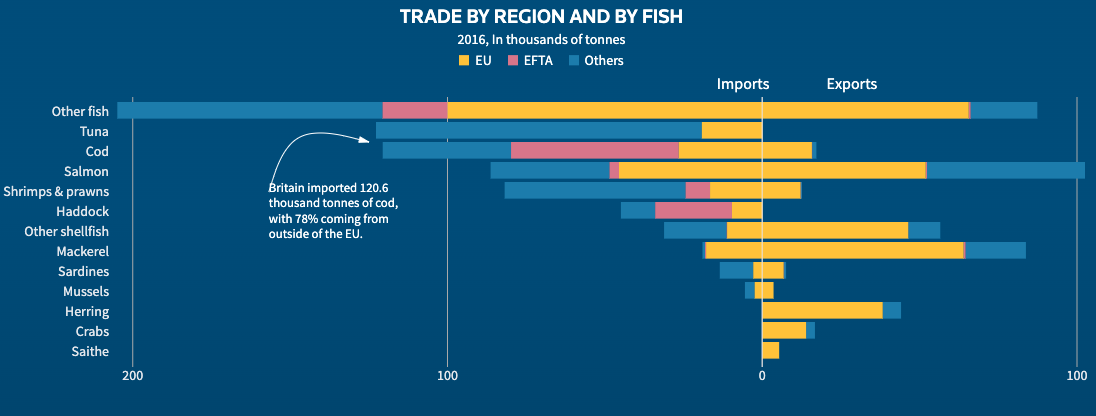
Navigating Brexit Waters
Reuters
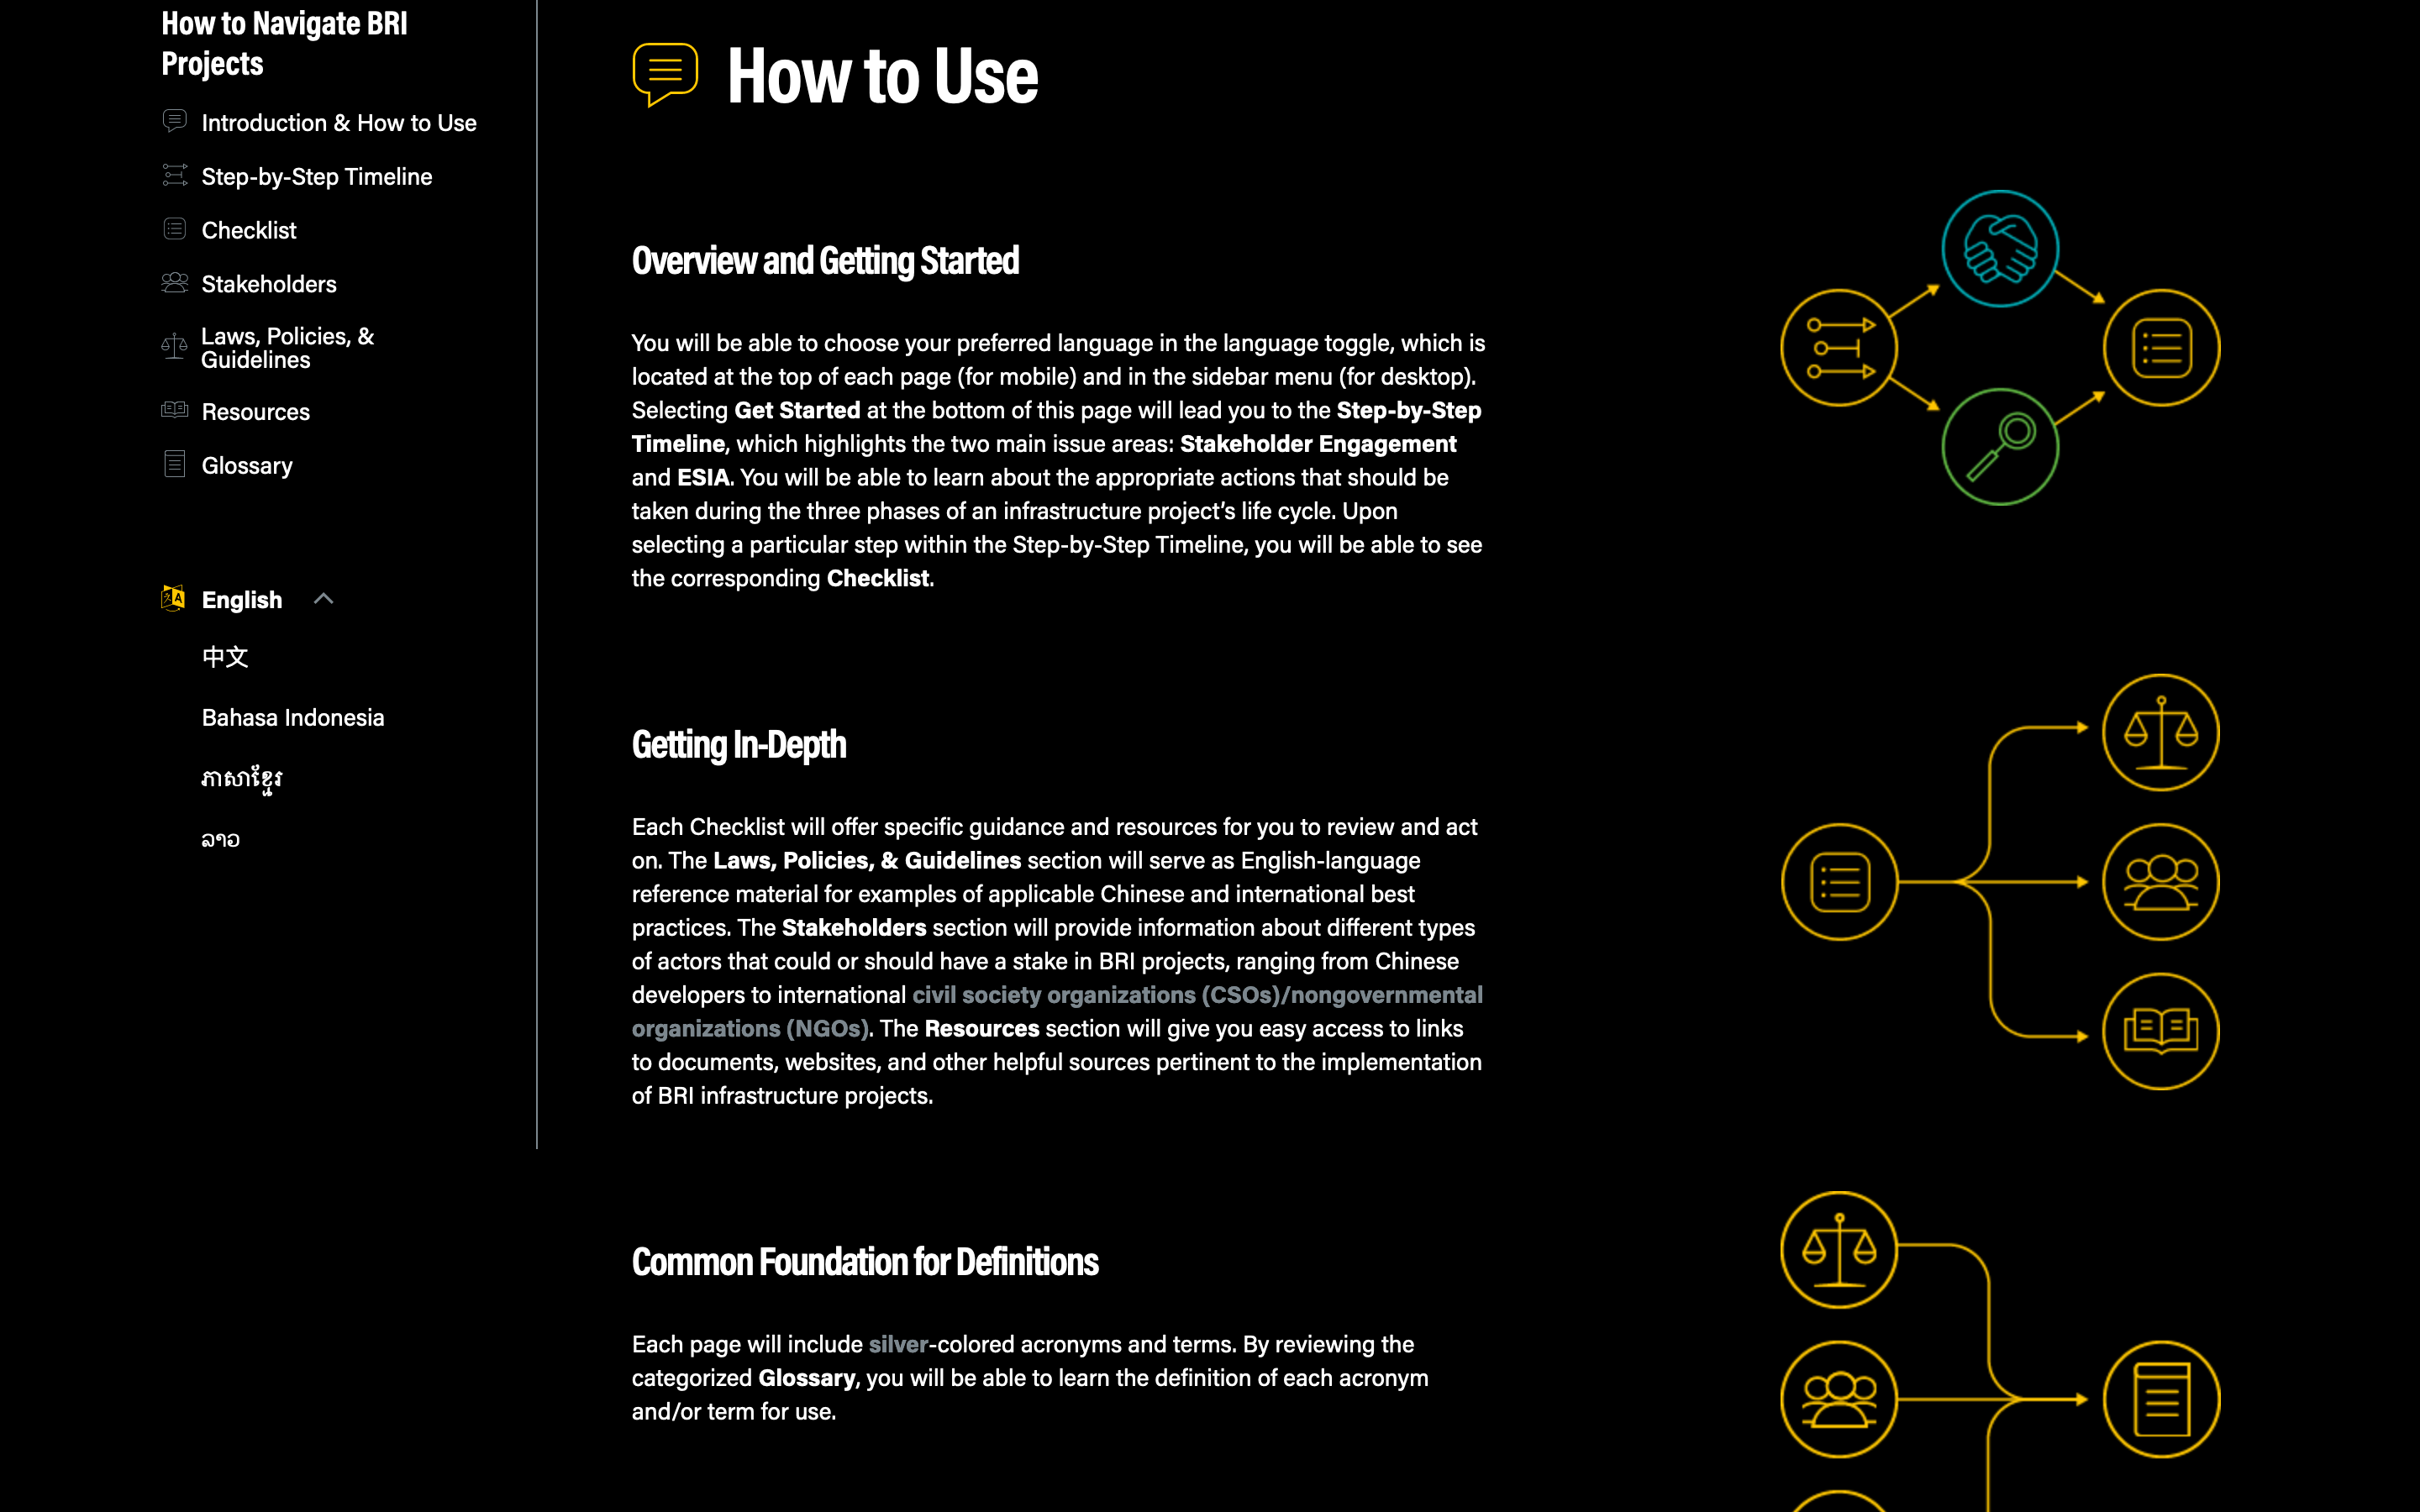
Navigating the Belt and Road Initiative Toolkit
Asia Society
NBStudio Londons Kerning
NB Studio
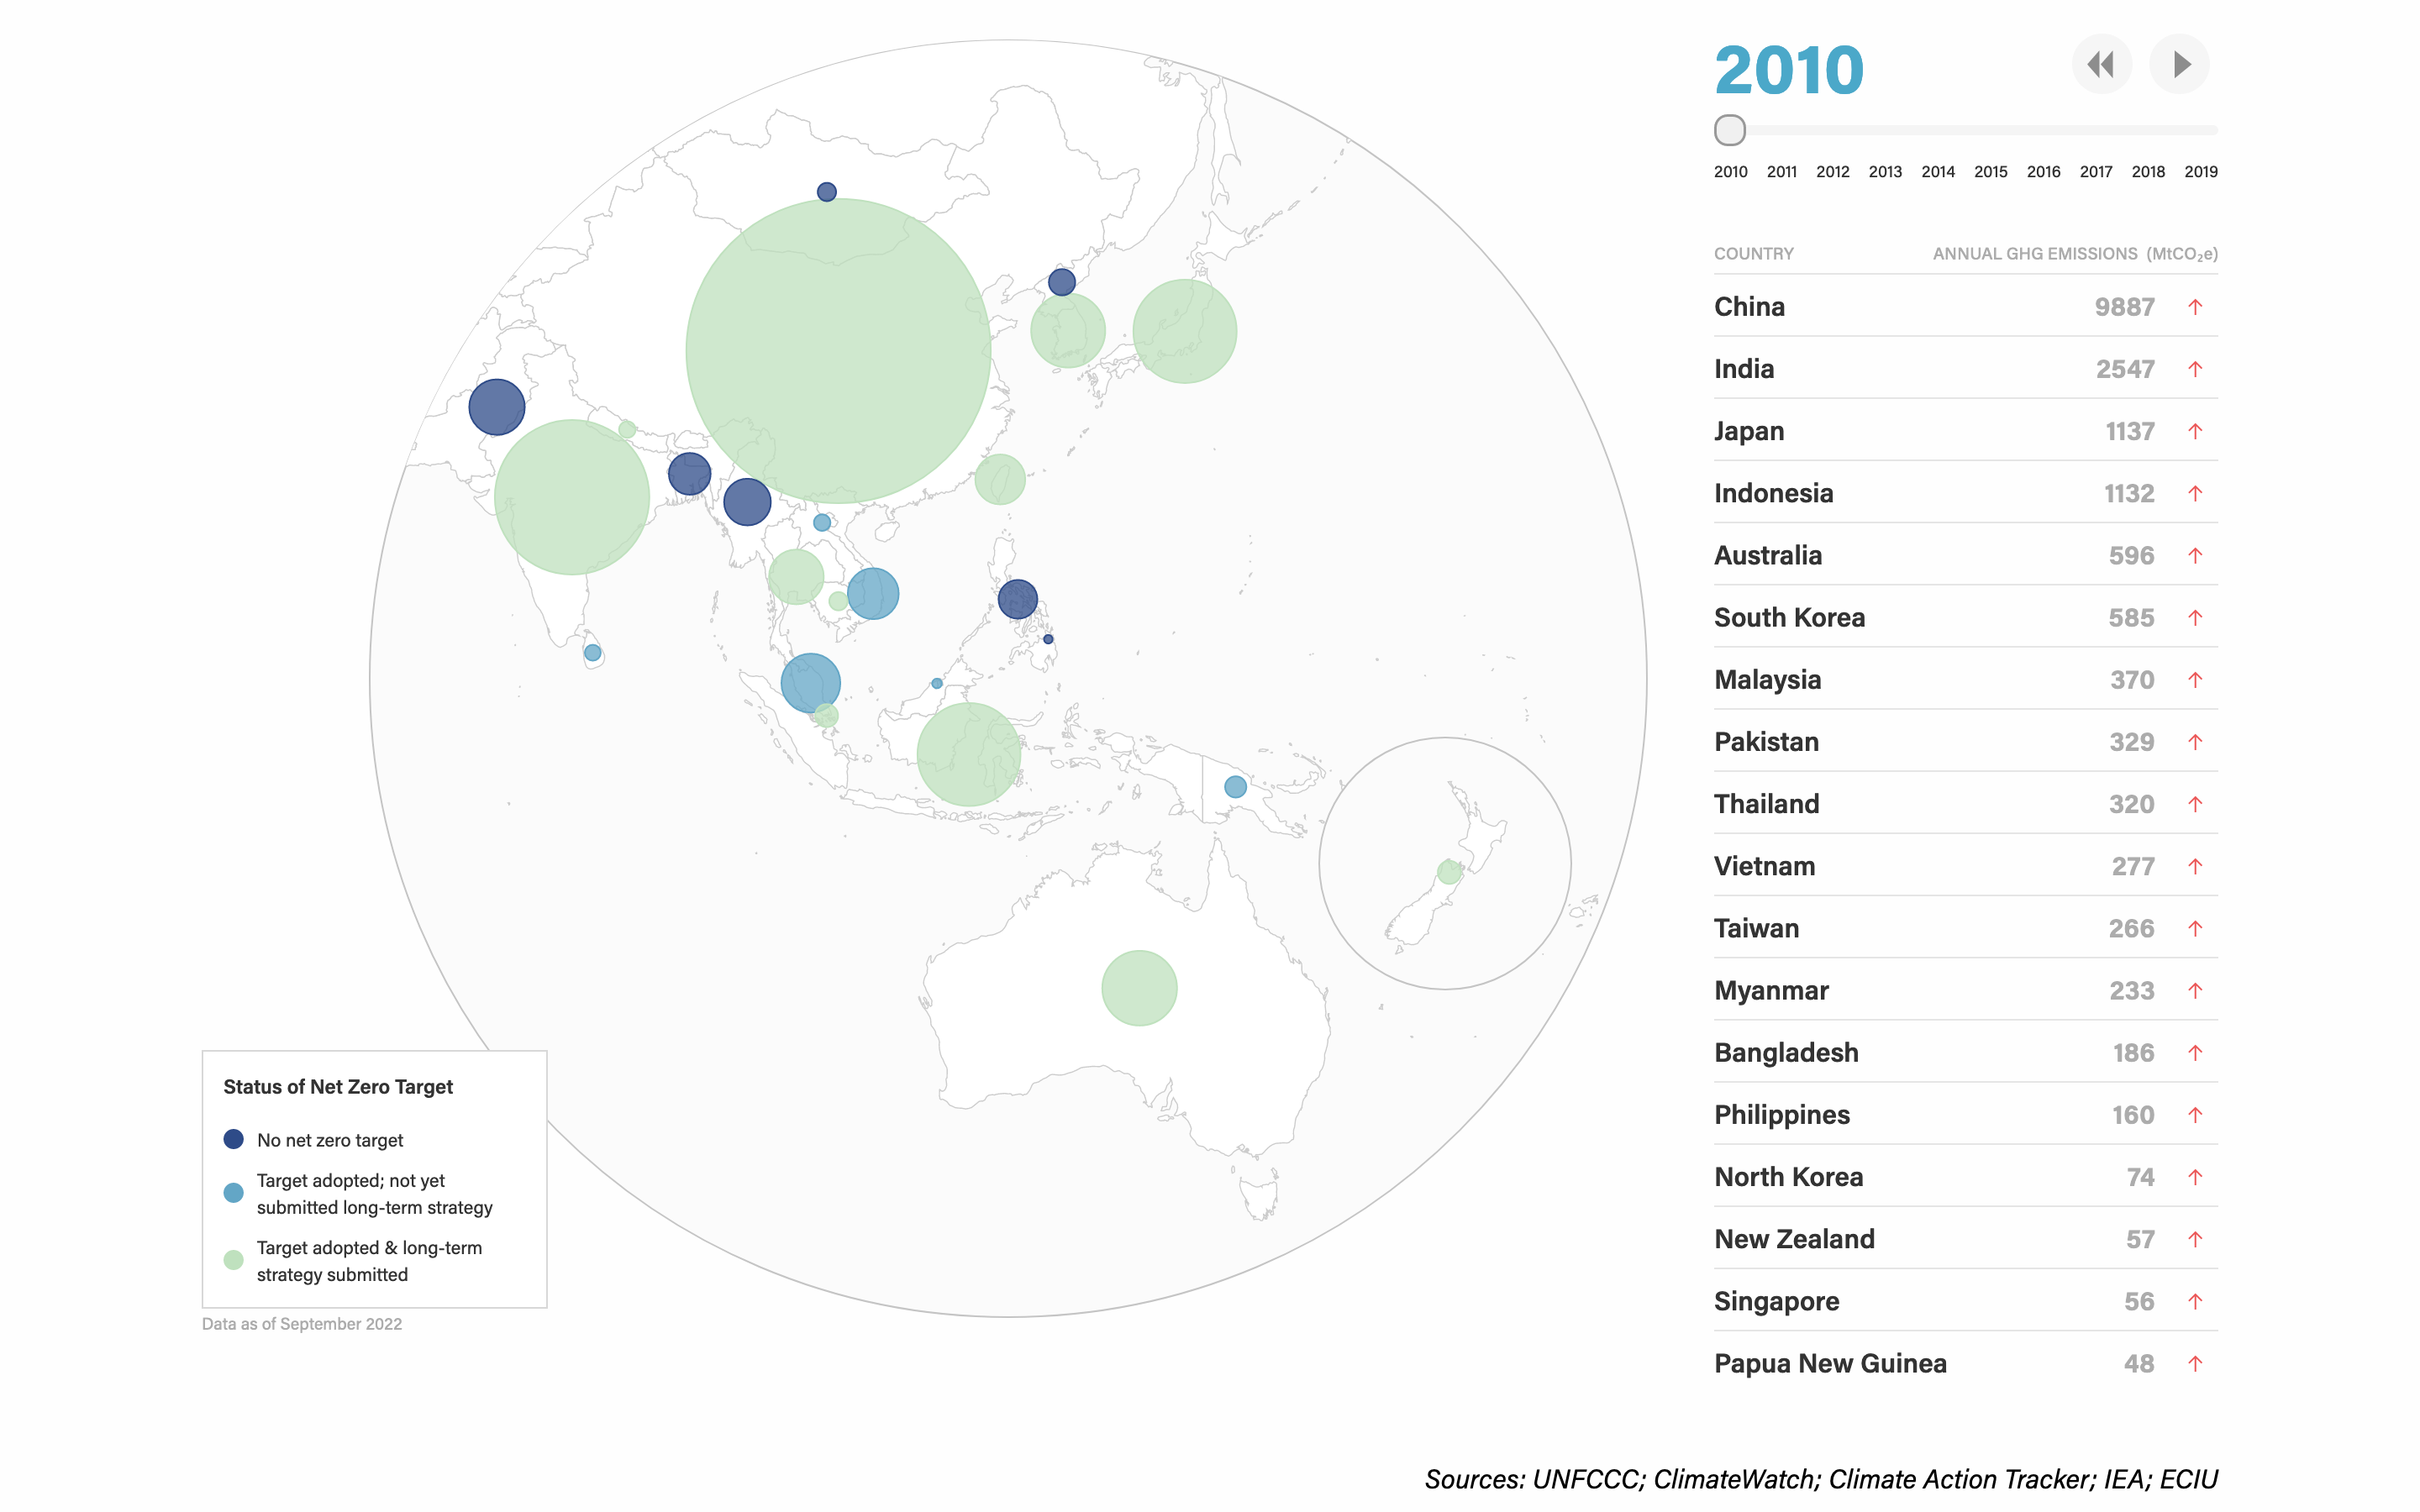
Net Zero Commission Map (High-level Policy Commission on Getting Asia to Net Zero)
Asia Society
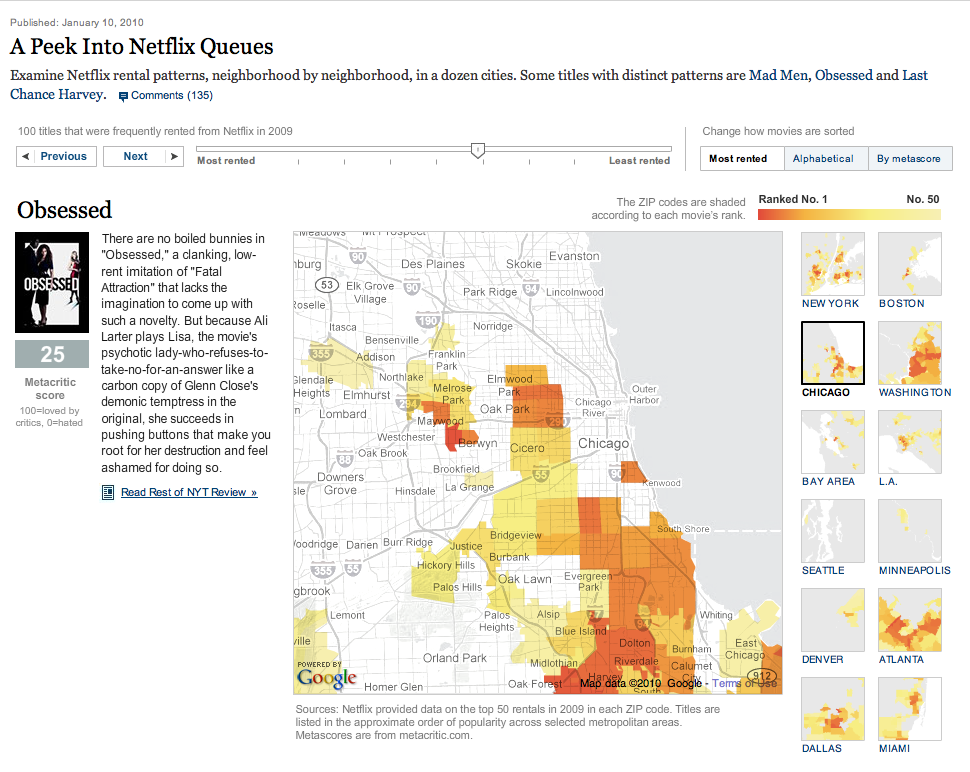
Netflix Queues
New York Times Graphics
Netflix Sustainability Journey
Neuralink
Neuralink
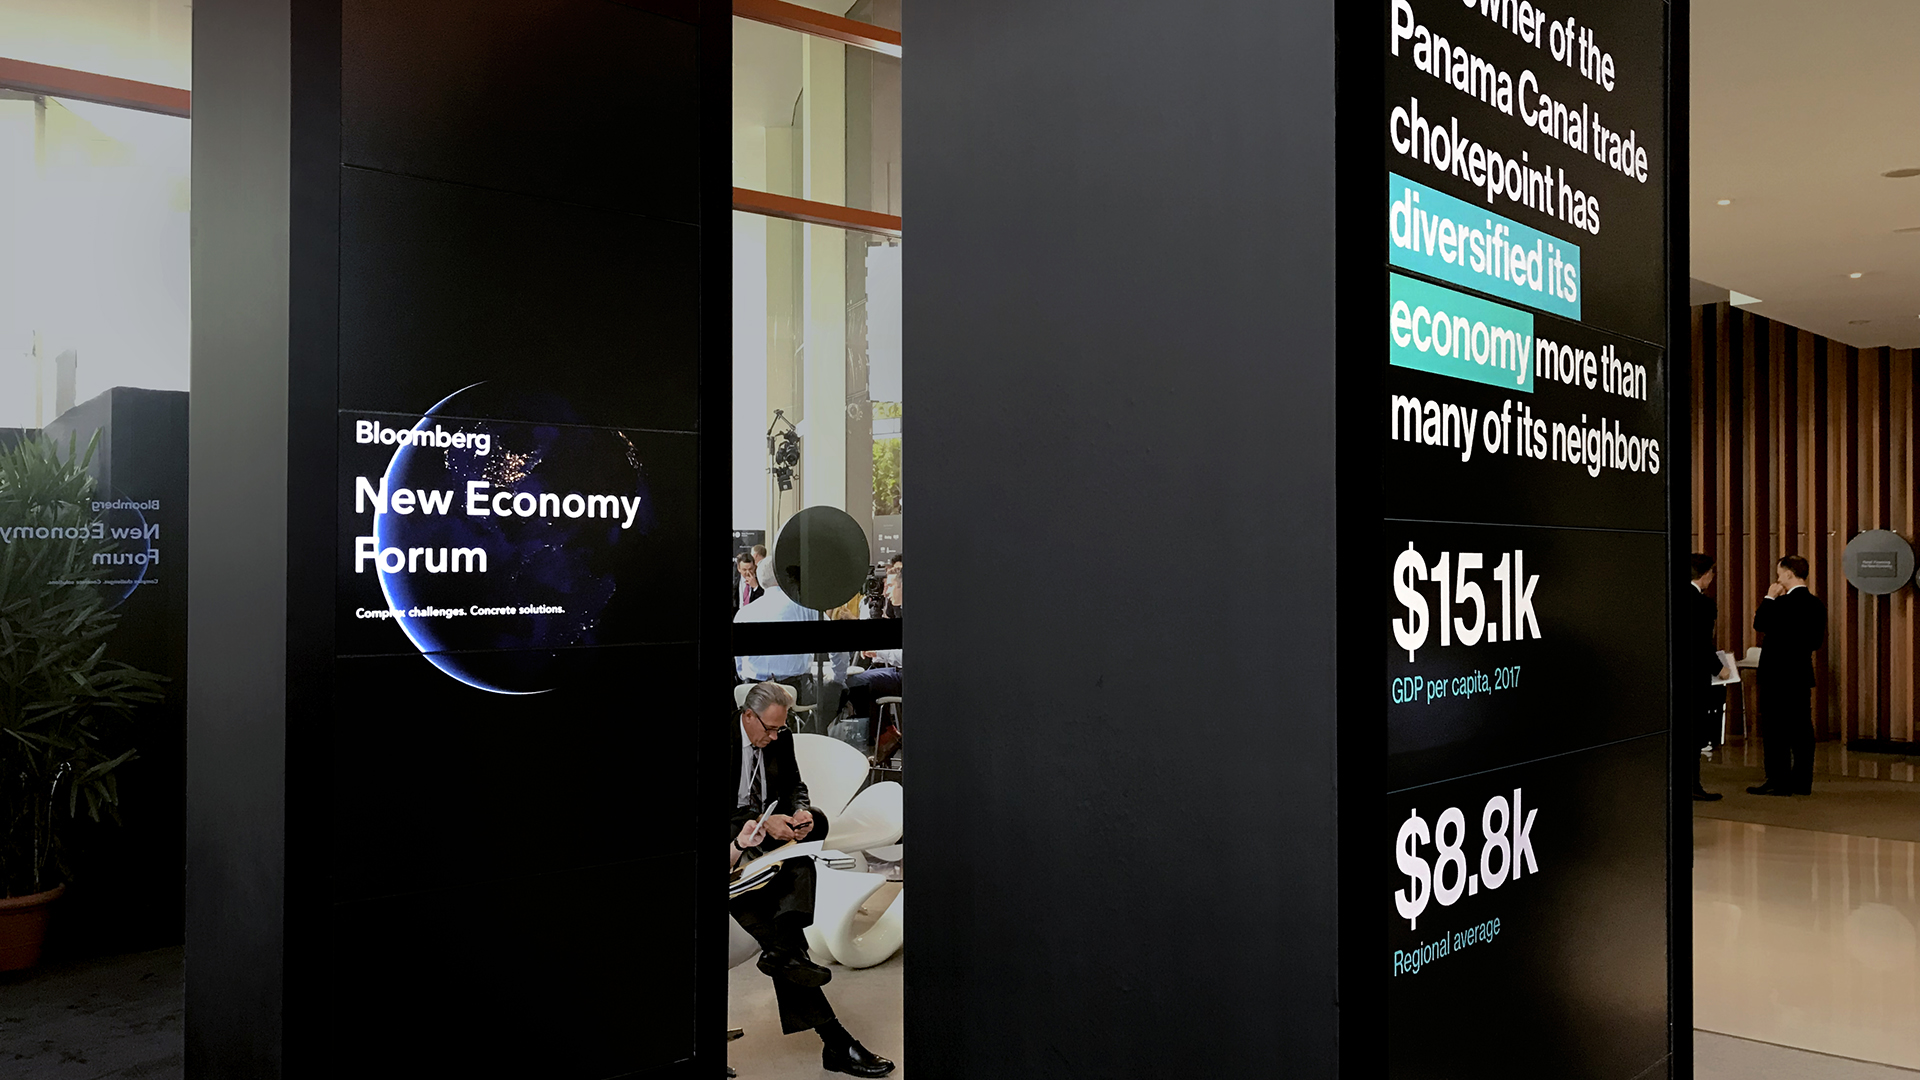
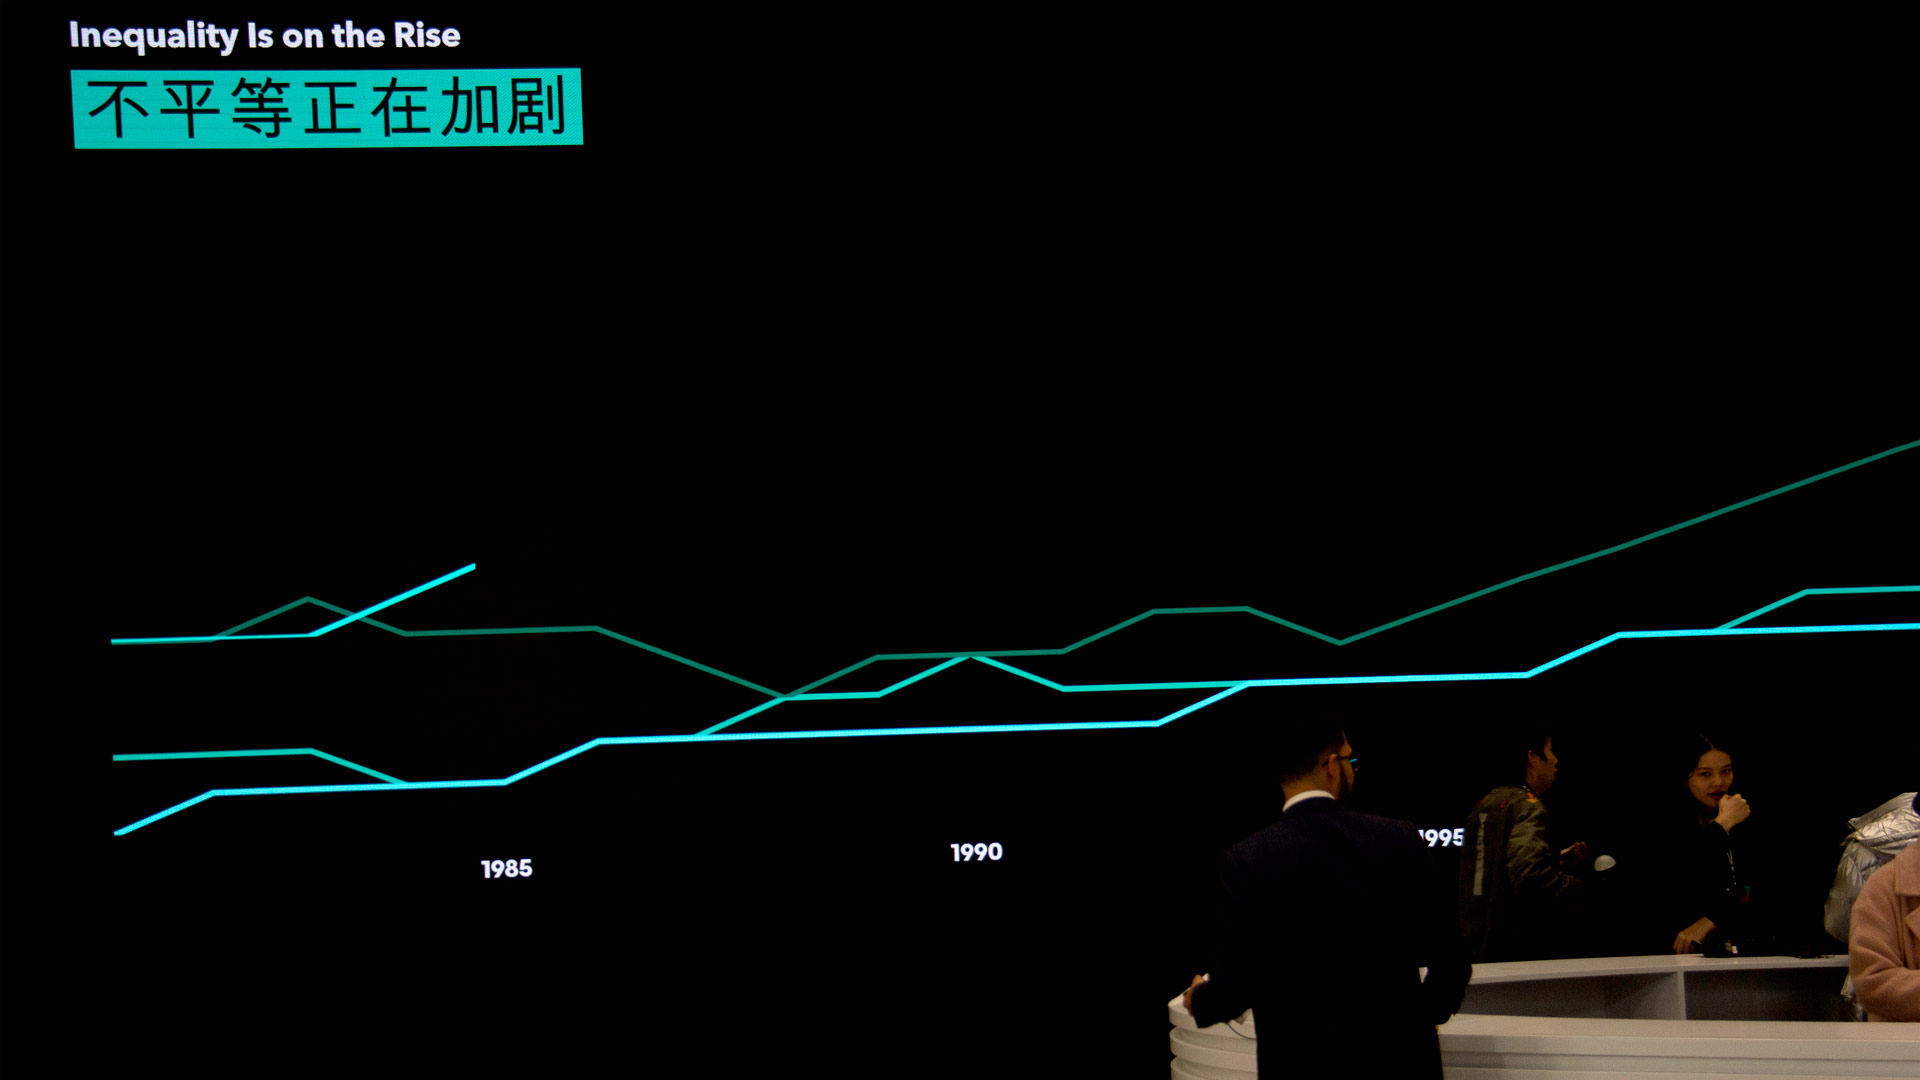
New Economy Forum 2018
Schema Design
New Economy Forum 2019
Schema Design
New Economy Forum 2021
Schema Design
New Economy Forum 2022
Schema Design
New Museum Landing Page
New Museum
New York Times Illustrations
Simon Thorpe
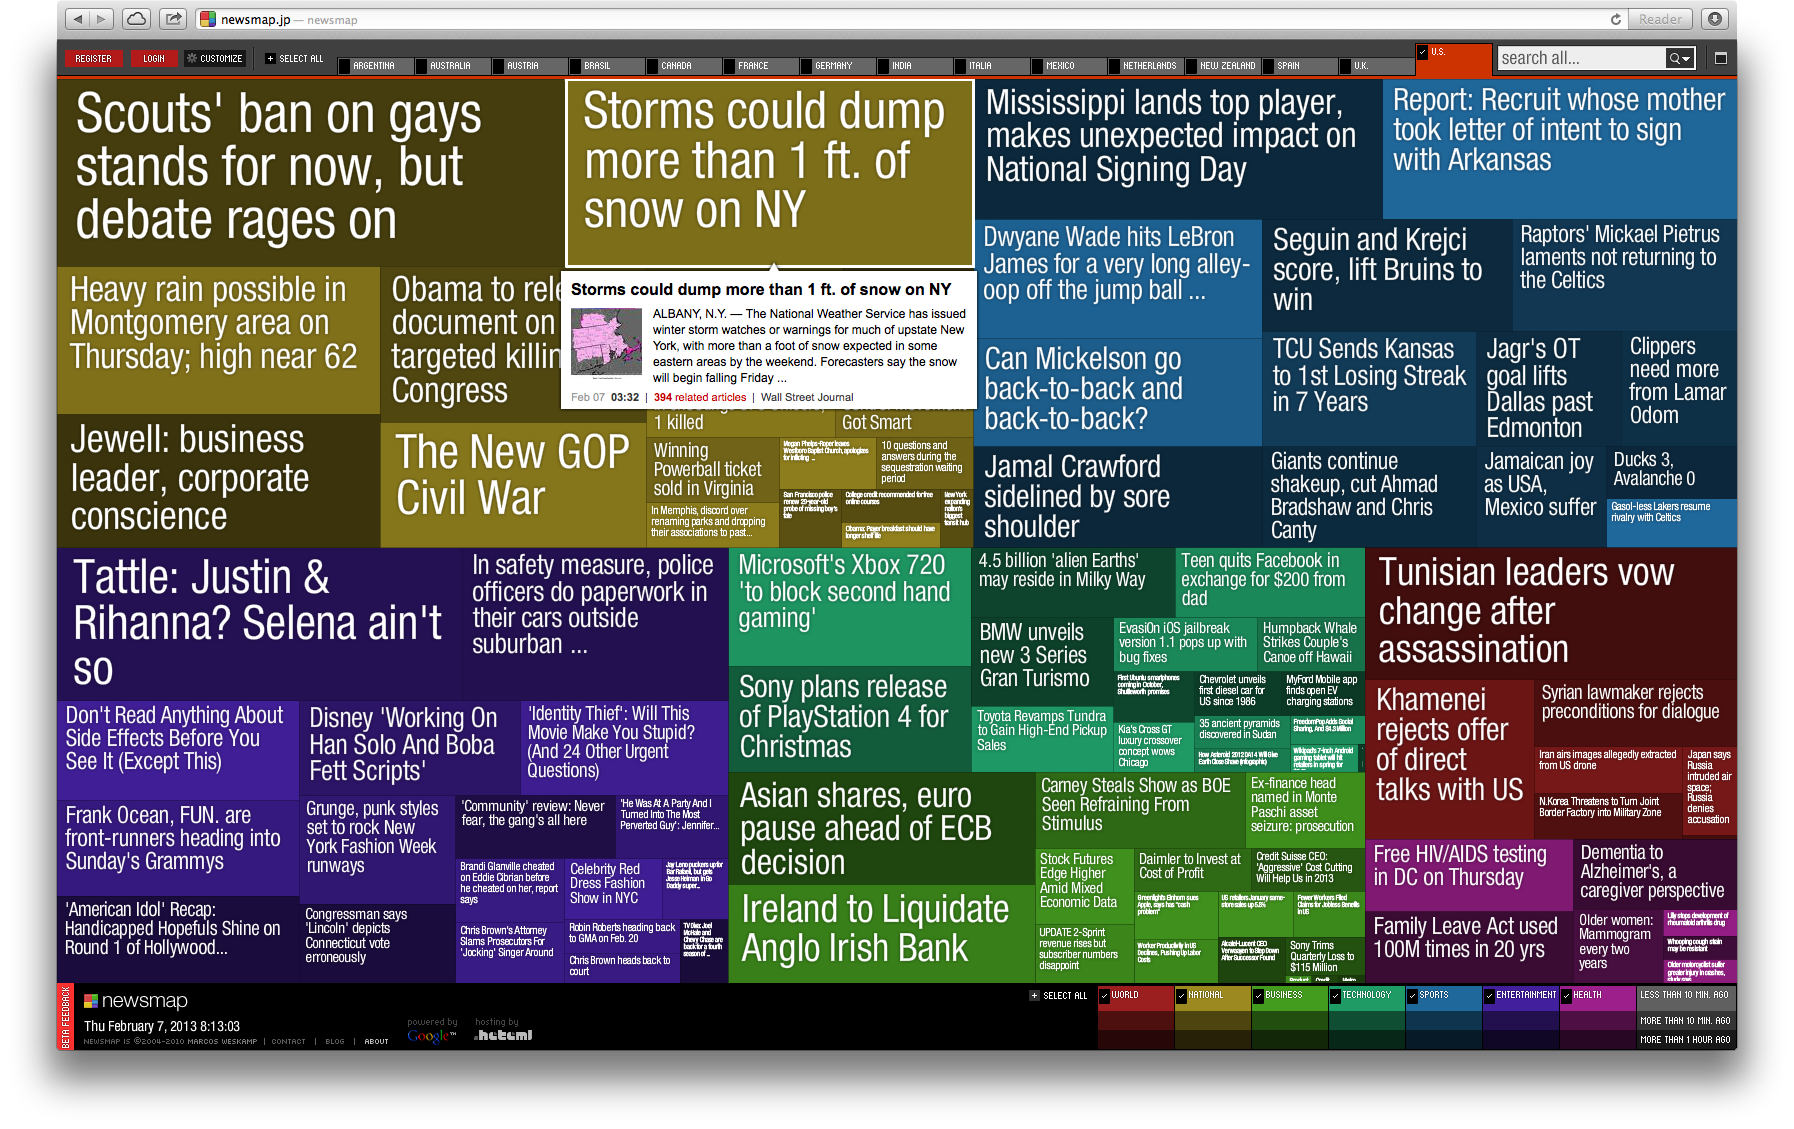
Newsmap
Marcos Weskamp
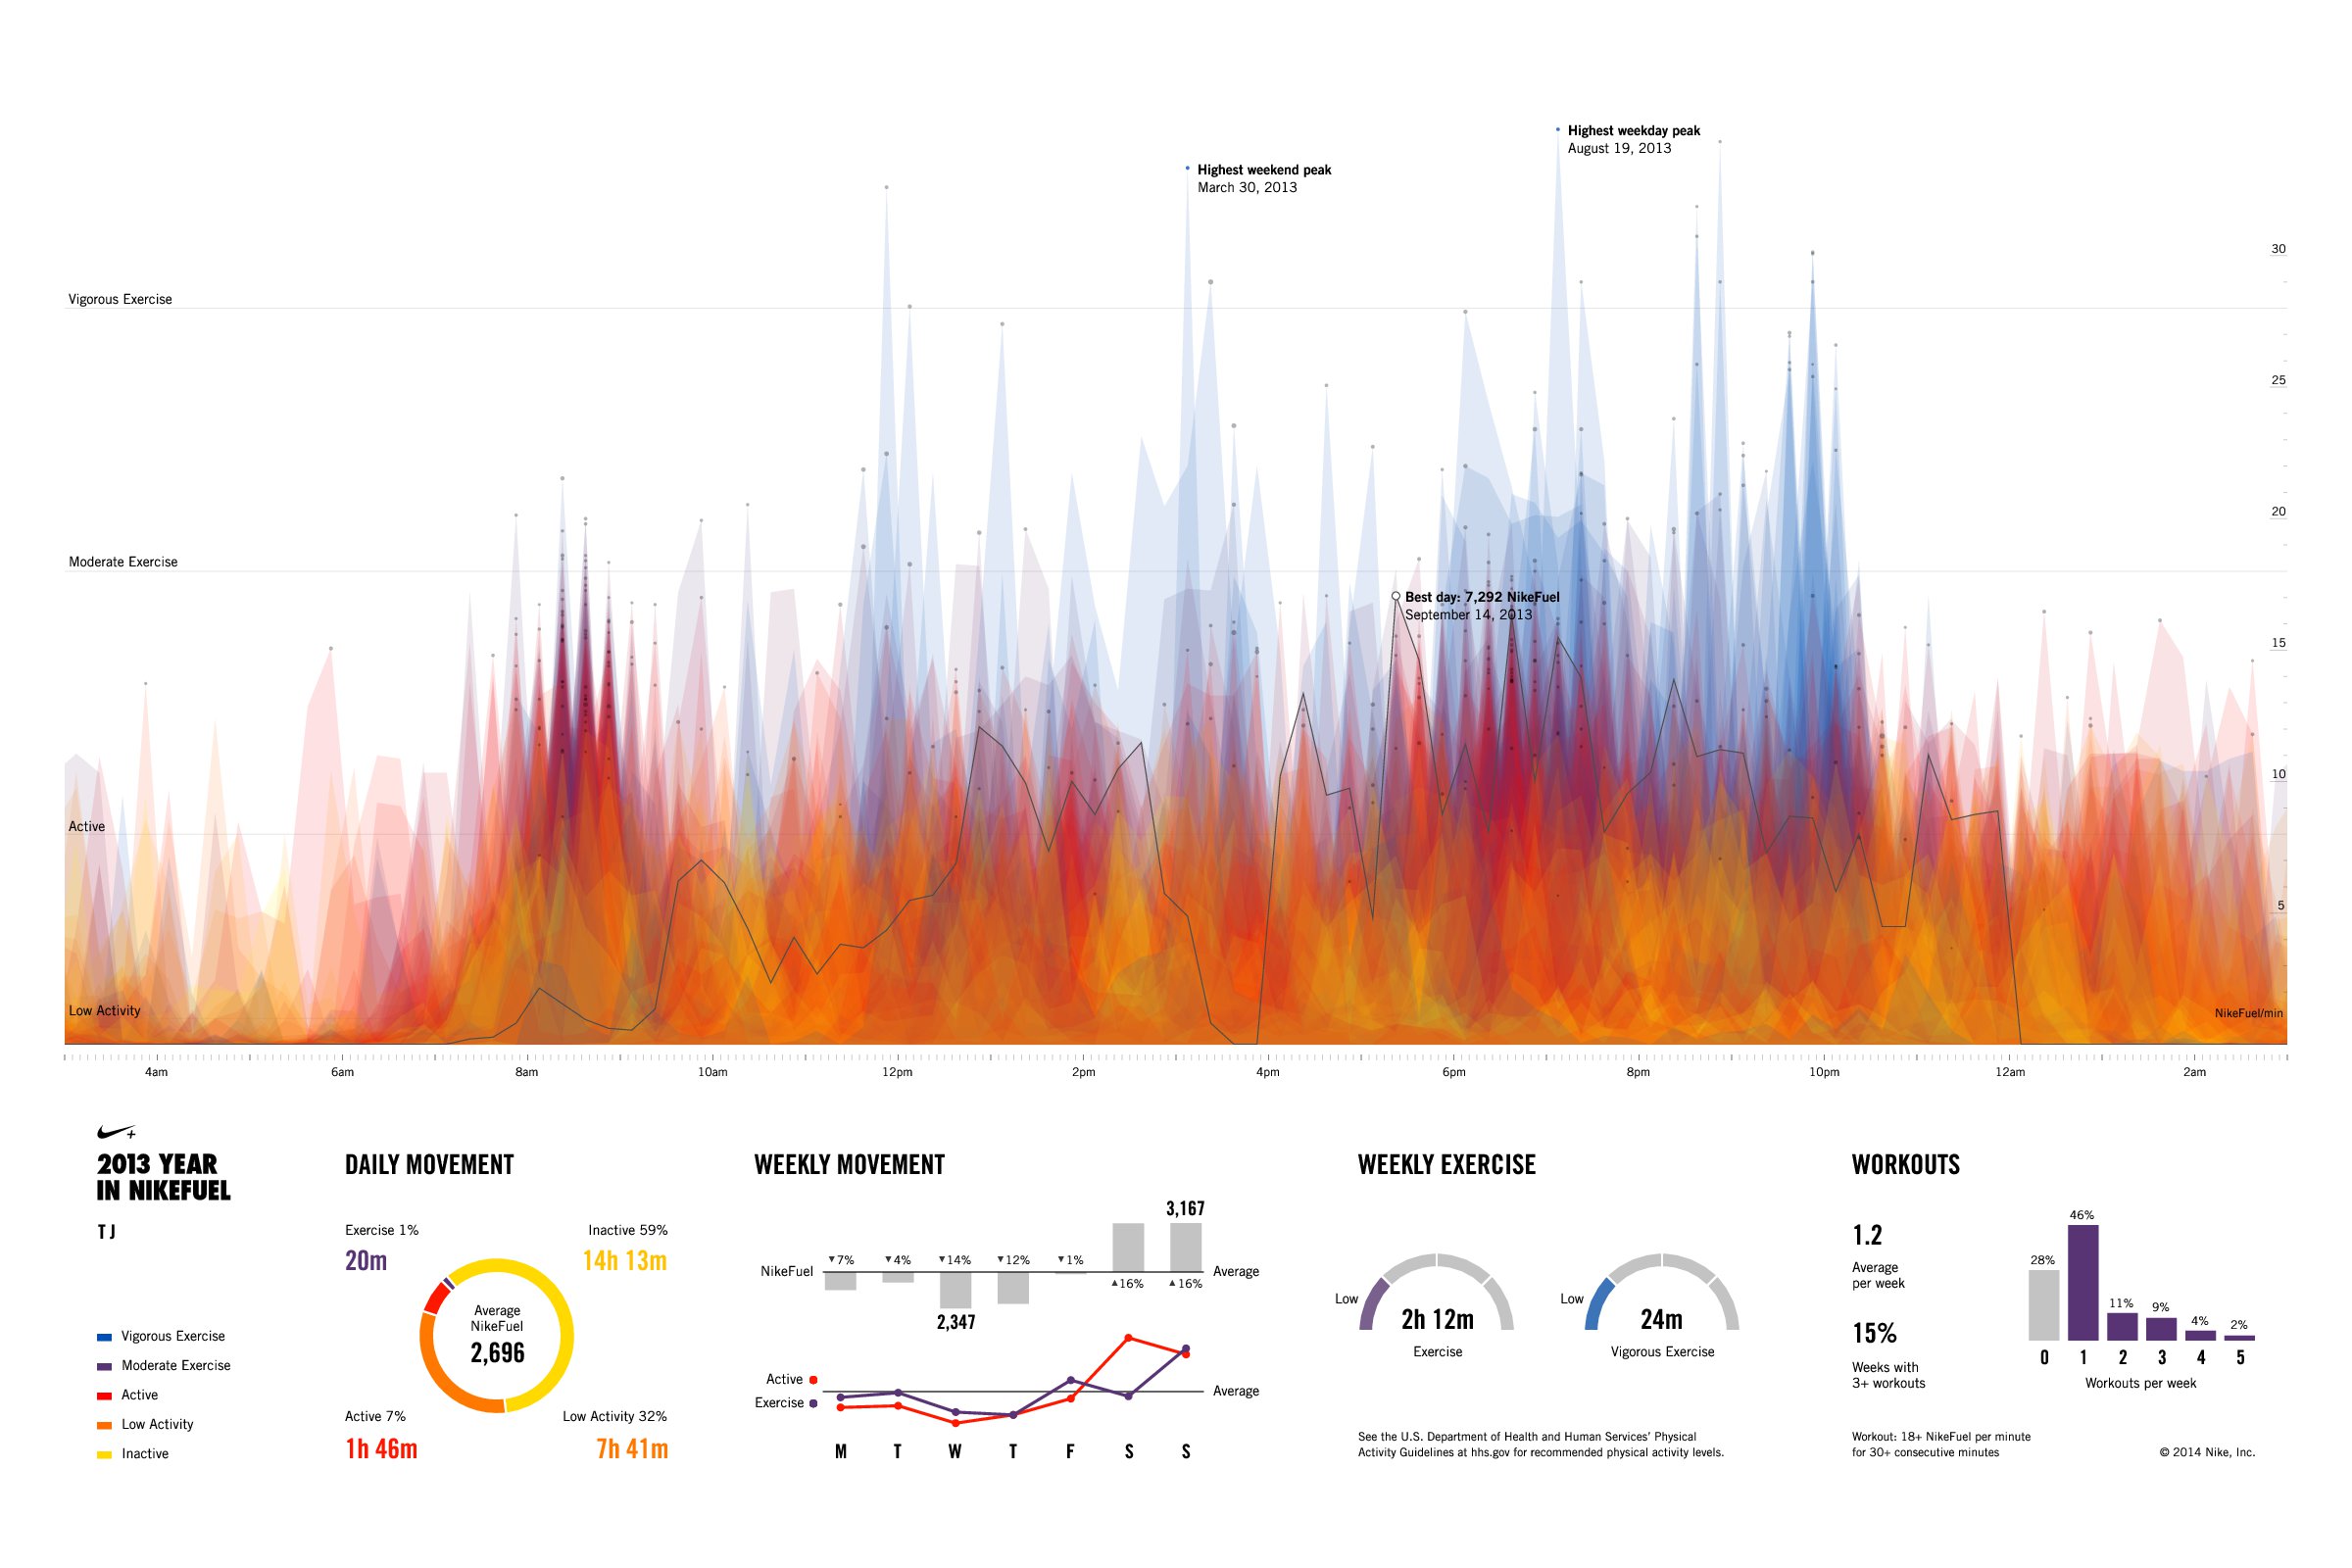
Nike Fuel
Fathom Information Design

Nike Twitter Playoffs
Stamen Design
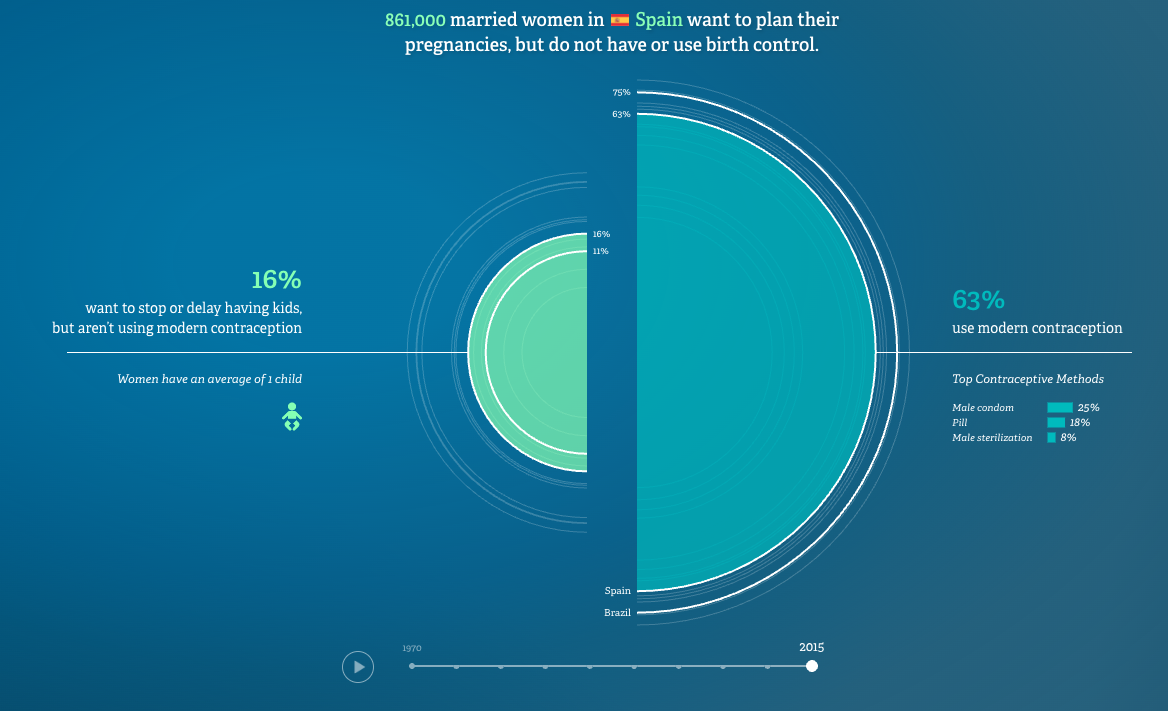
No Ceilings
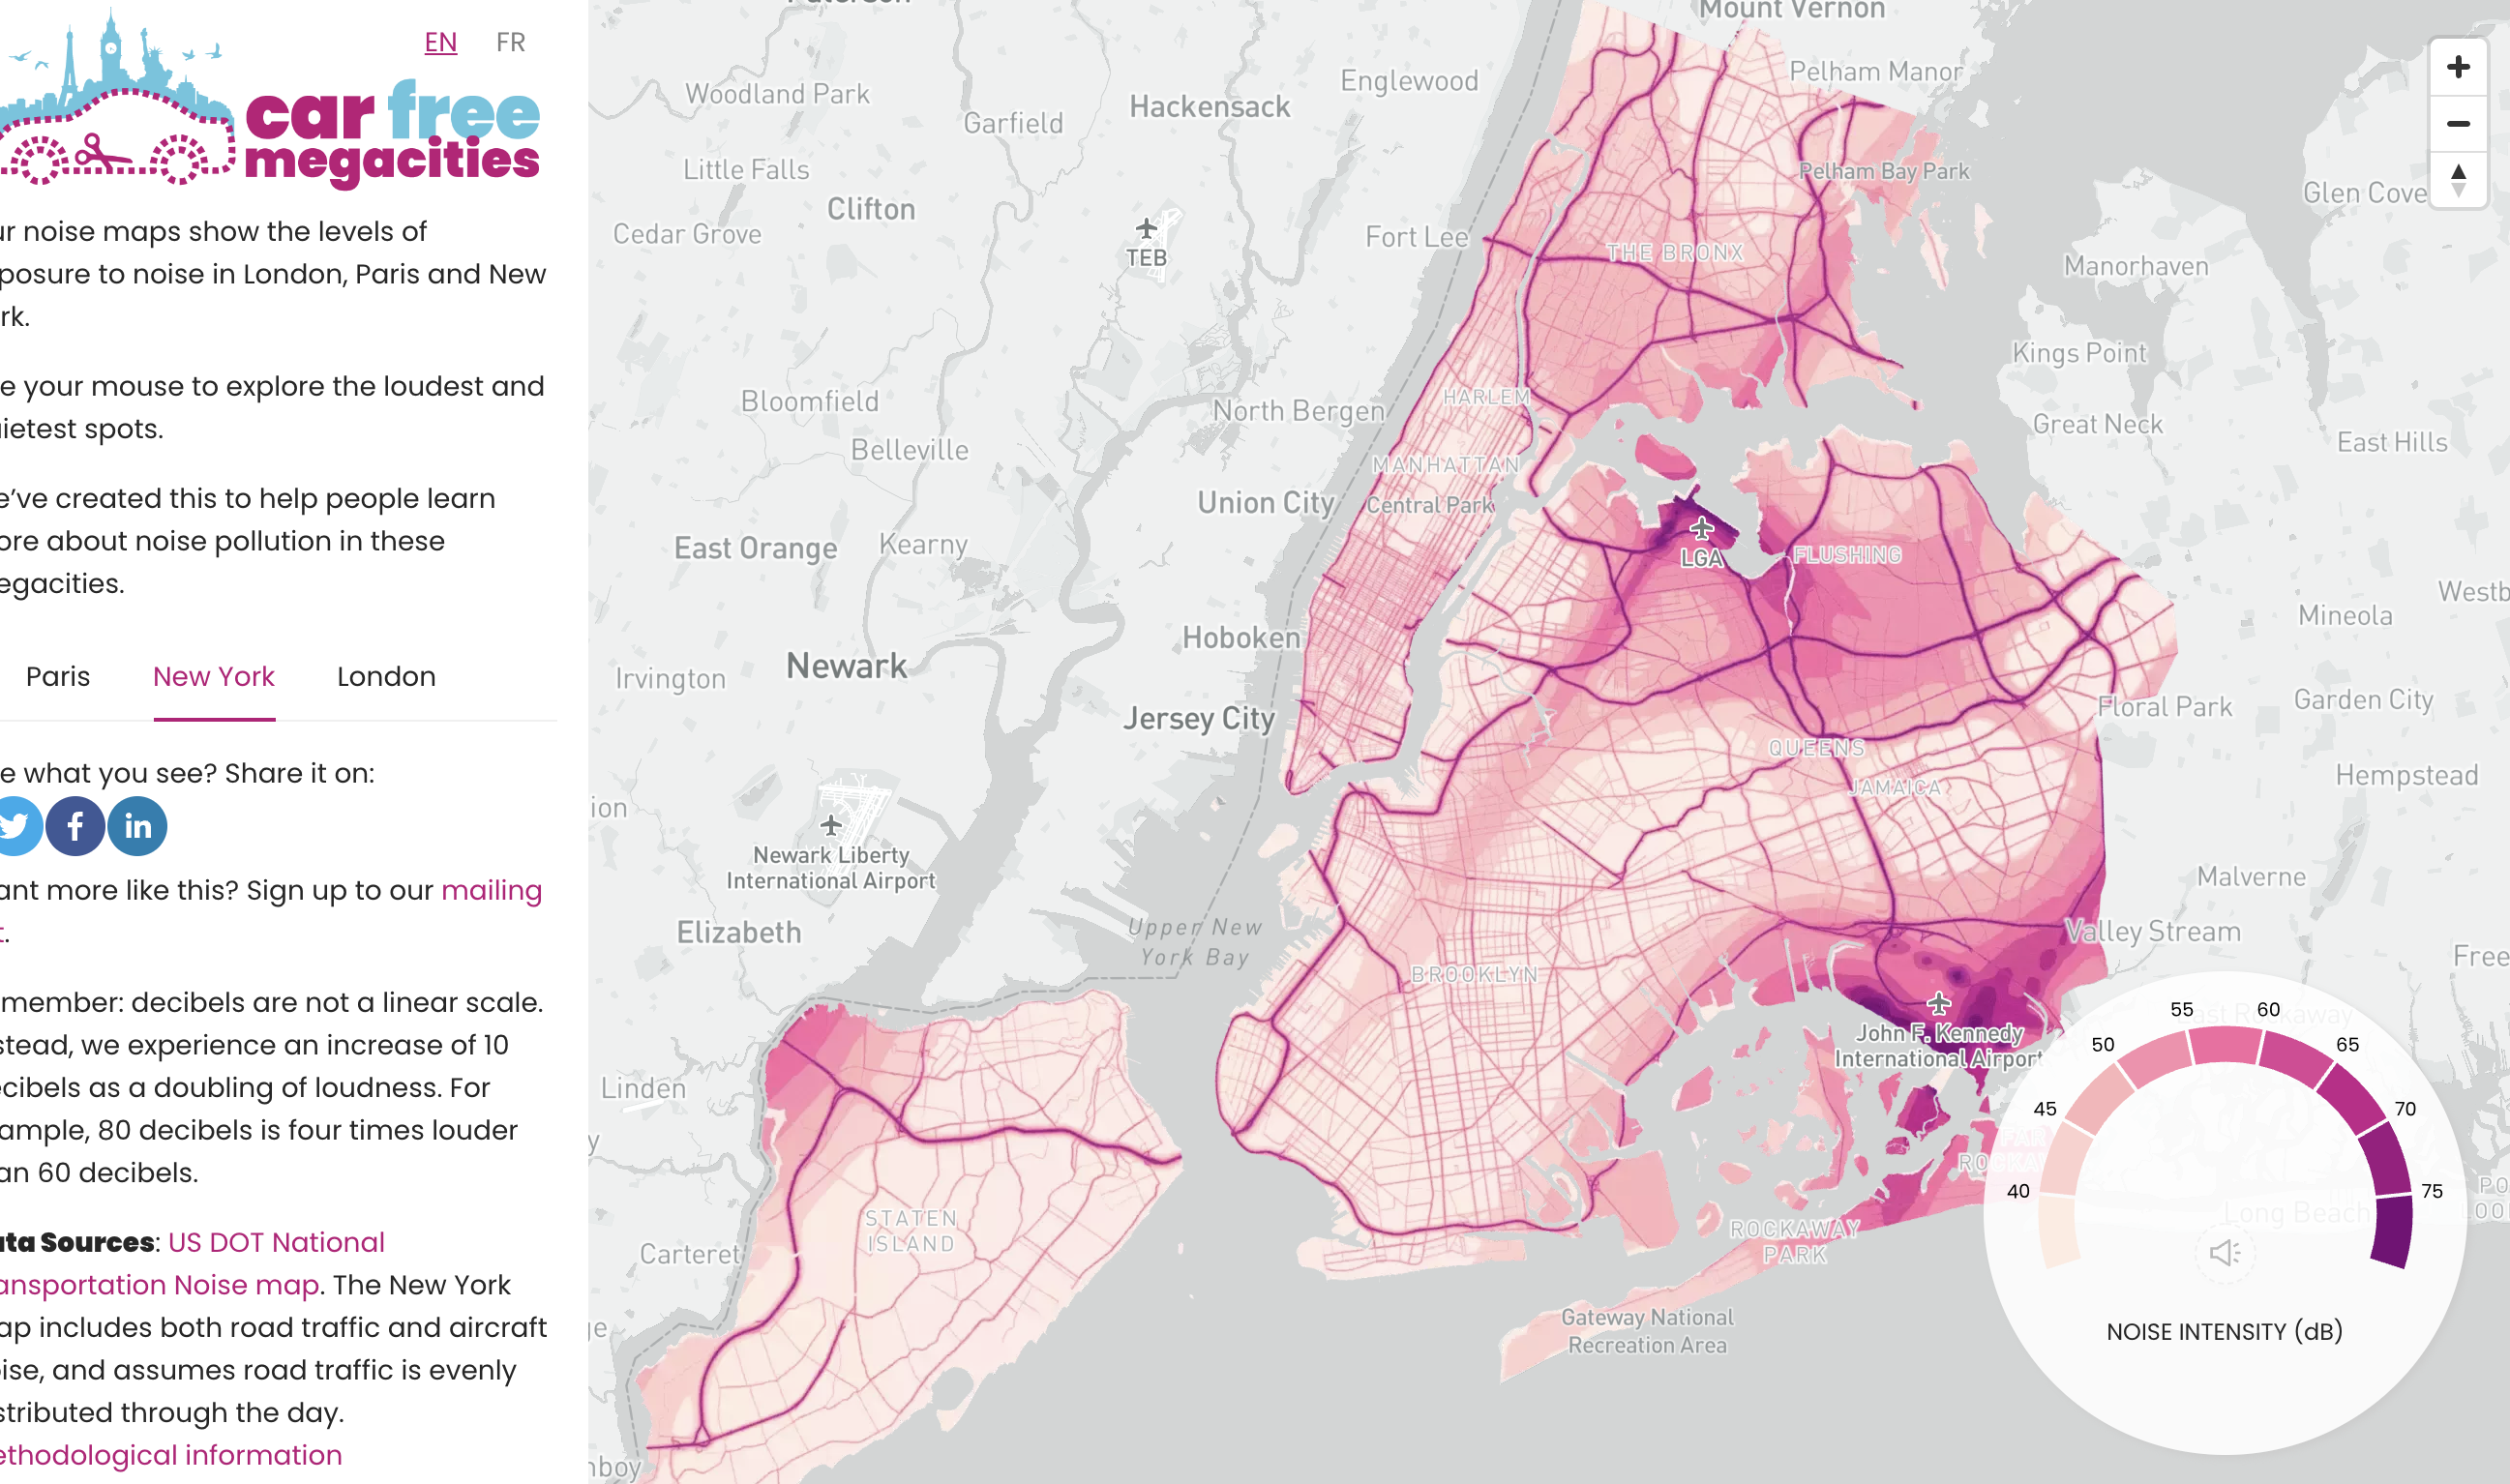
Noisy Cities
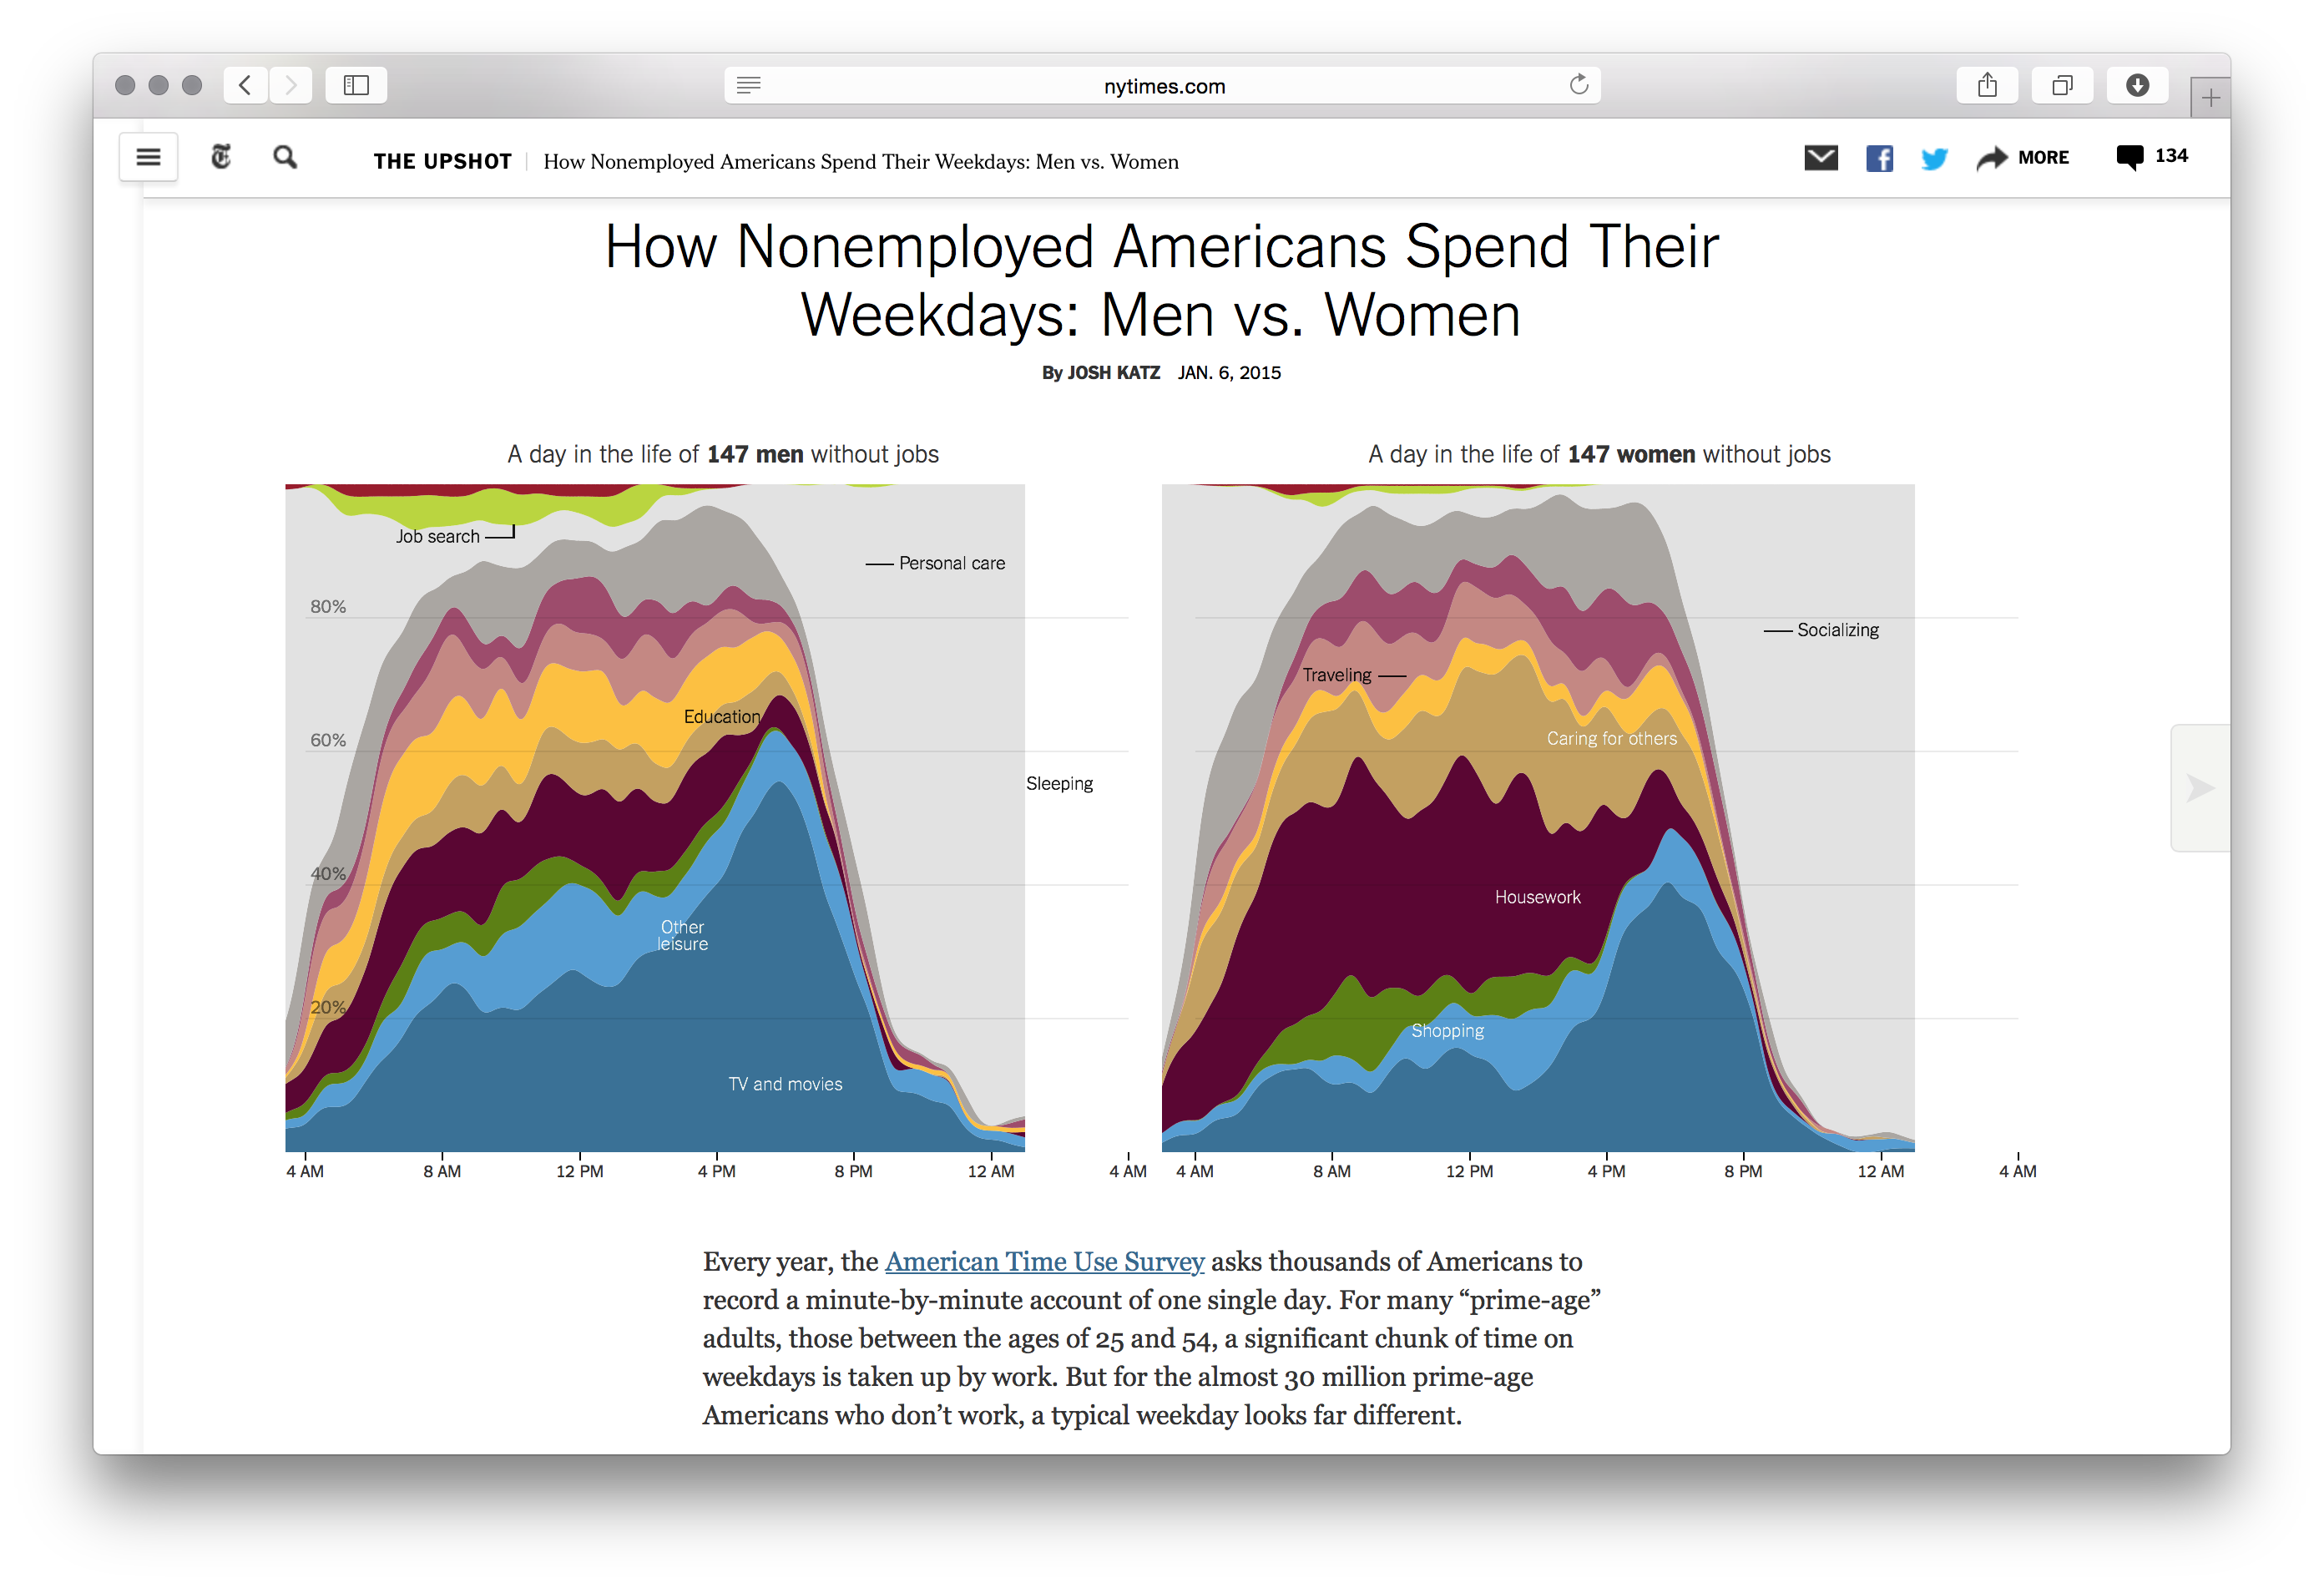
Nonemployed Americans
New York Times Graphics
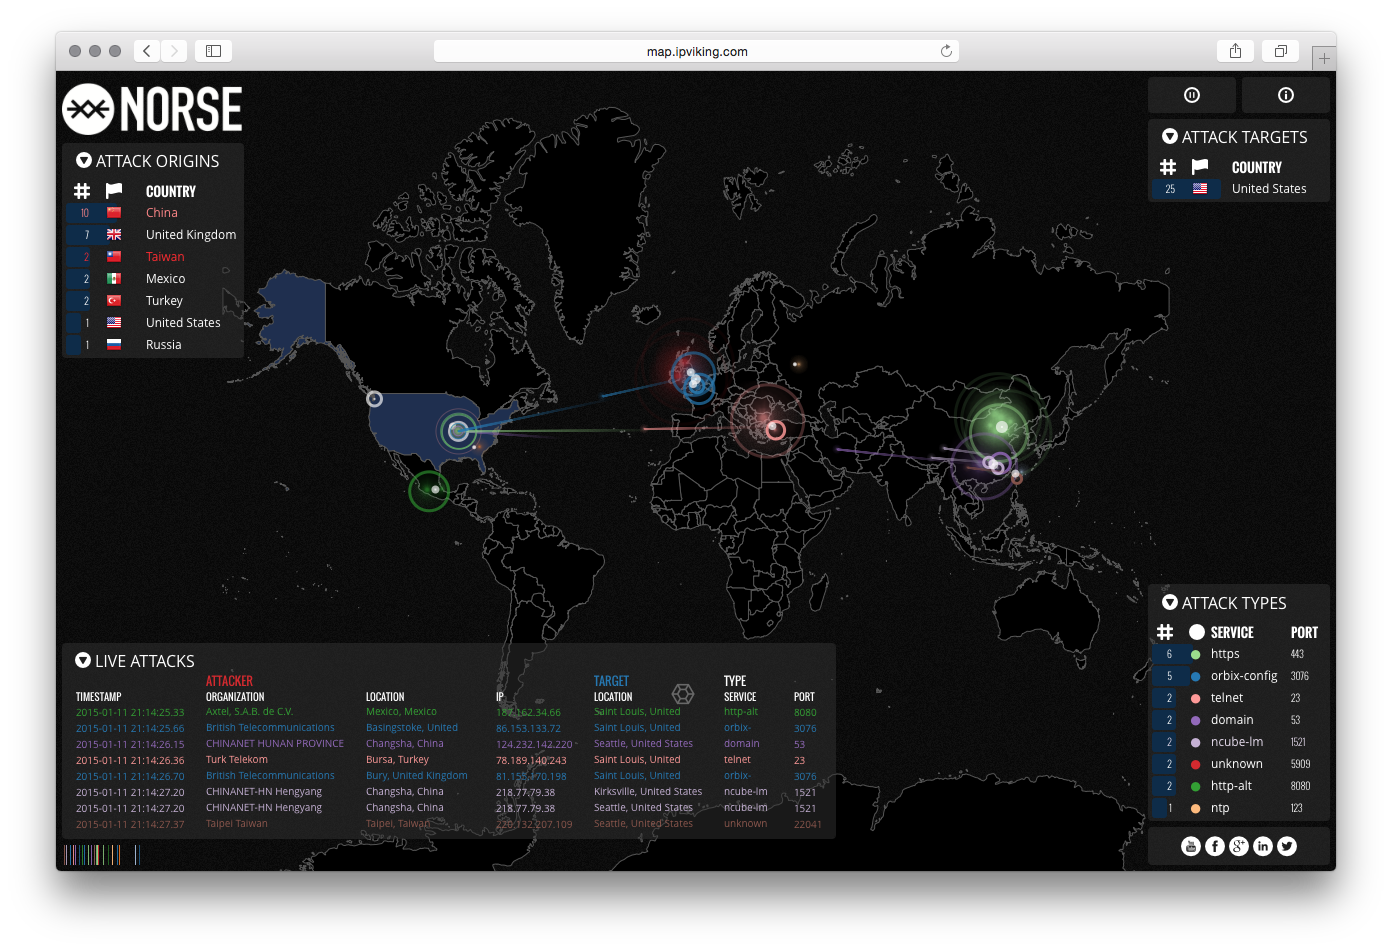
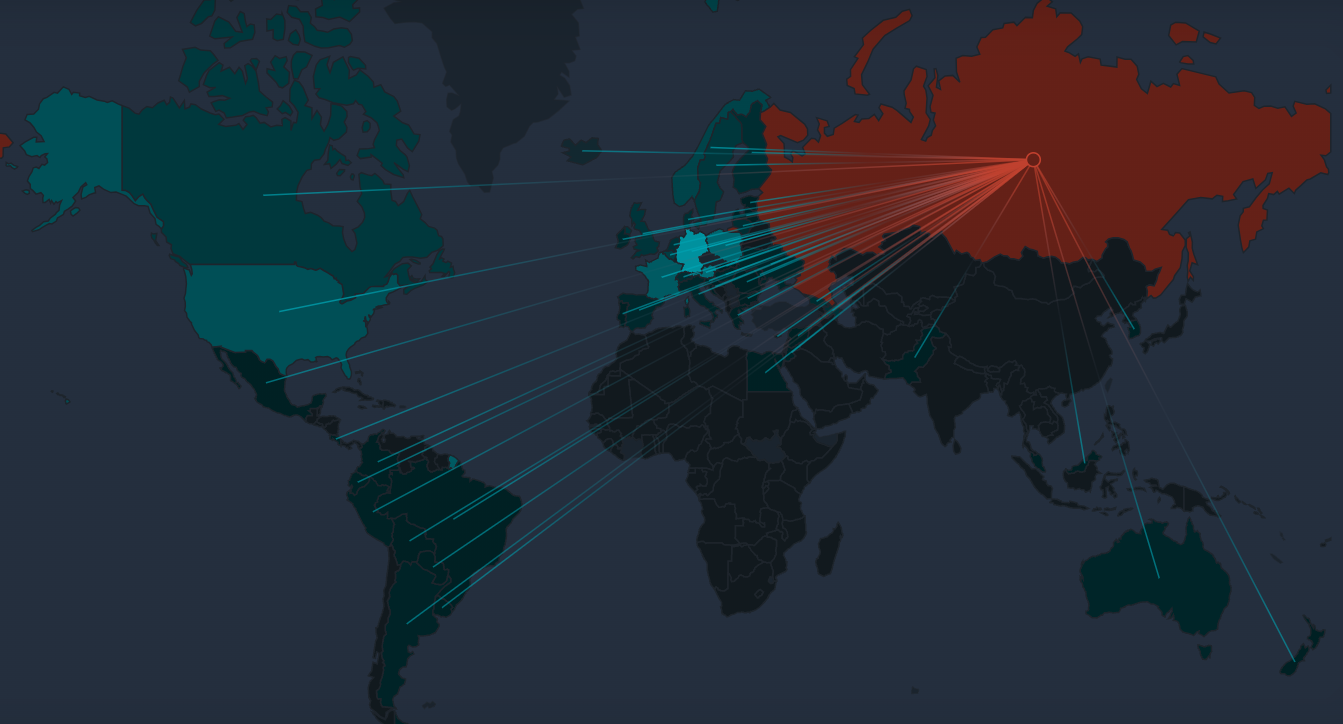
Norse Attack Map
Norse Corporation
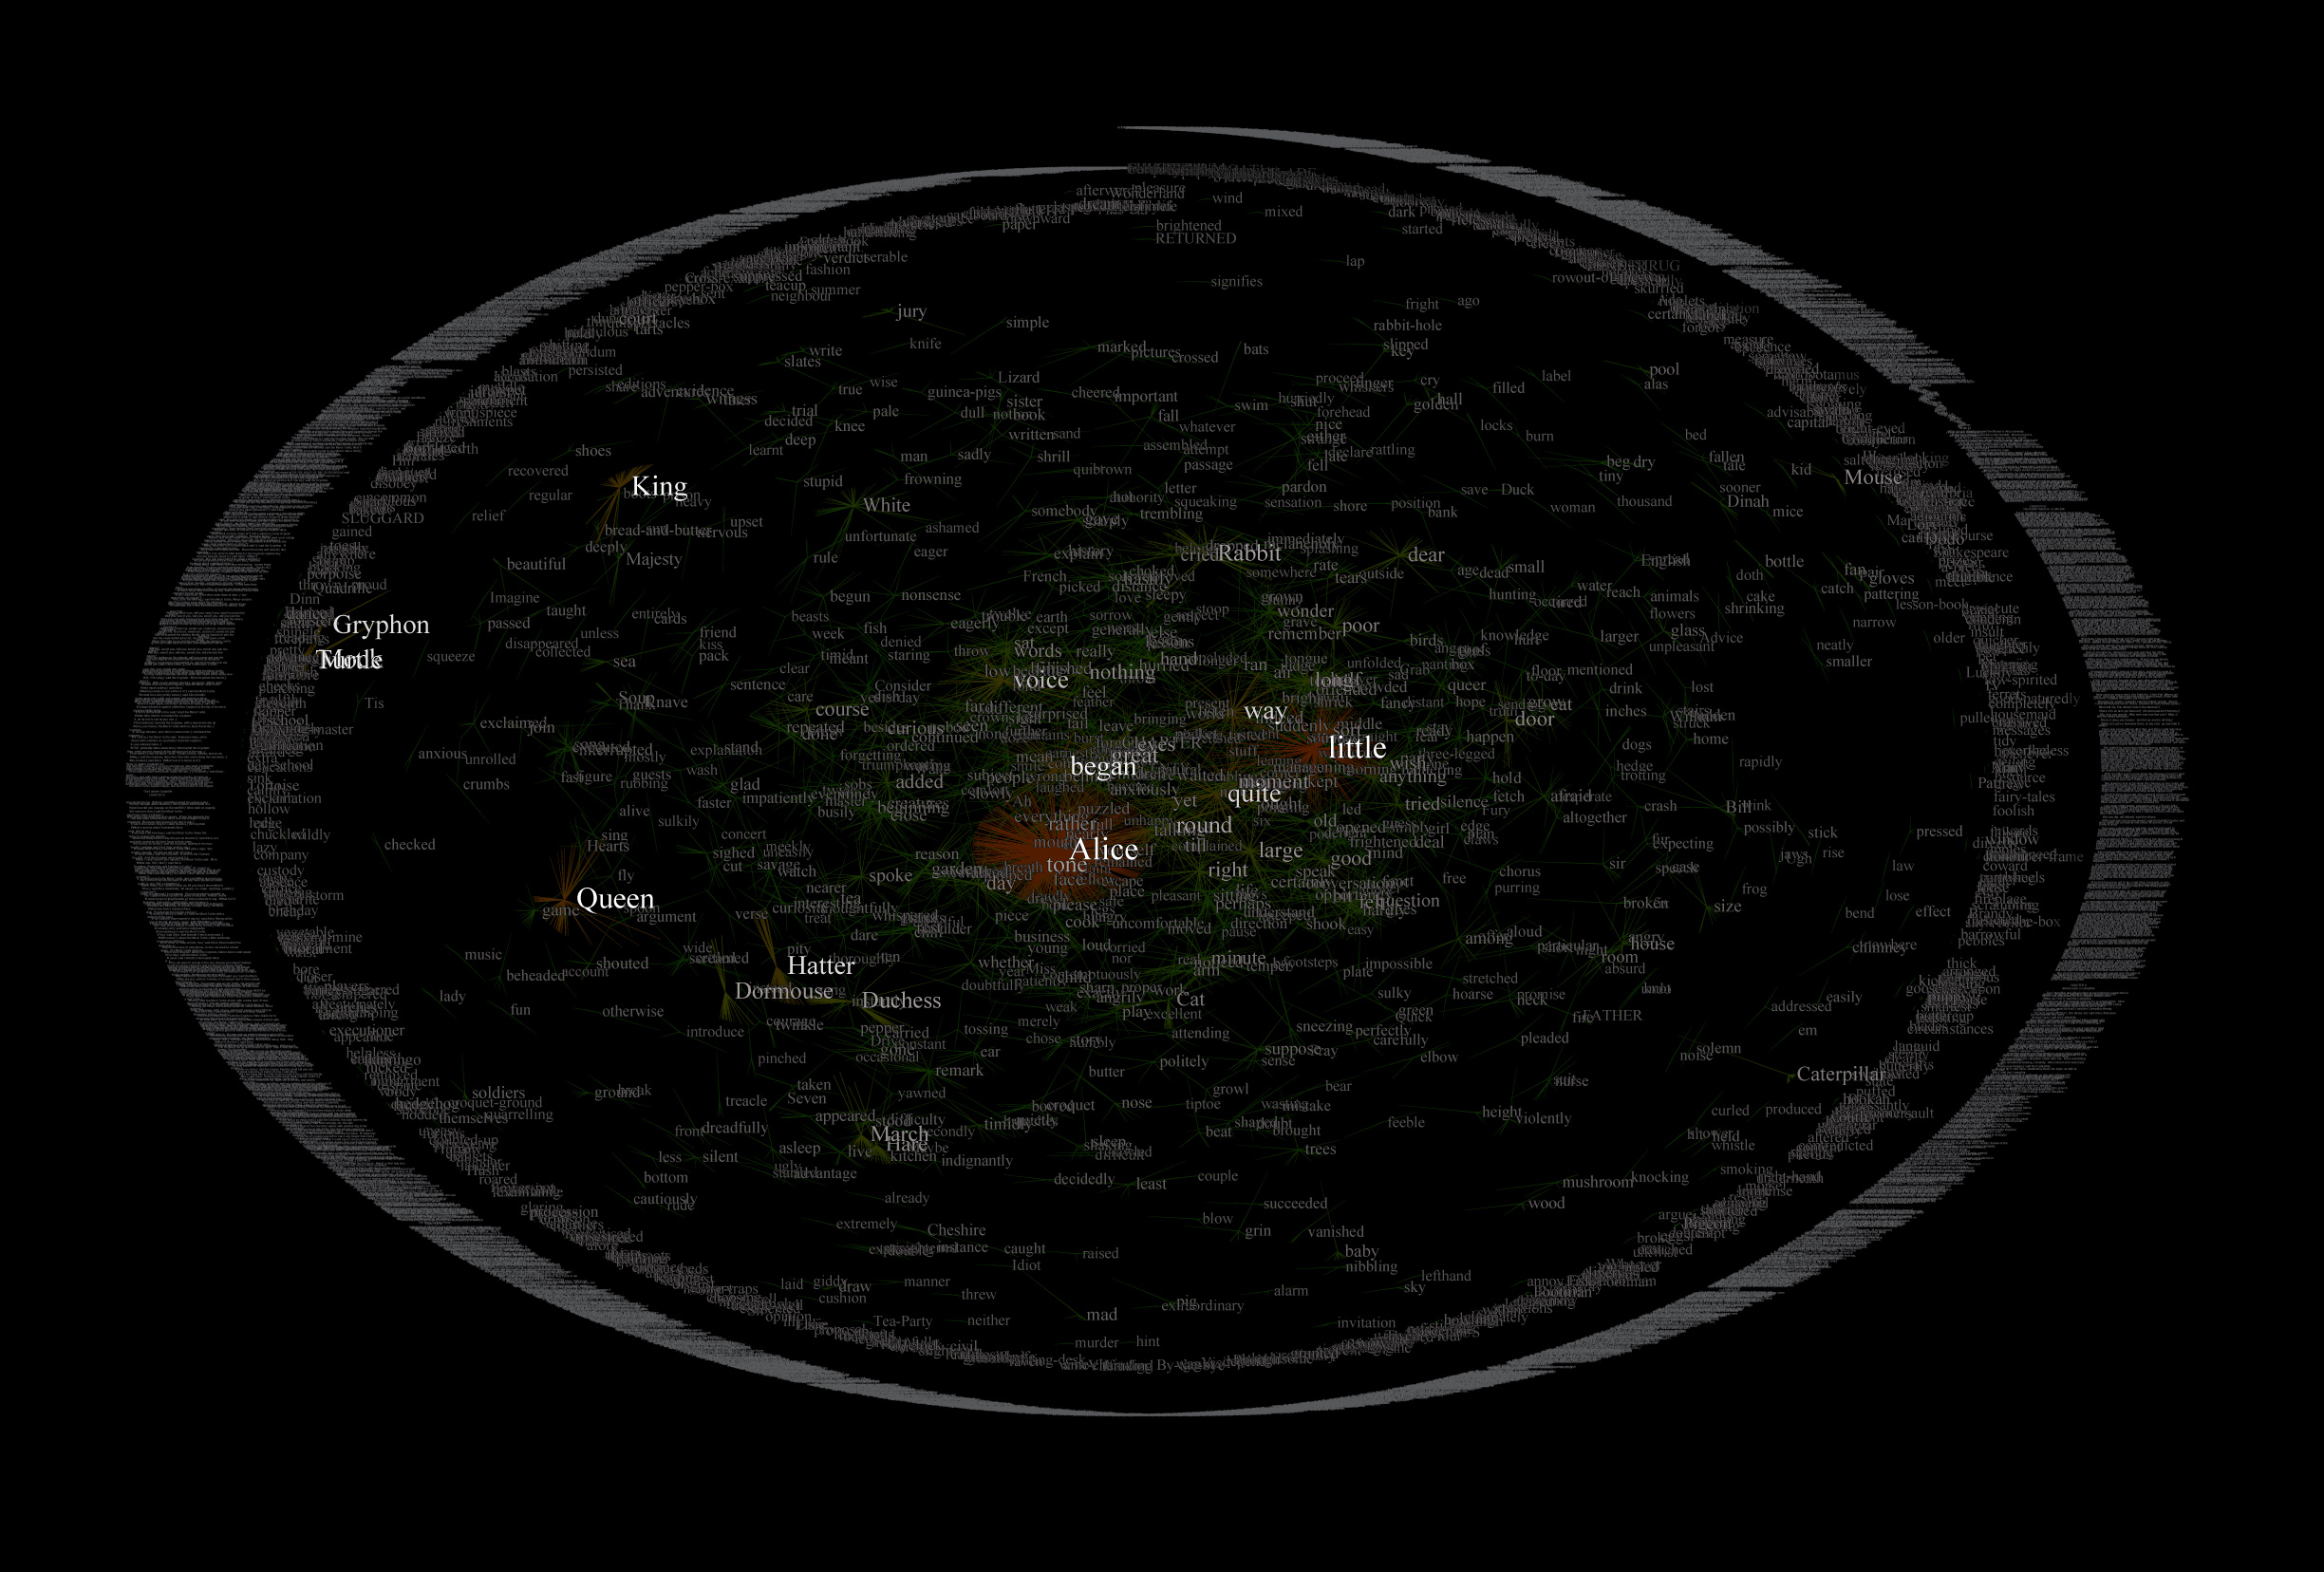
Nouns in English Language
Unknown
NYC Foodiverse
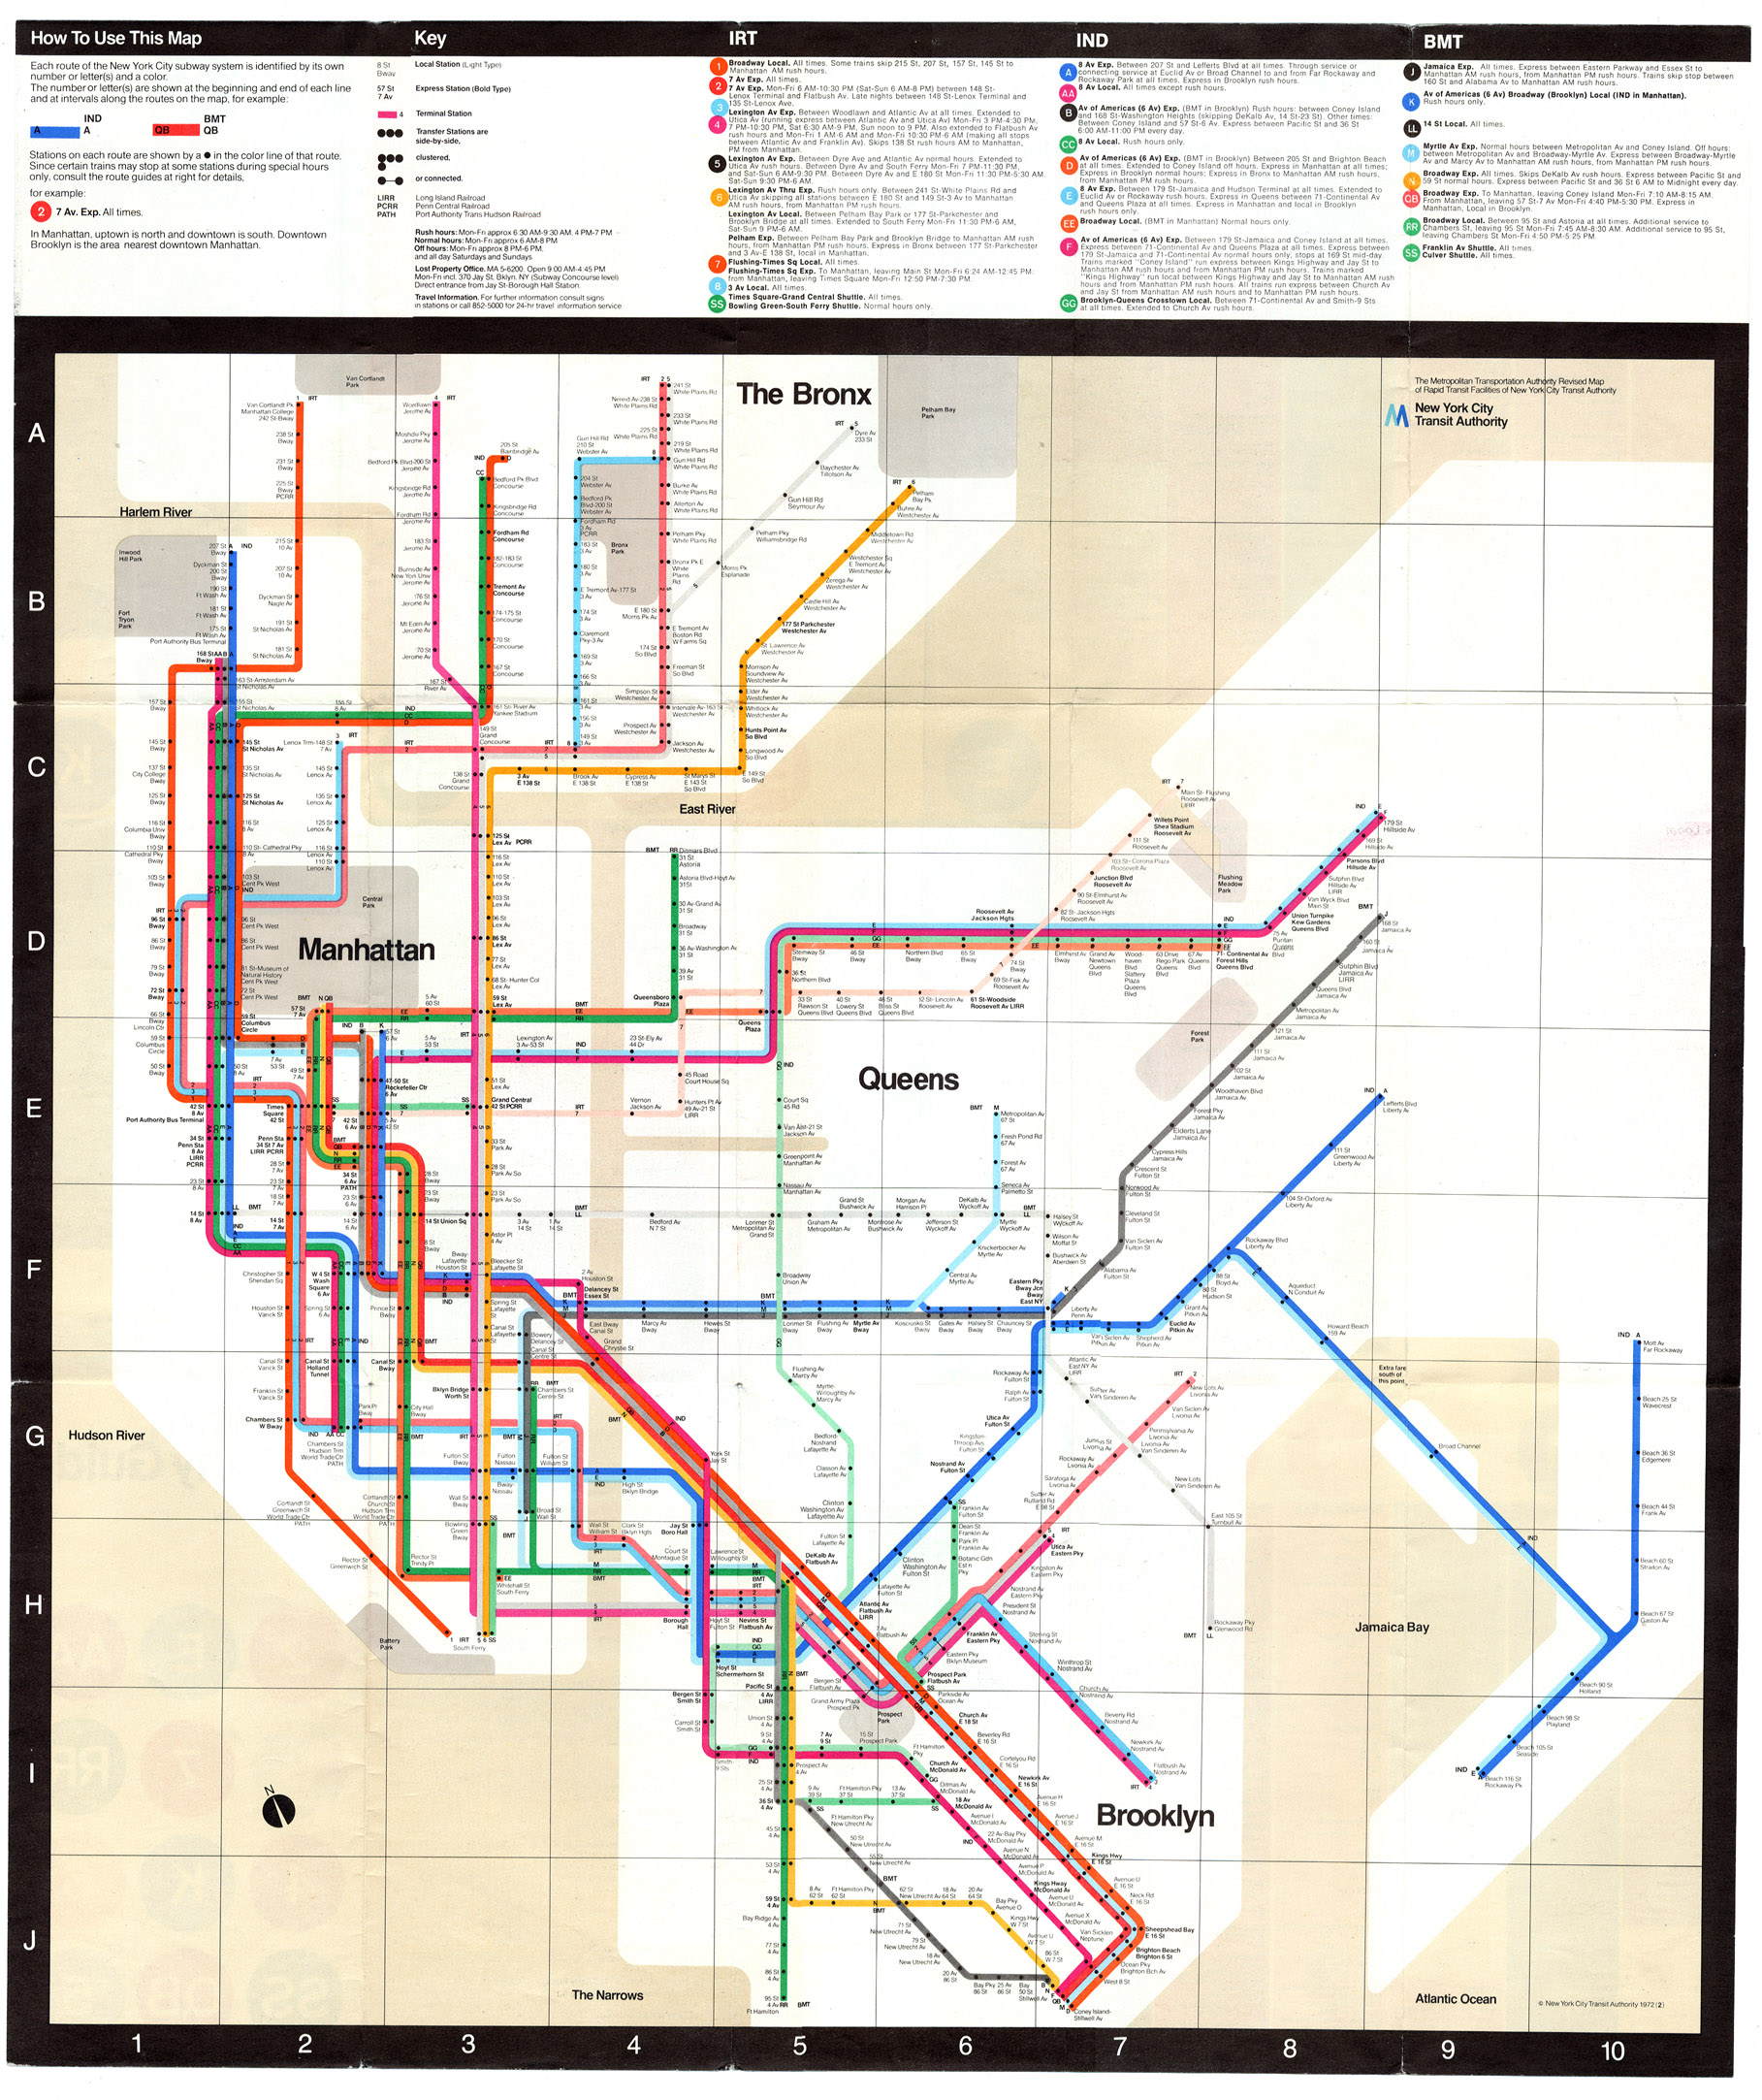
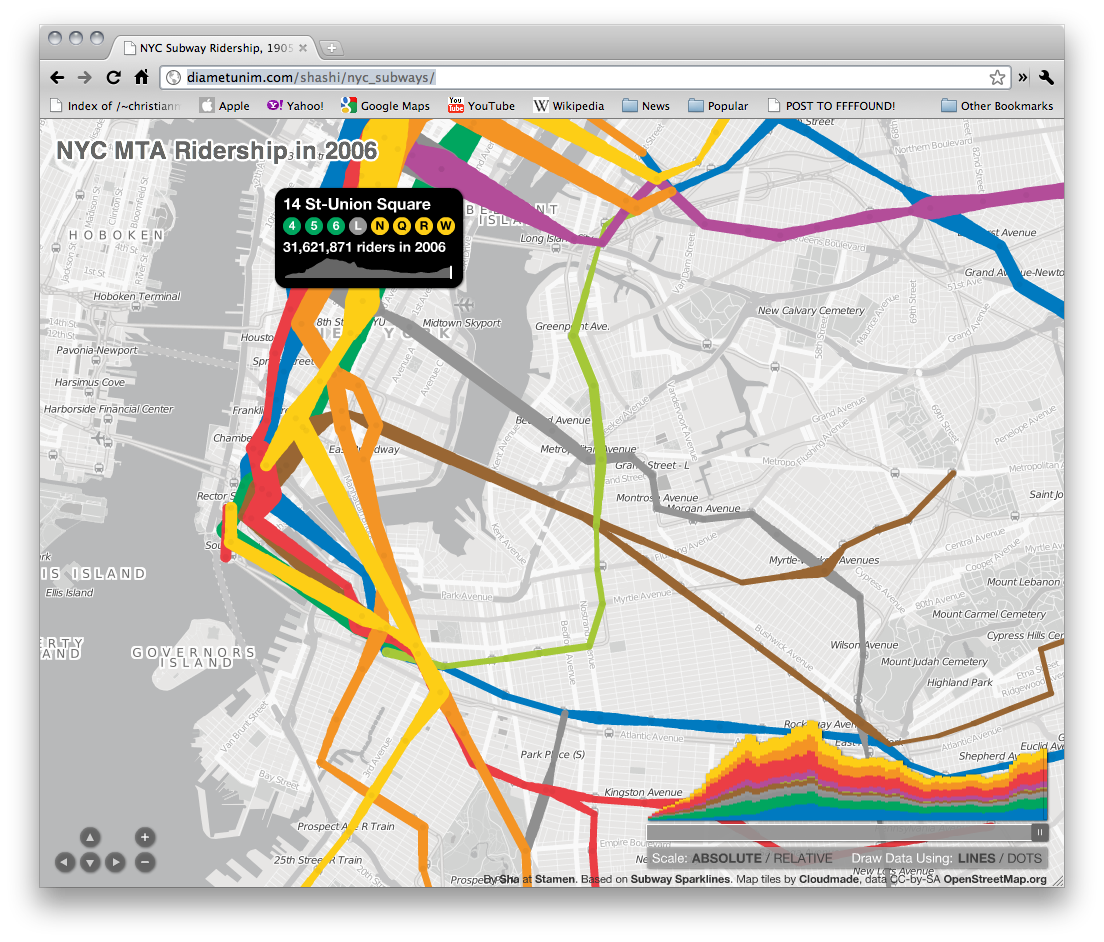
NYC Subway Map
Massimo Vignelli
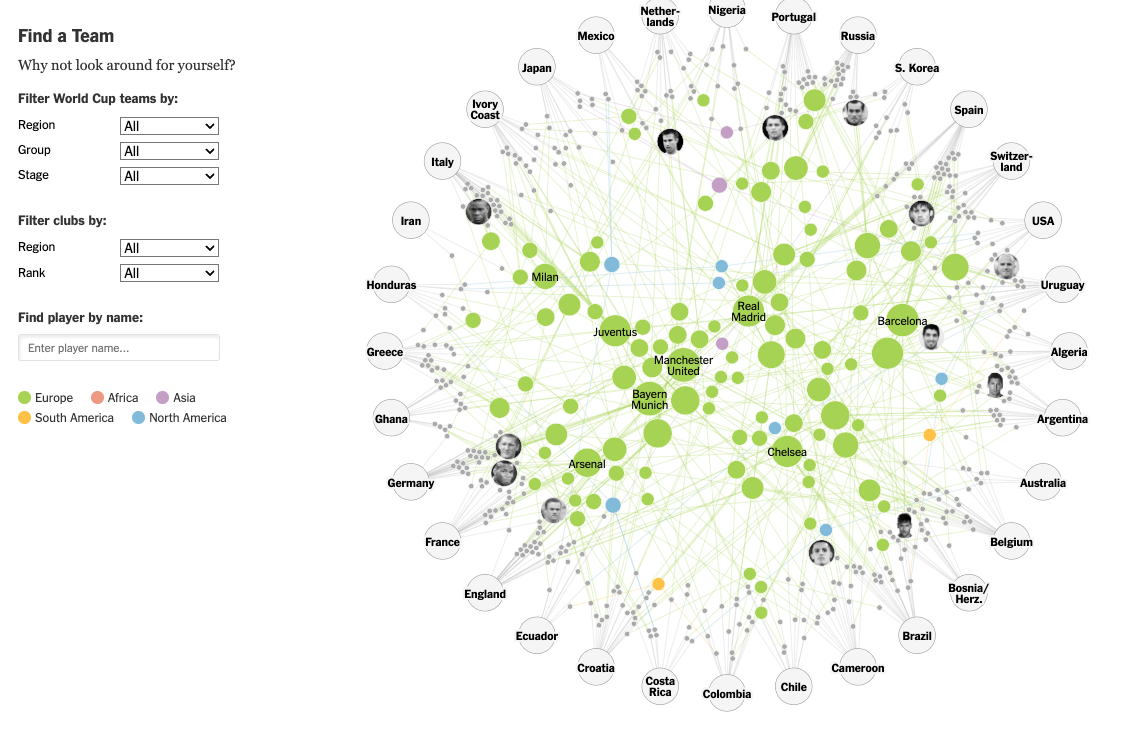
NYT Clubs That Connect the World Cup
The New York Times
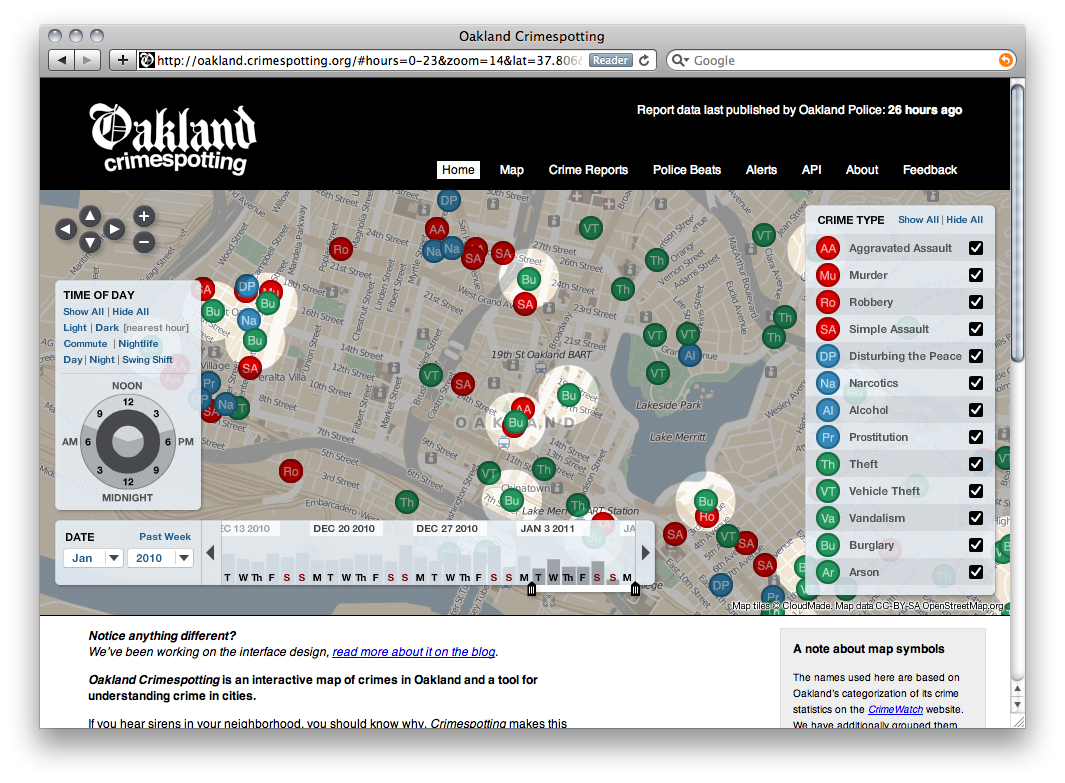
Oakland Crimespotting
Stamen Design
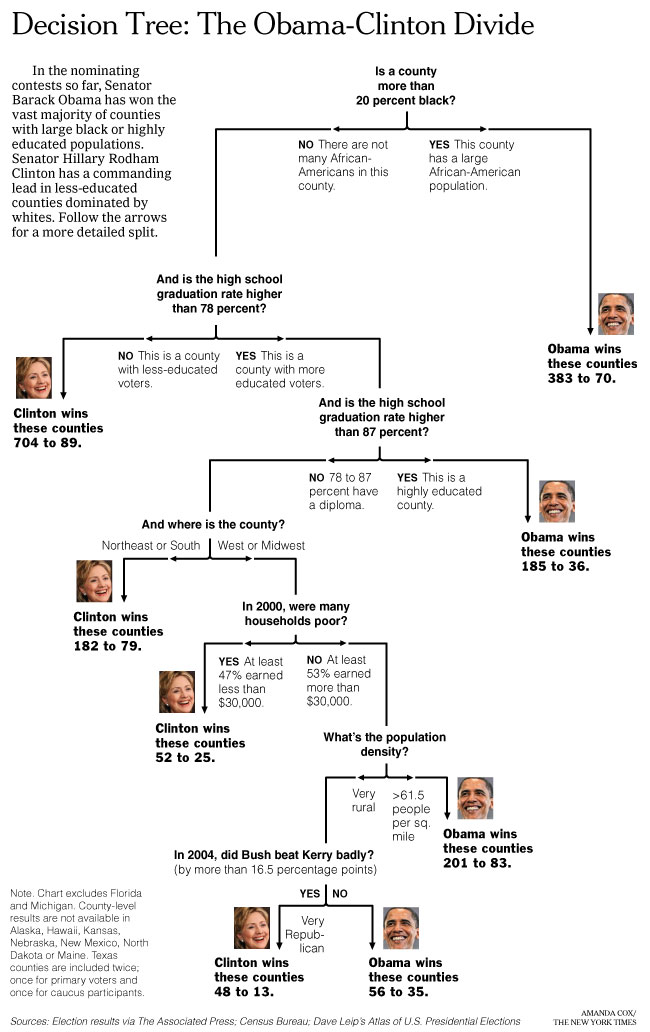
Obama Clinton Decision Tree
New York Times Graphics

Obama Inauguration on Twitter
Nathan Yau / Flowing Data
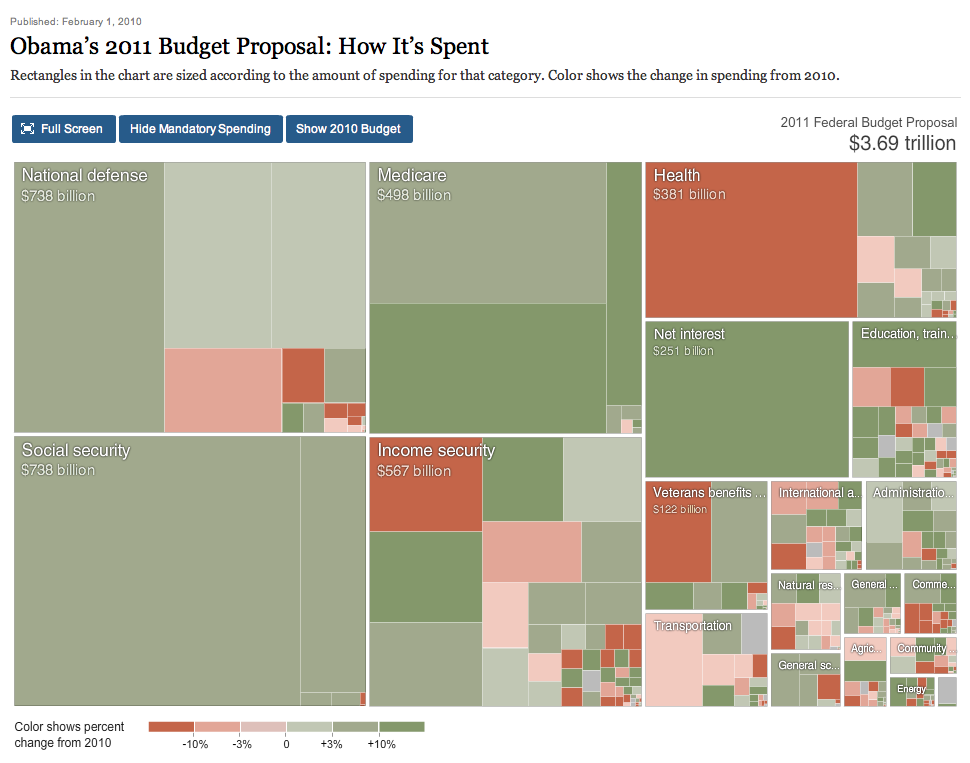
Obama's Budget Proposal
New York Times Graphics
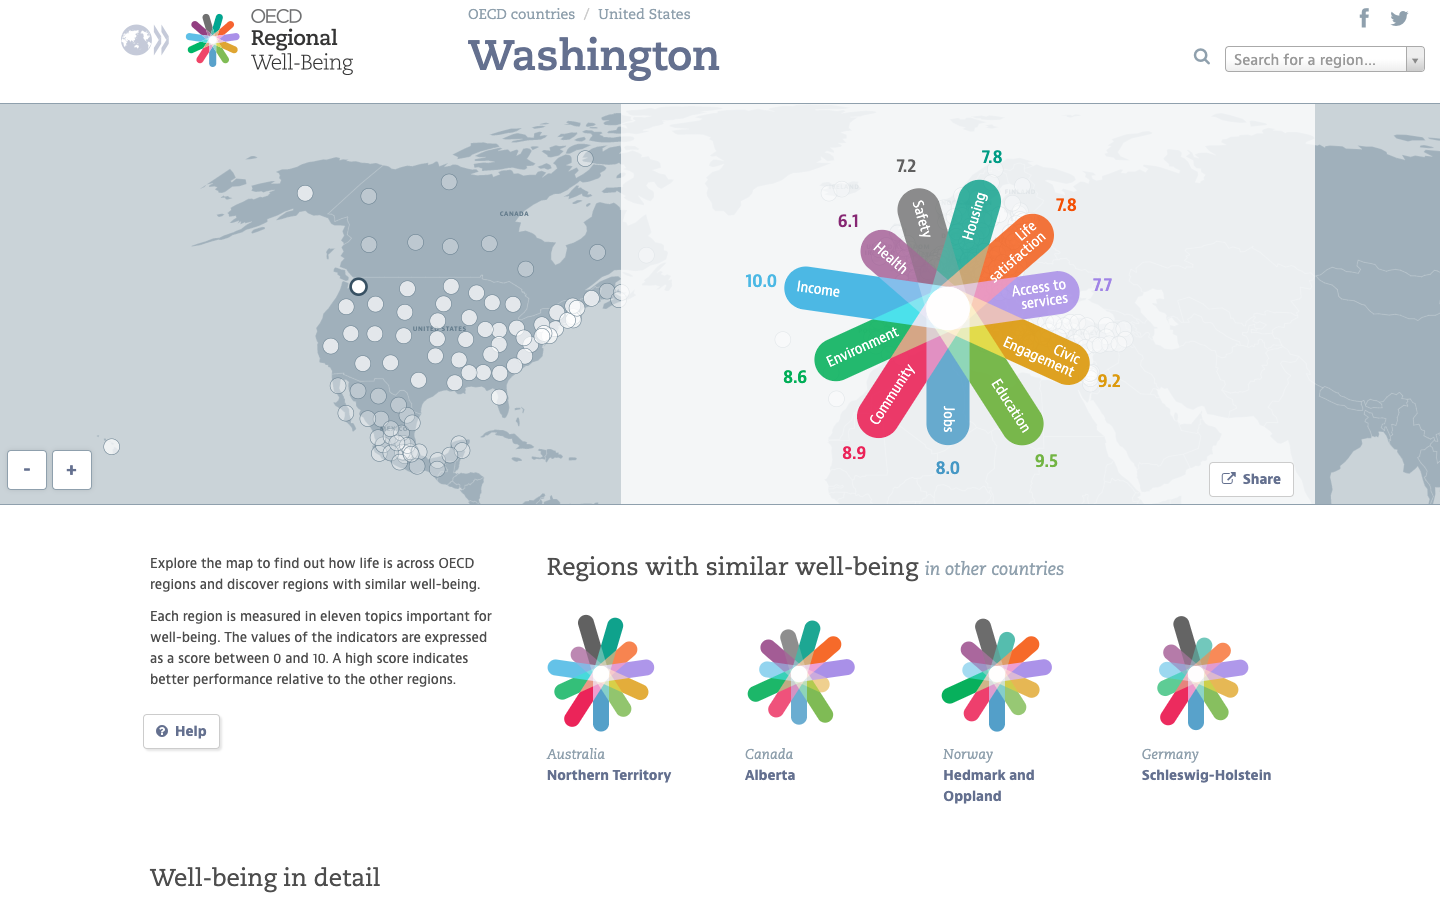
OECD Regional Well-being
OECD Regional Statistics
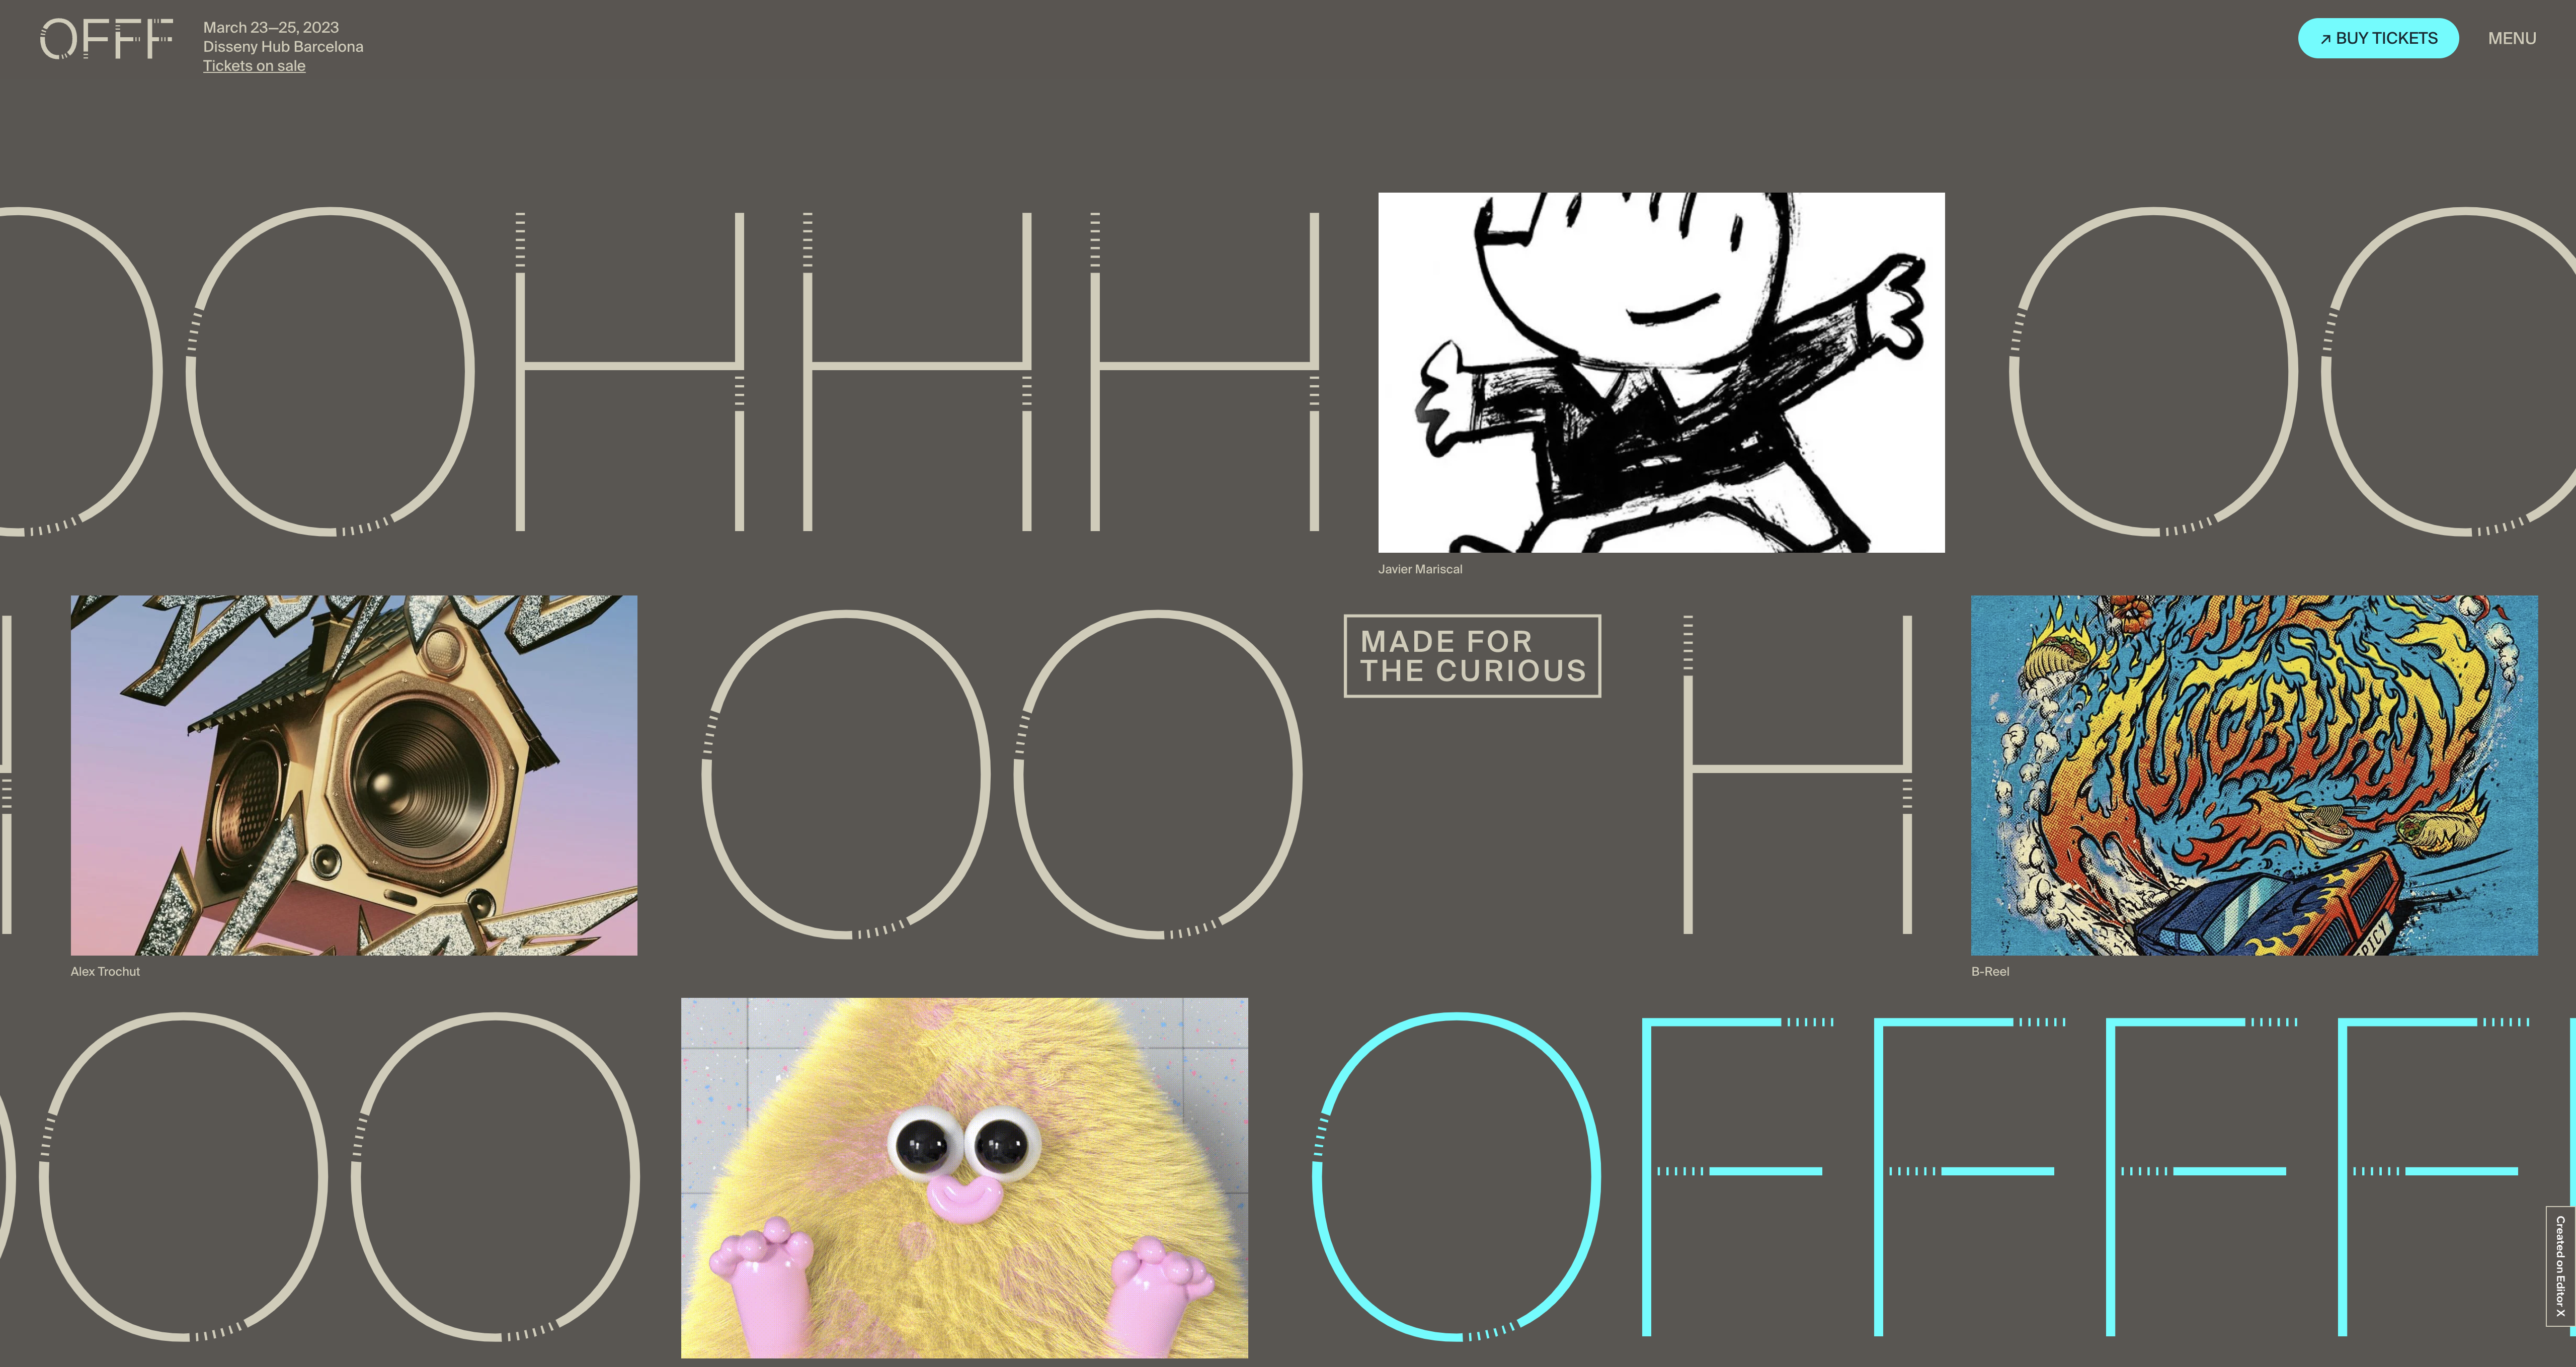
OFFF Barcelona
Omix and Pellucid Design Explorations
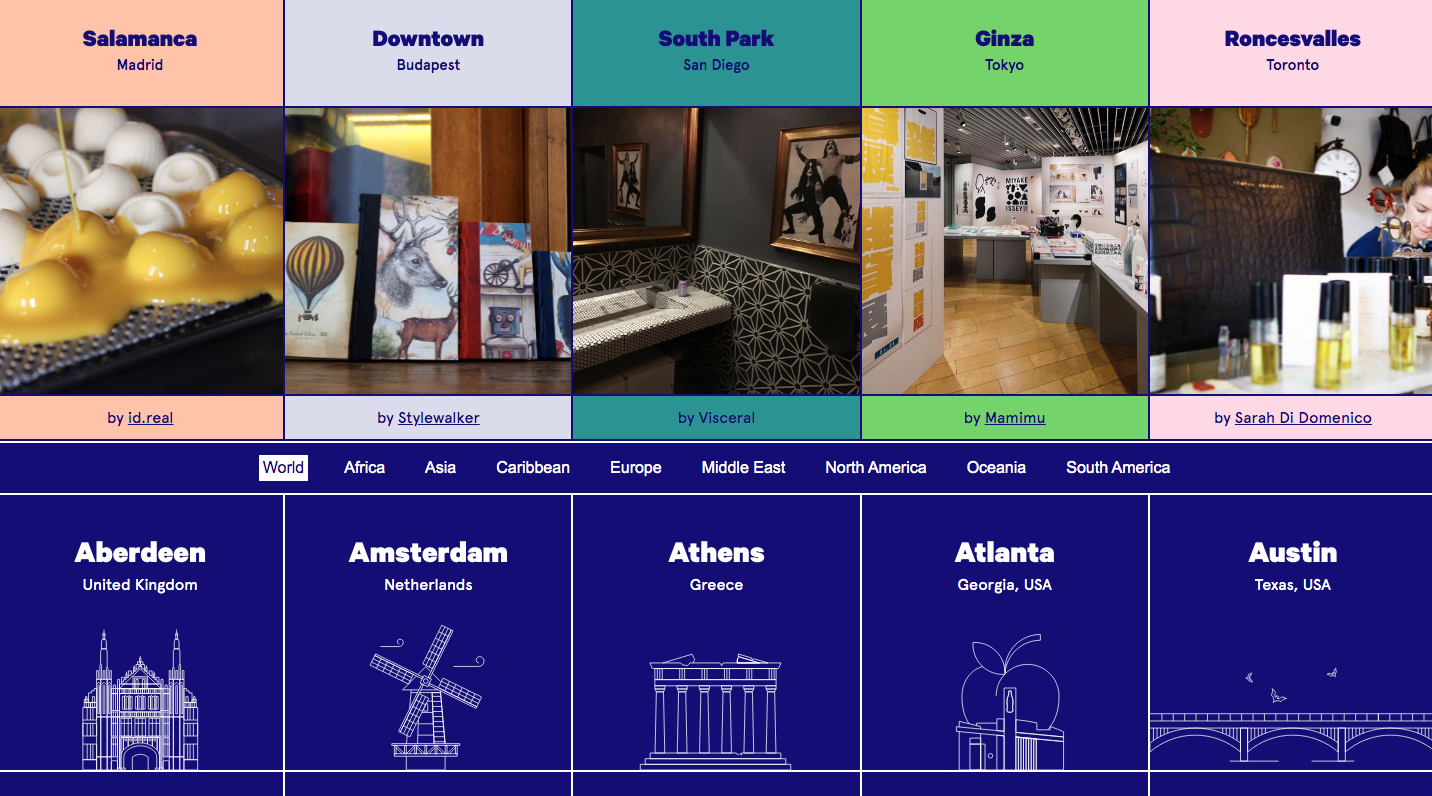
On the Grid
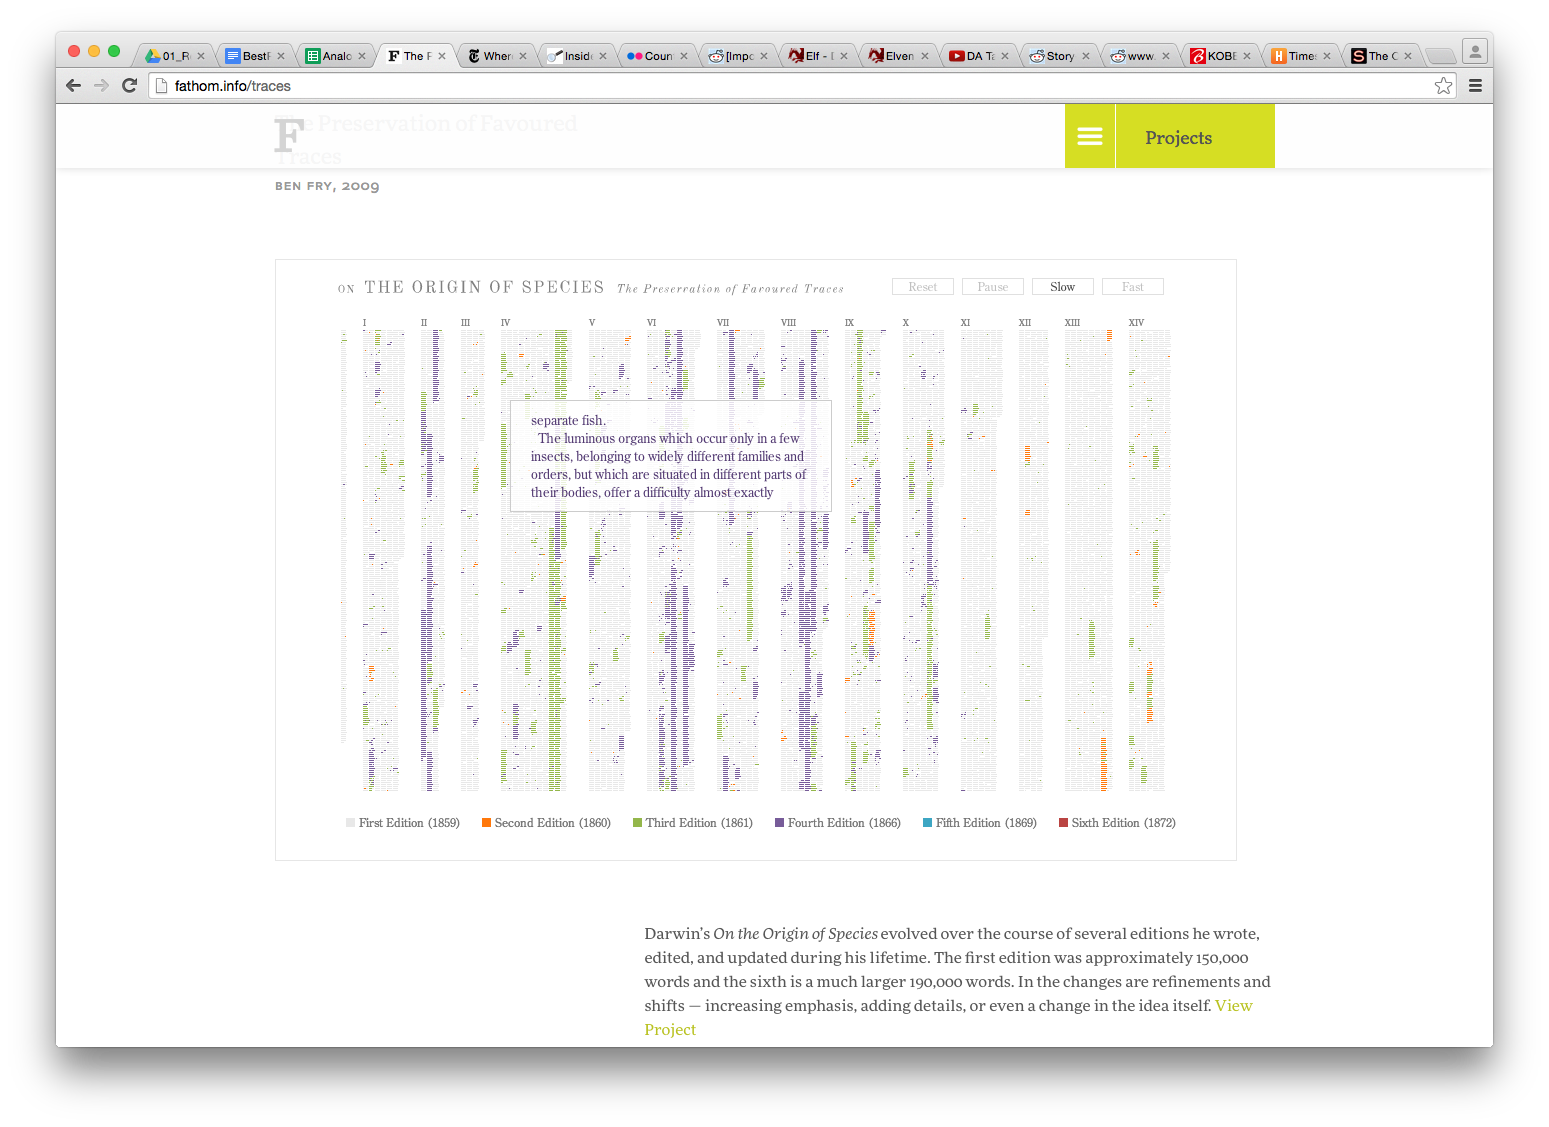
On the Origin of Species
Fathom Information Design
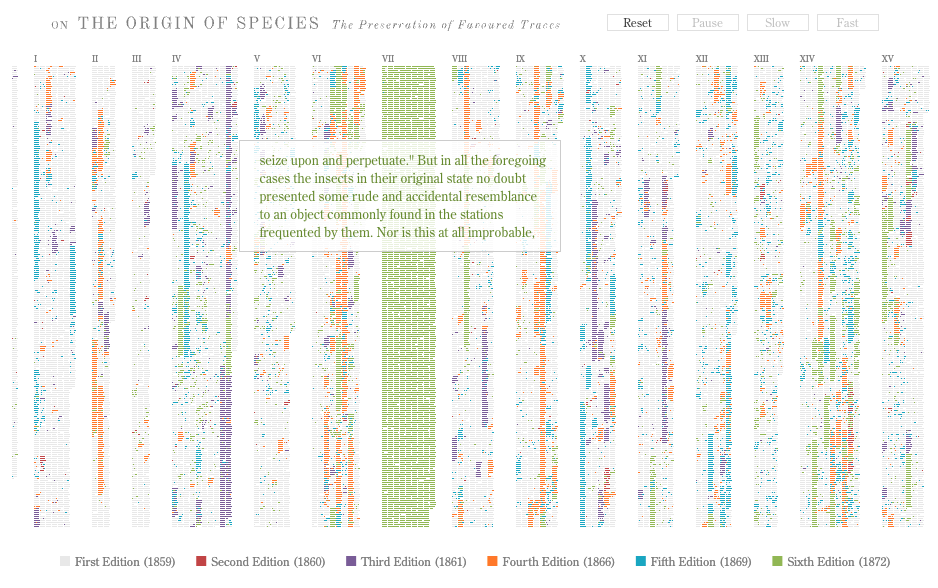
On the Origin of Species: the Preservation of Favoured Traces
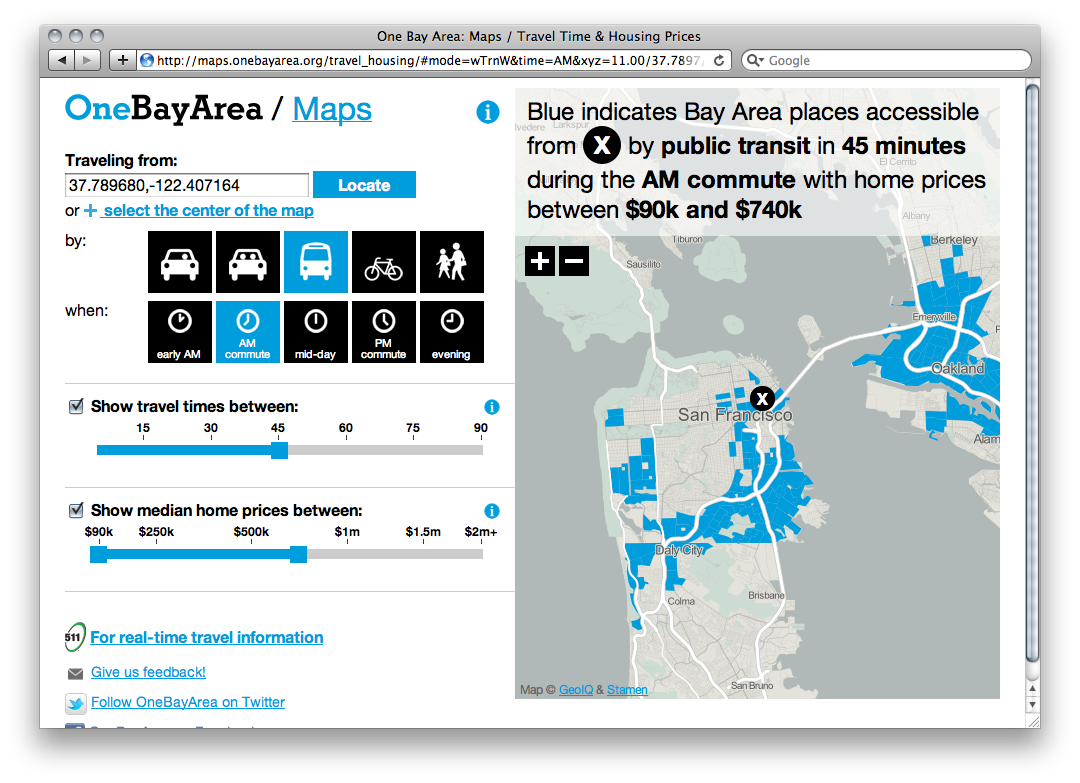
One Bay Area
Stamen Design
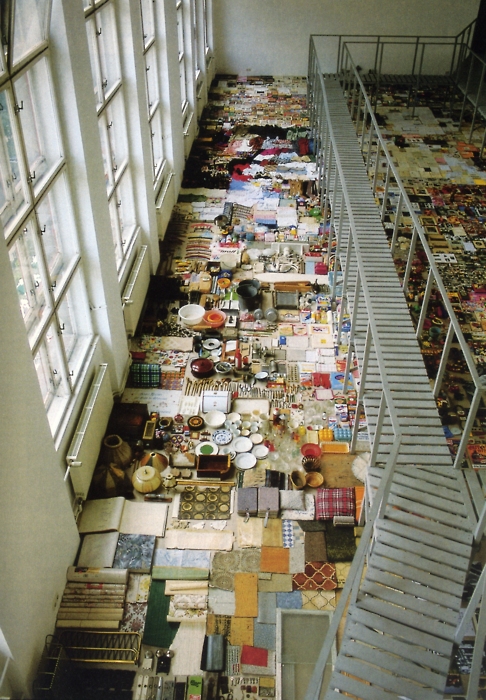
One of Each
Karsten Bott
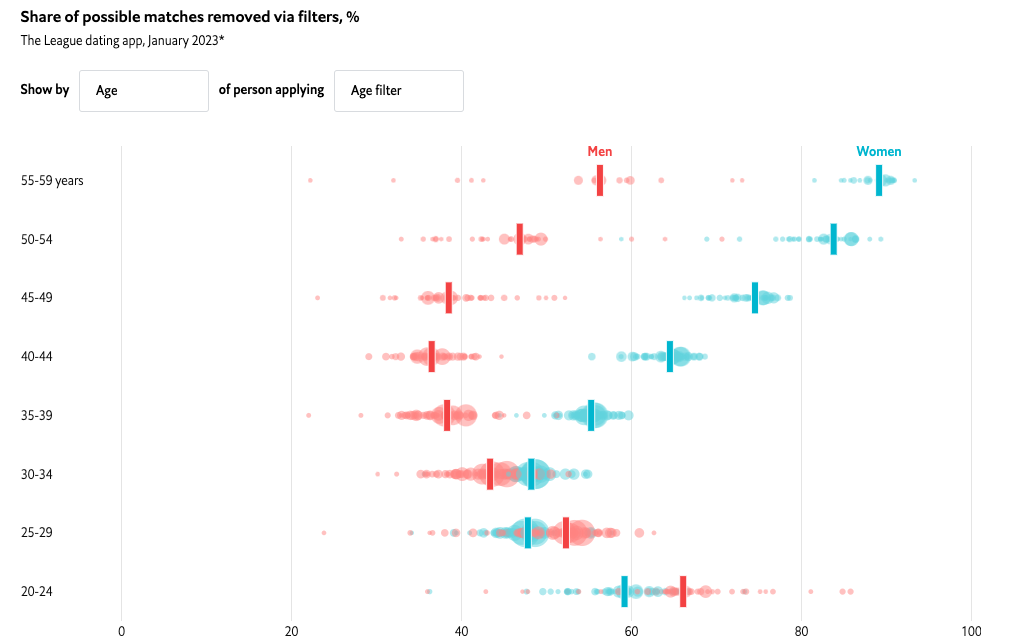
Online Daters Are Less Open-minded Than Their Filters Suggest
Economist
Openhouse
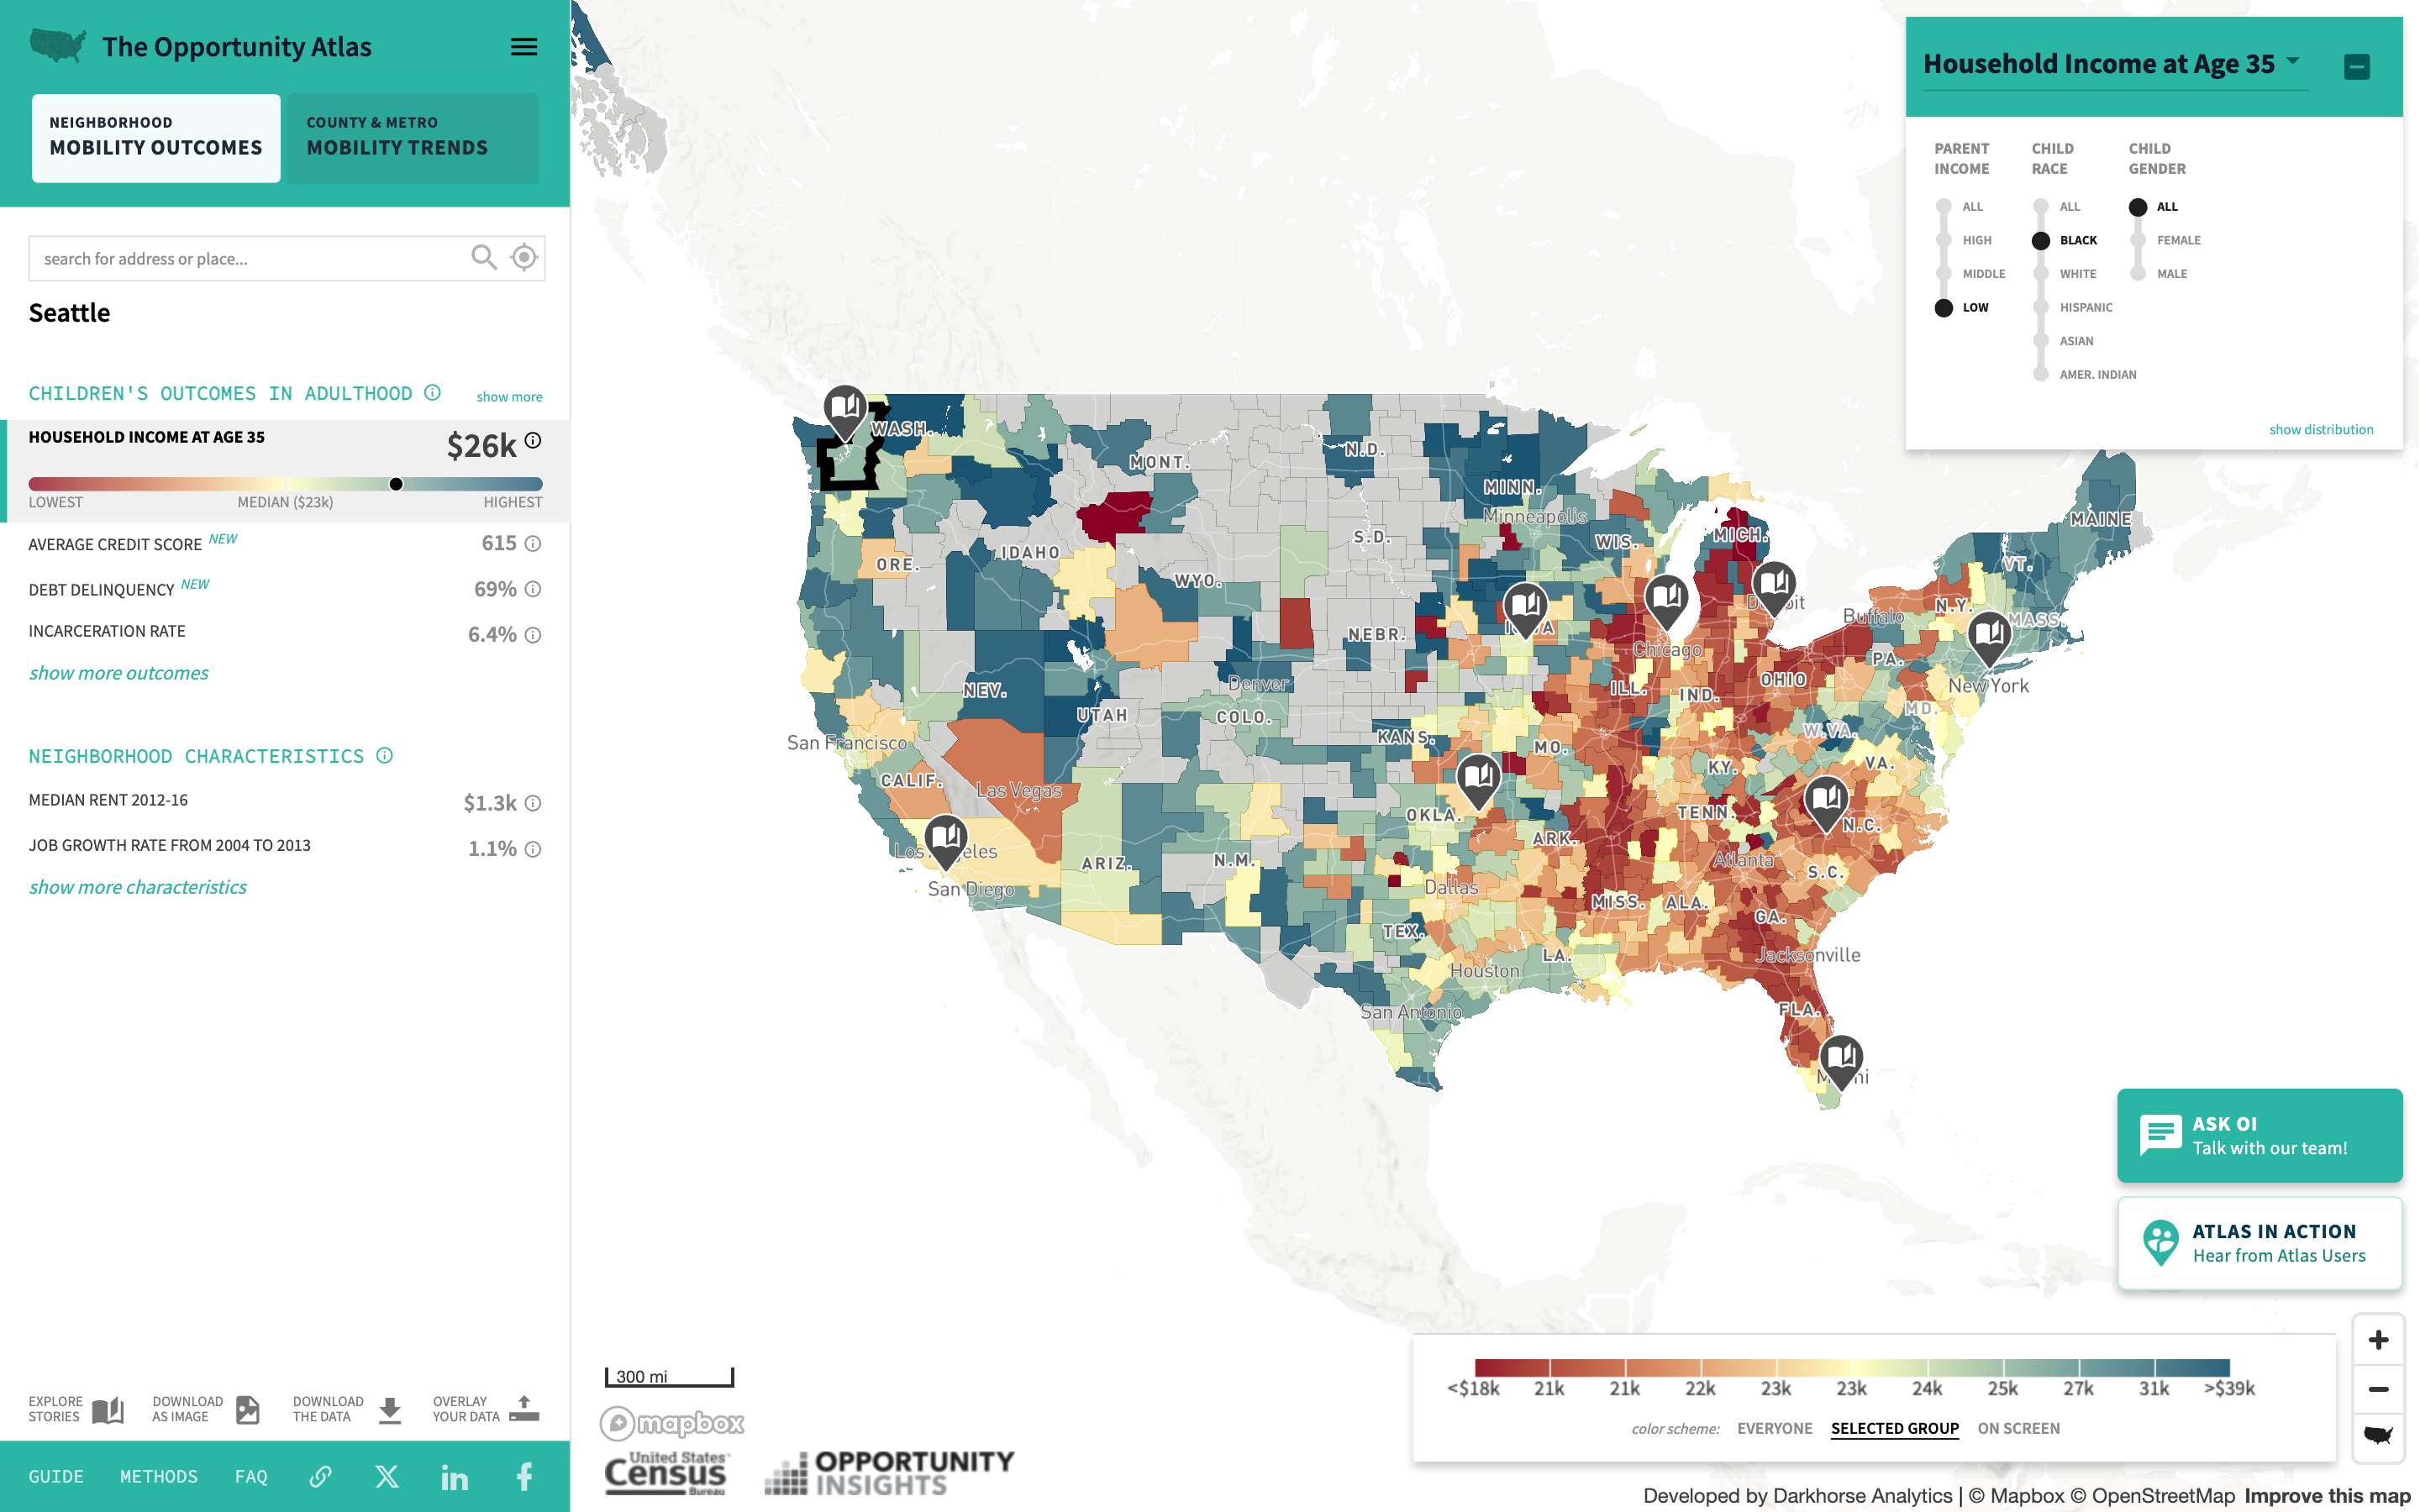
Opportunity Atlas
Opportunity Insights (Harvard University)
Ork Posters
Jenny Beorkrem
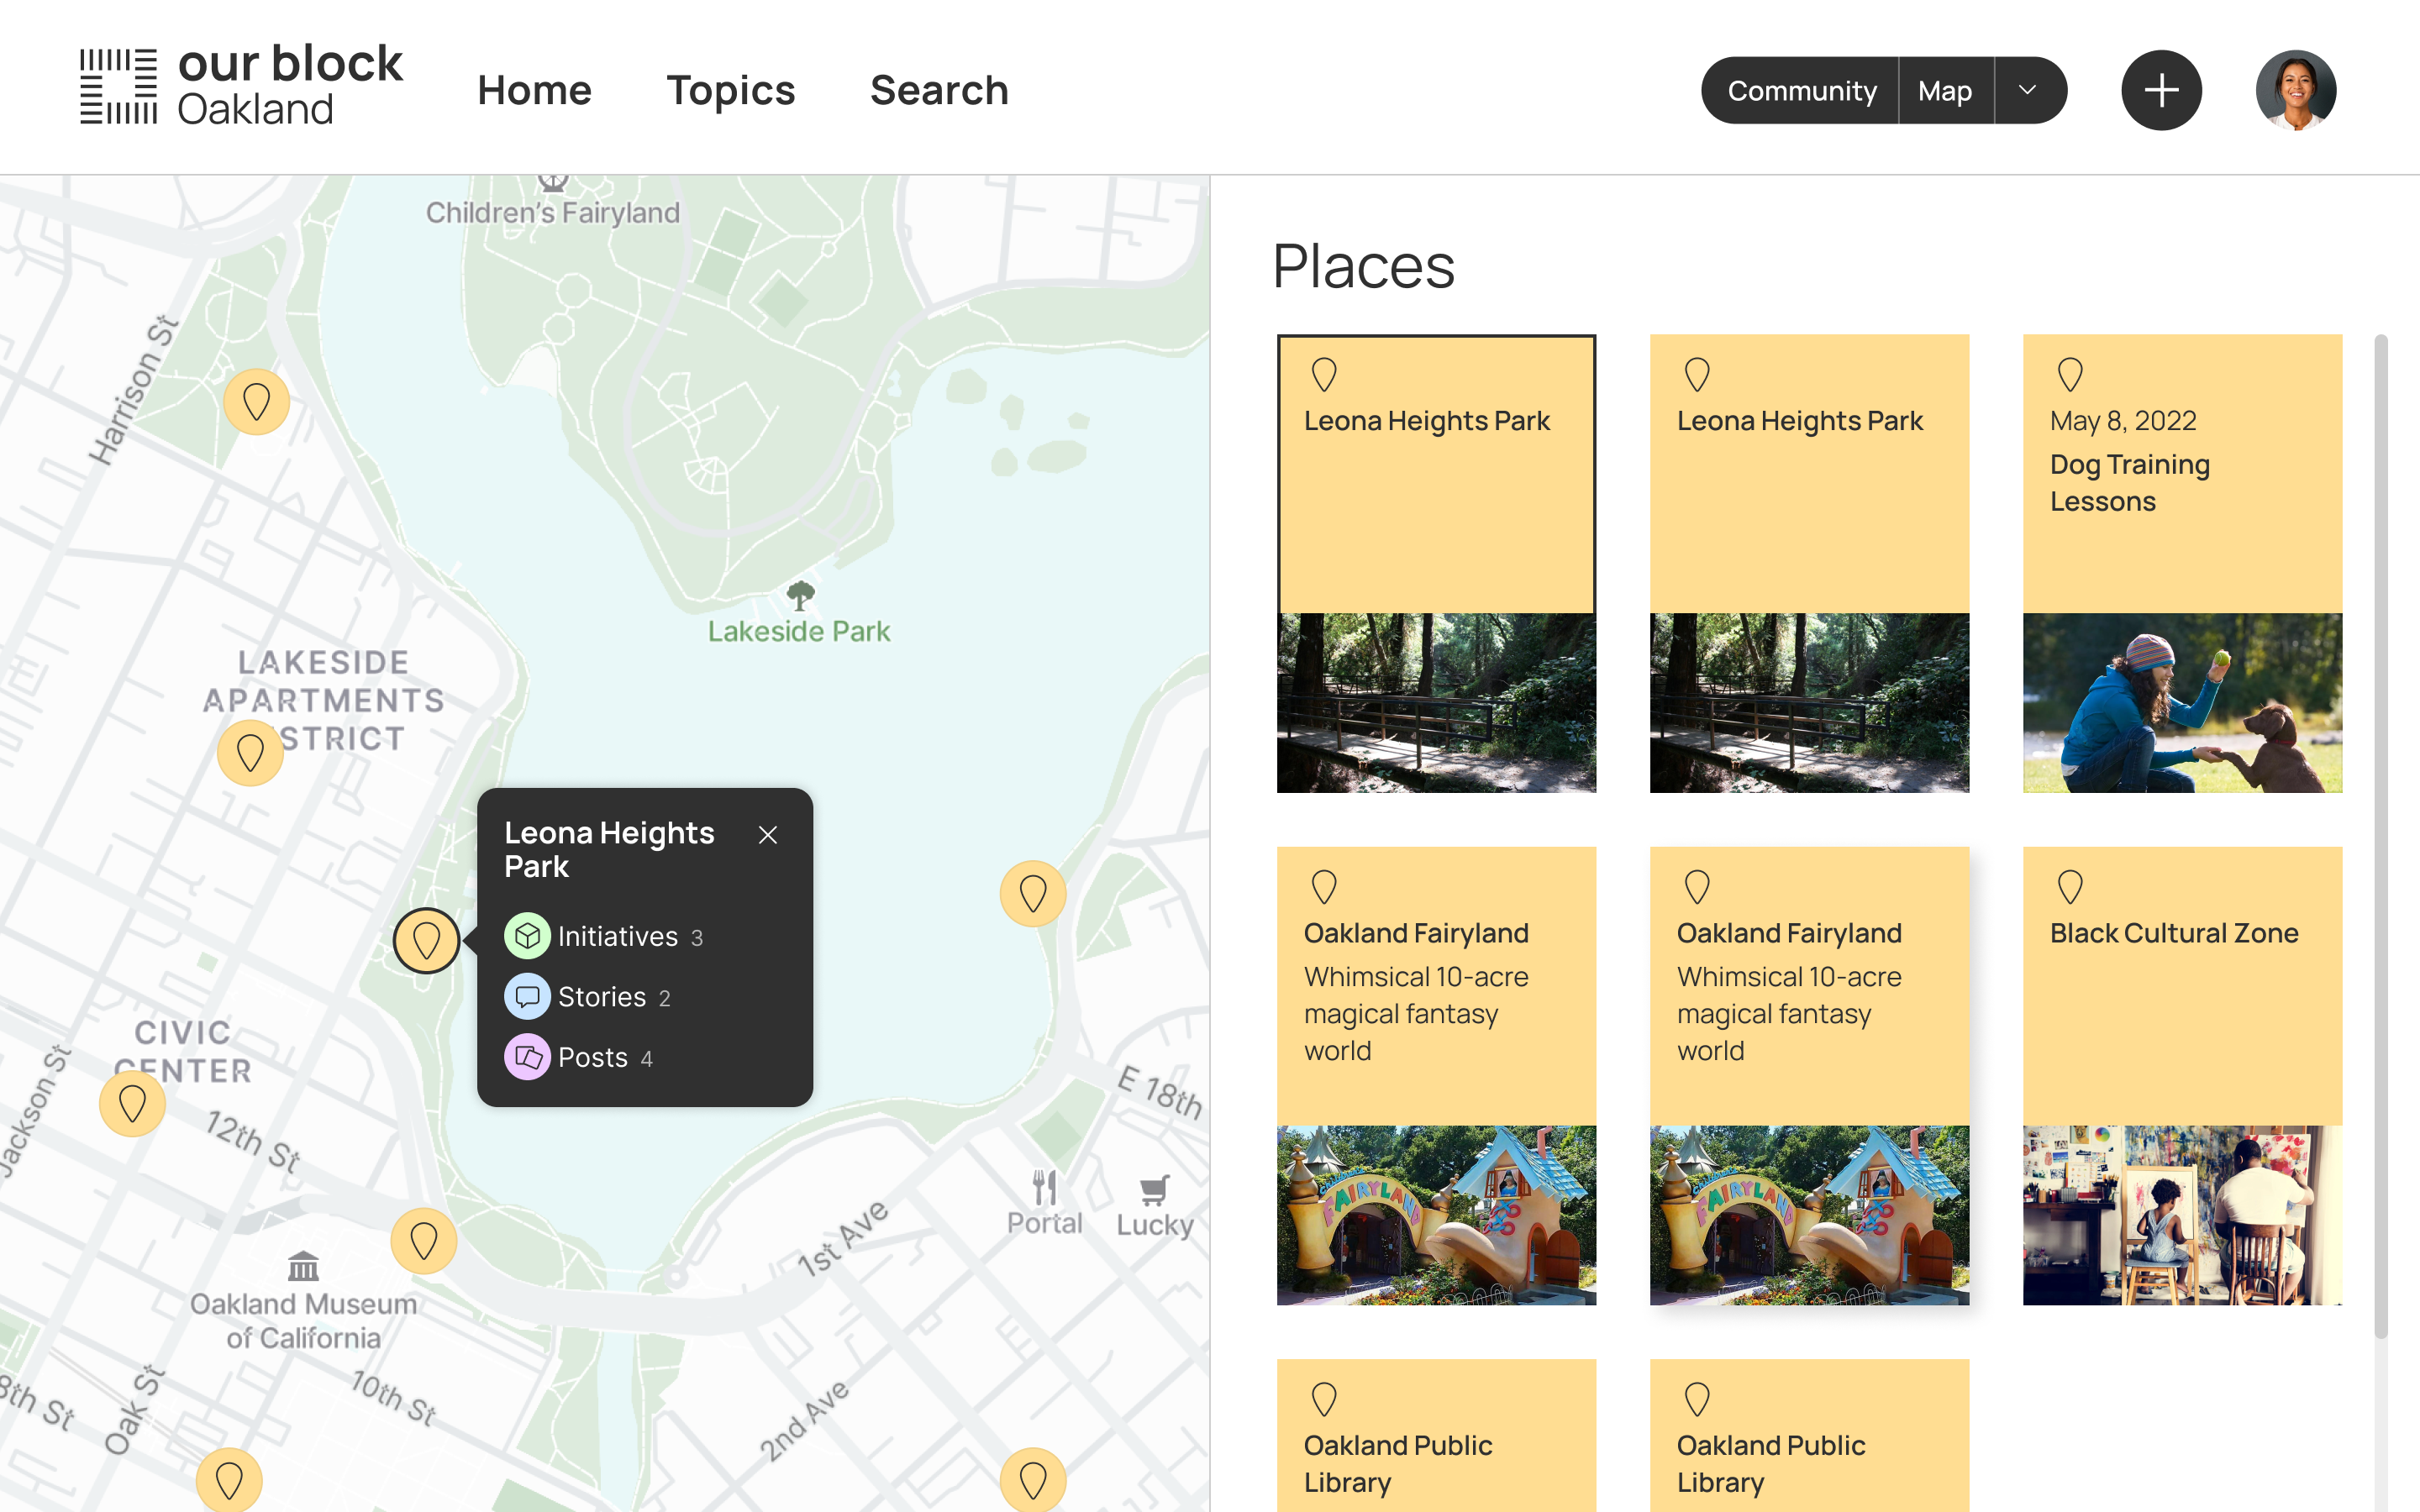
Our Block
Overcast
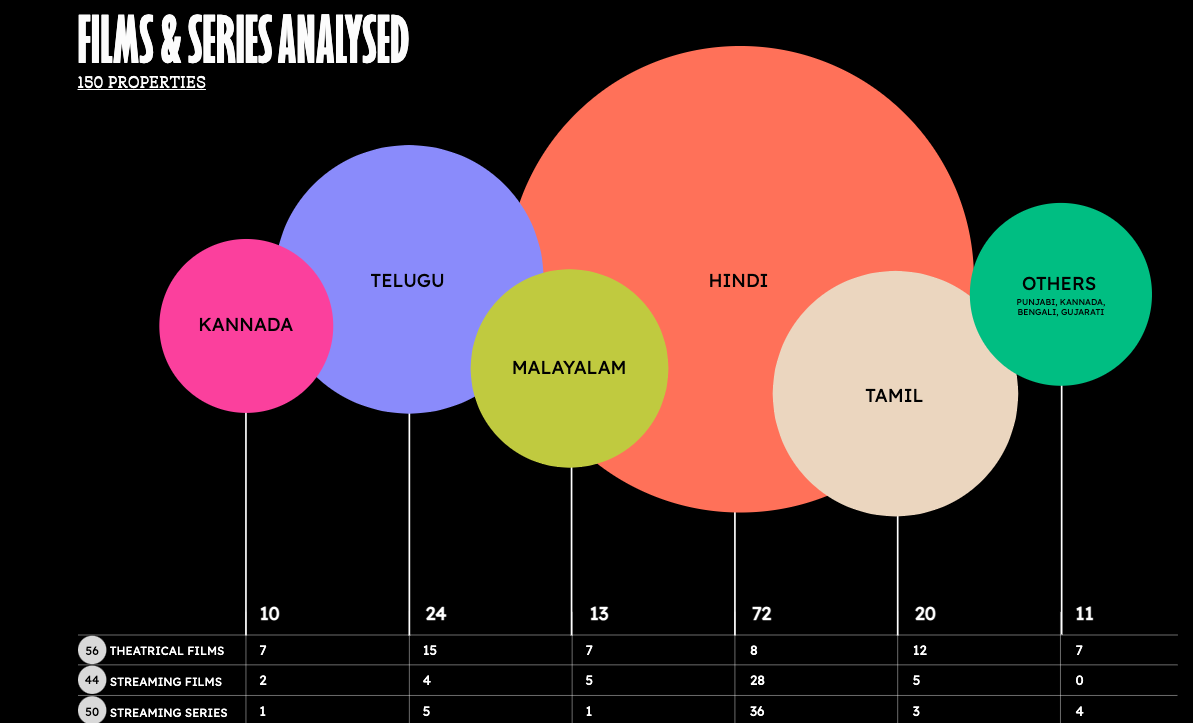
Owomaniya! 2022
Pace Consortium
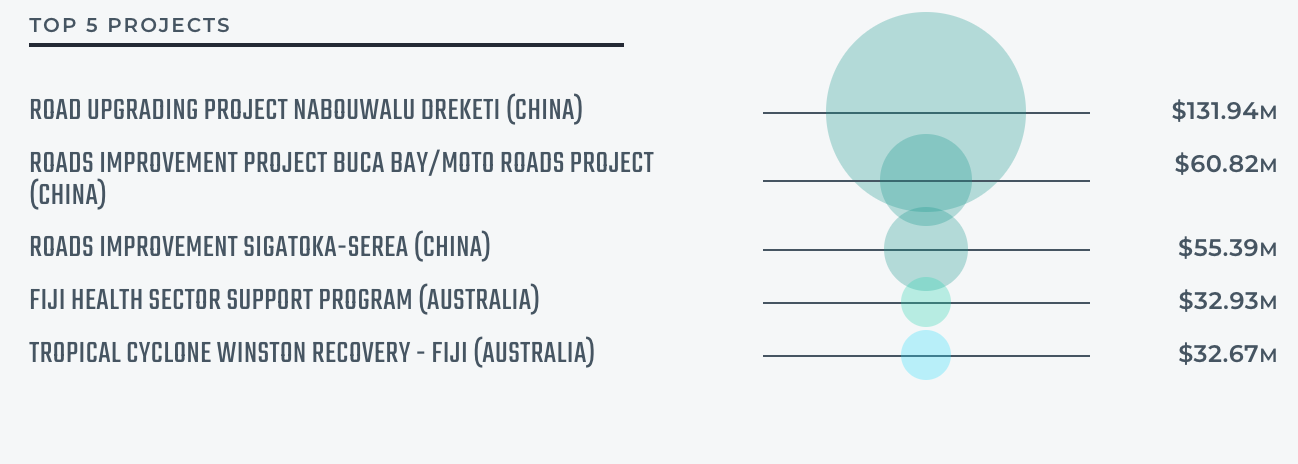
Pacific Aid Map
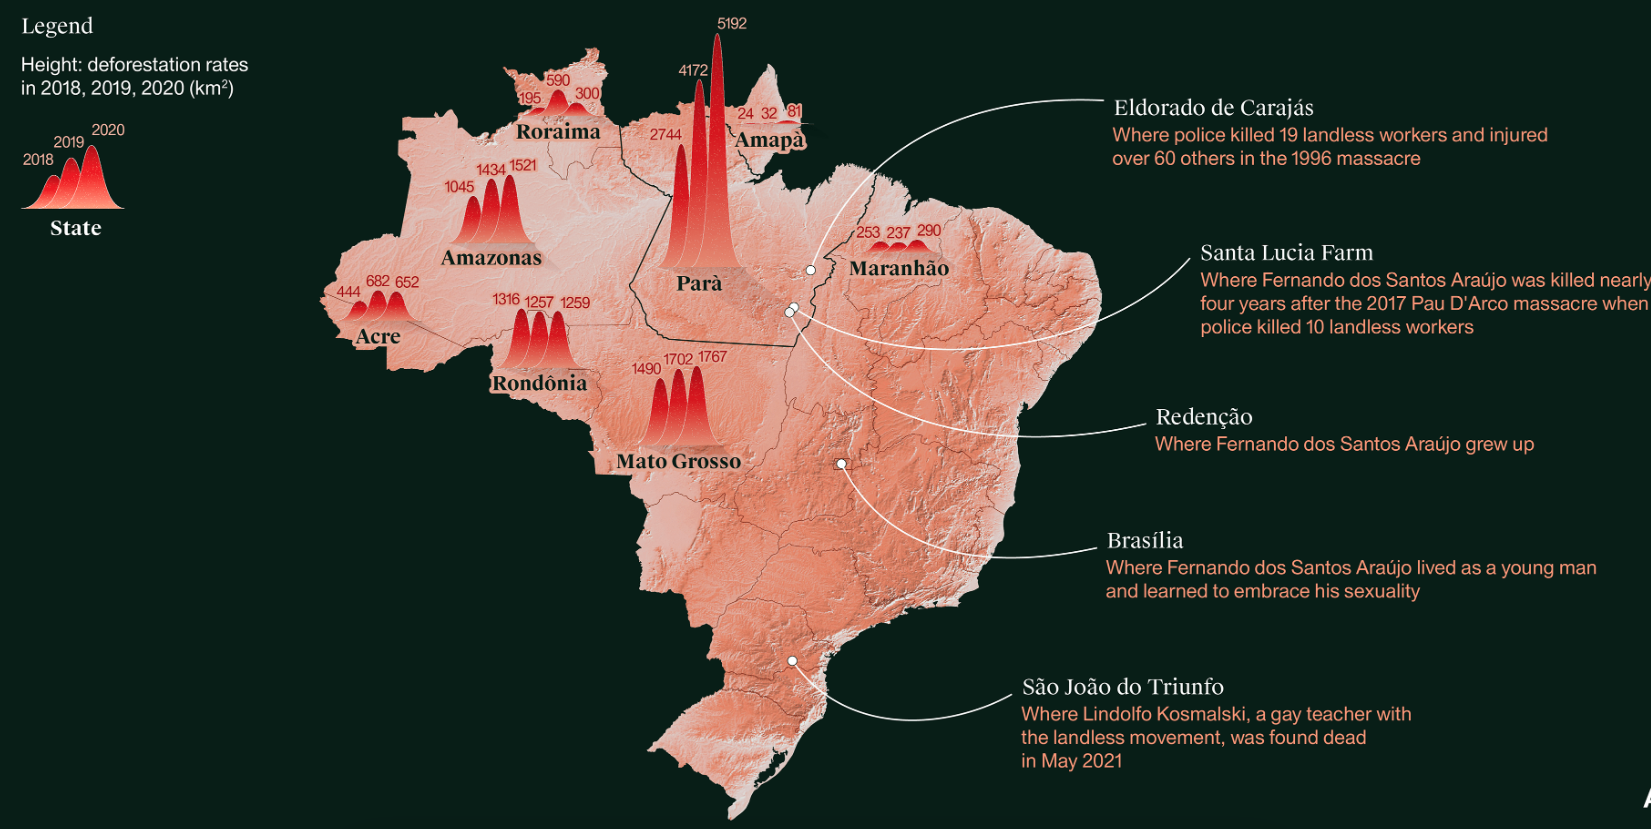
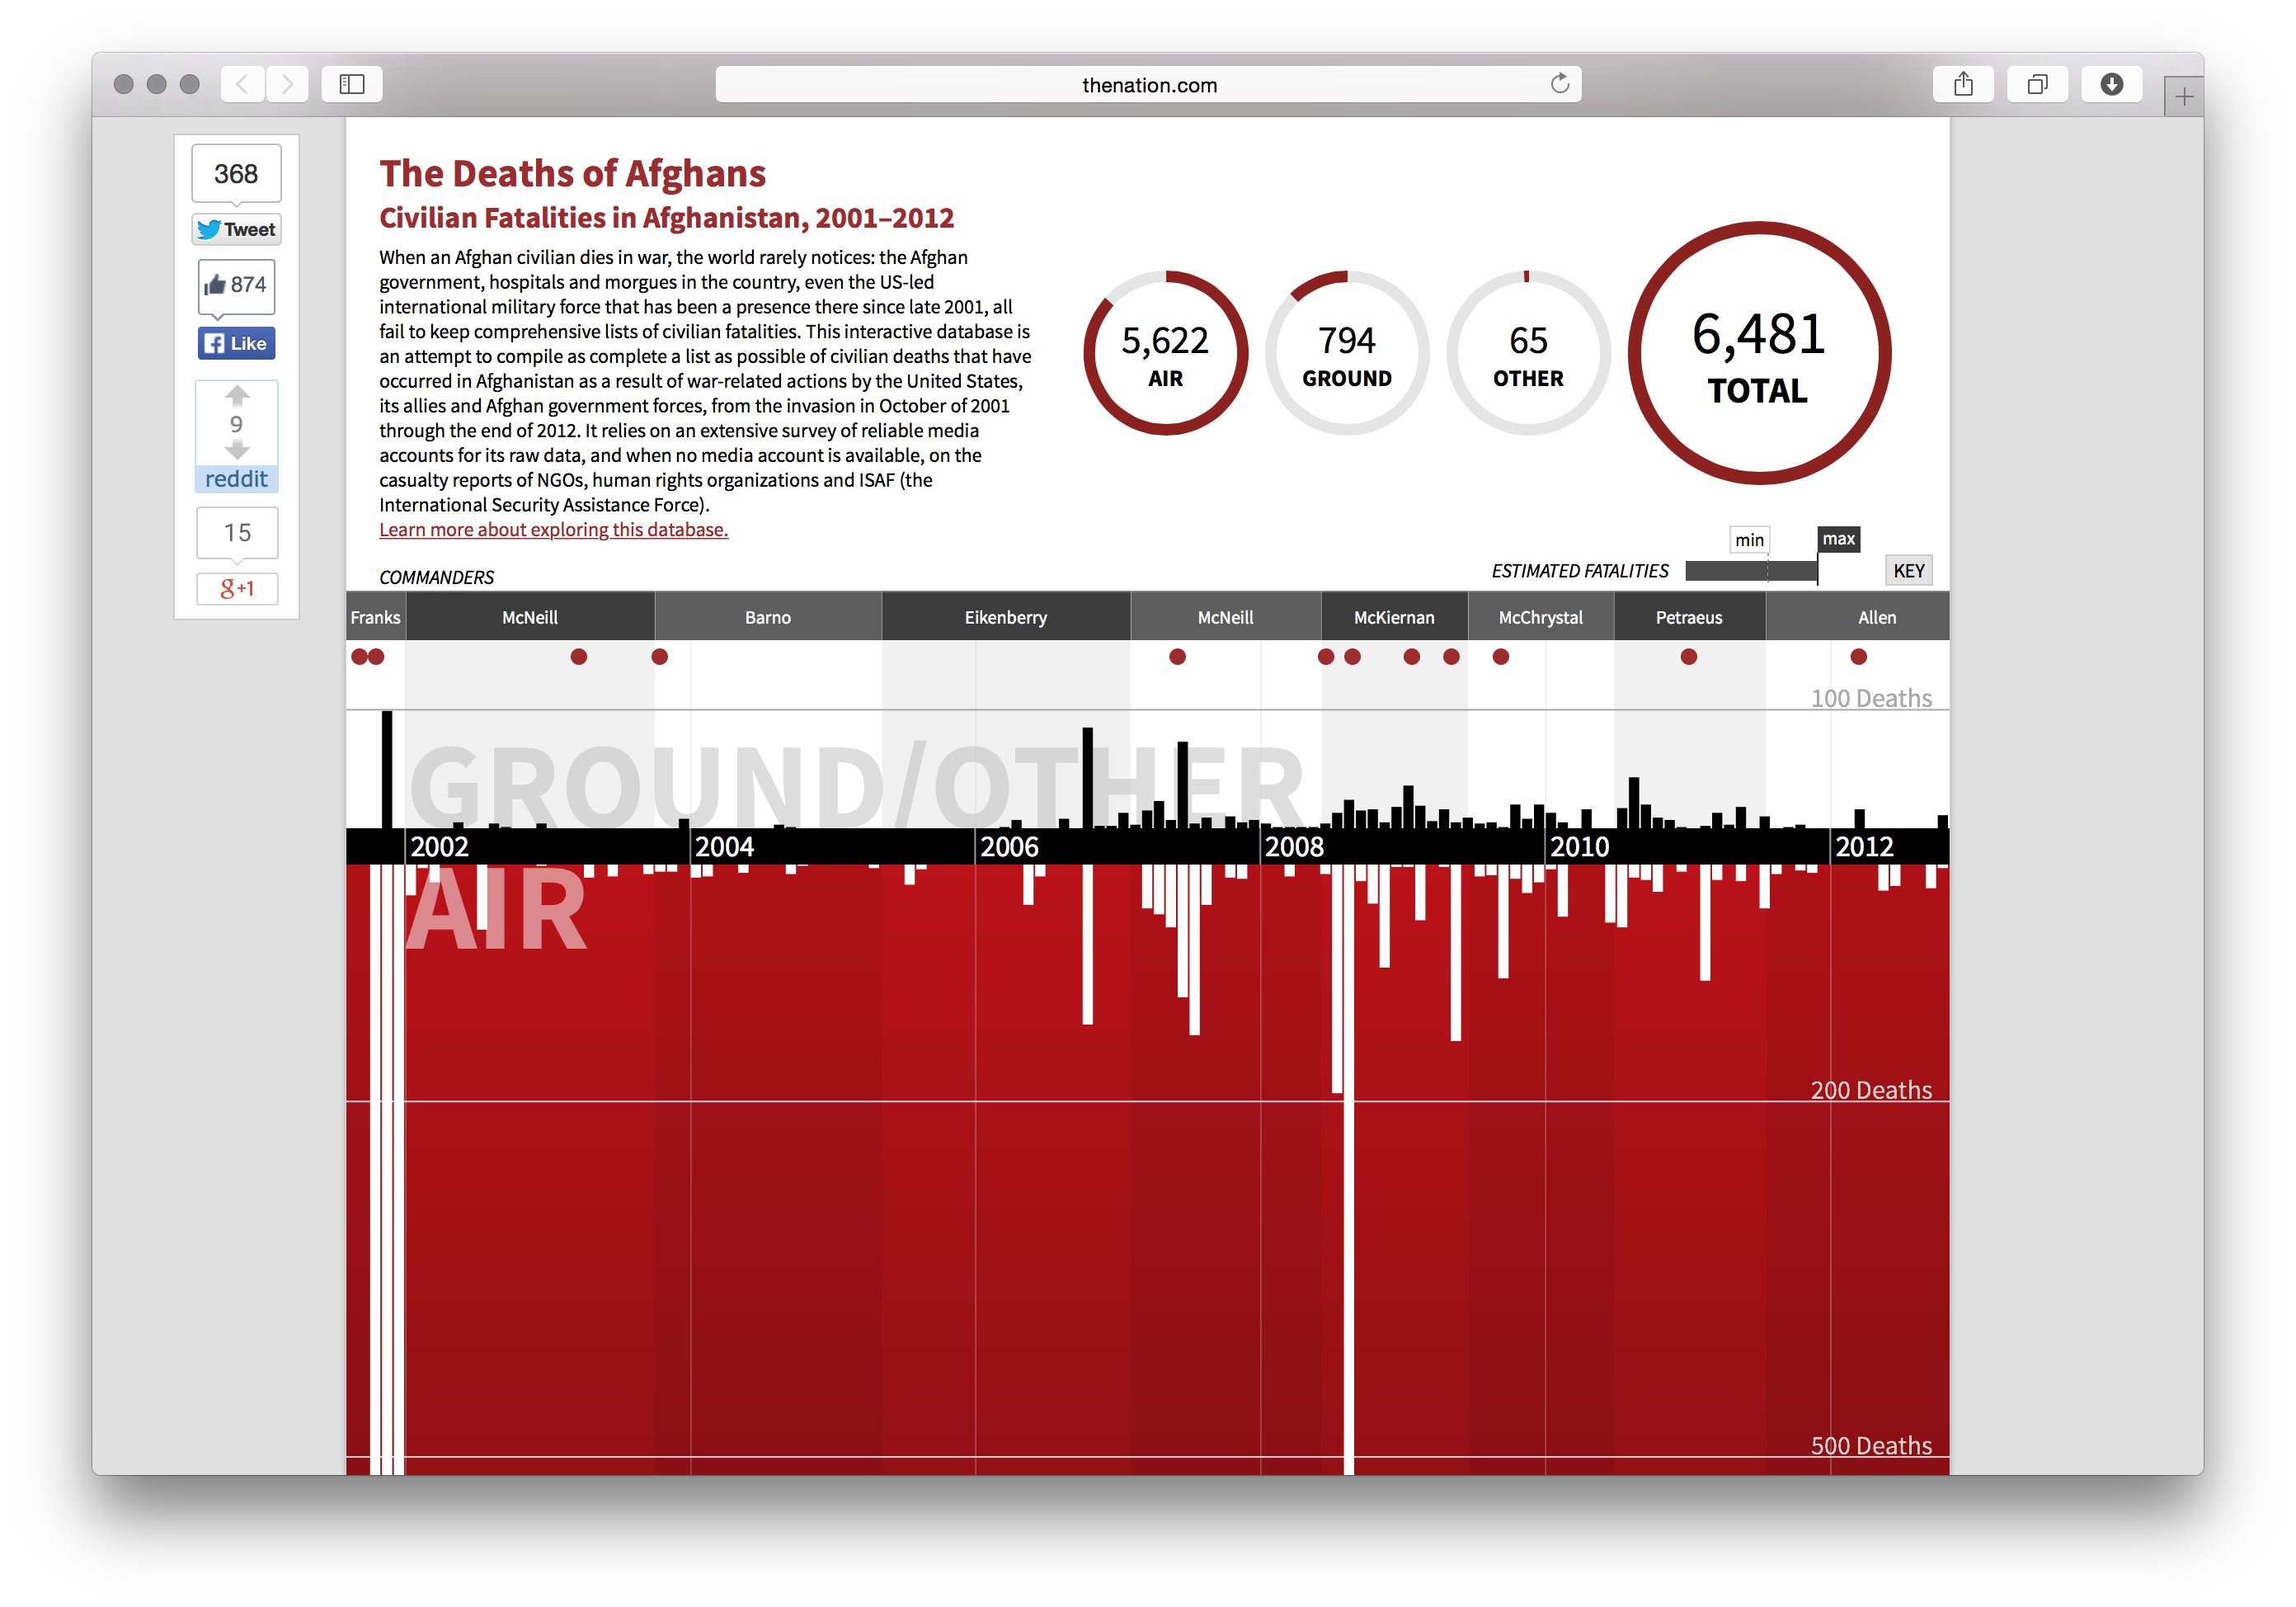
Paid in Blood
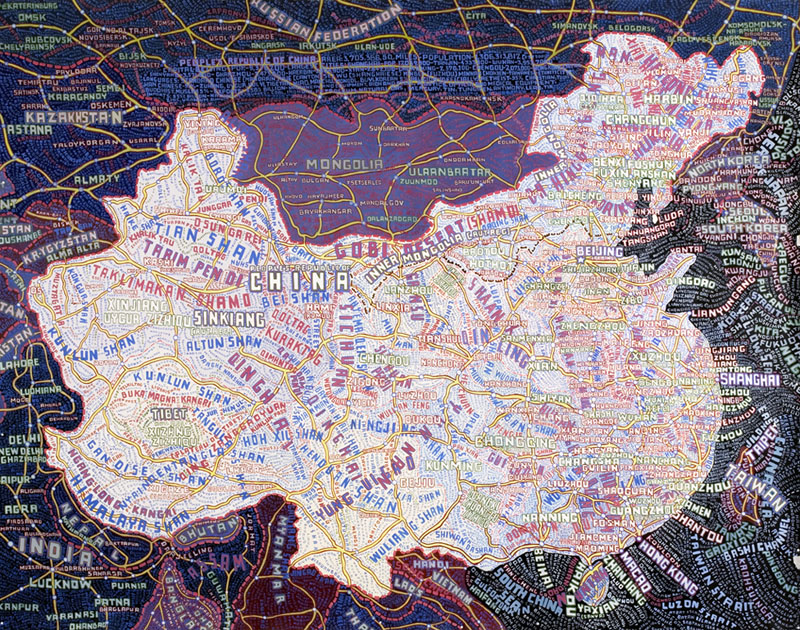
Painted Maps
Paula Scher
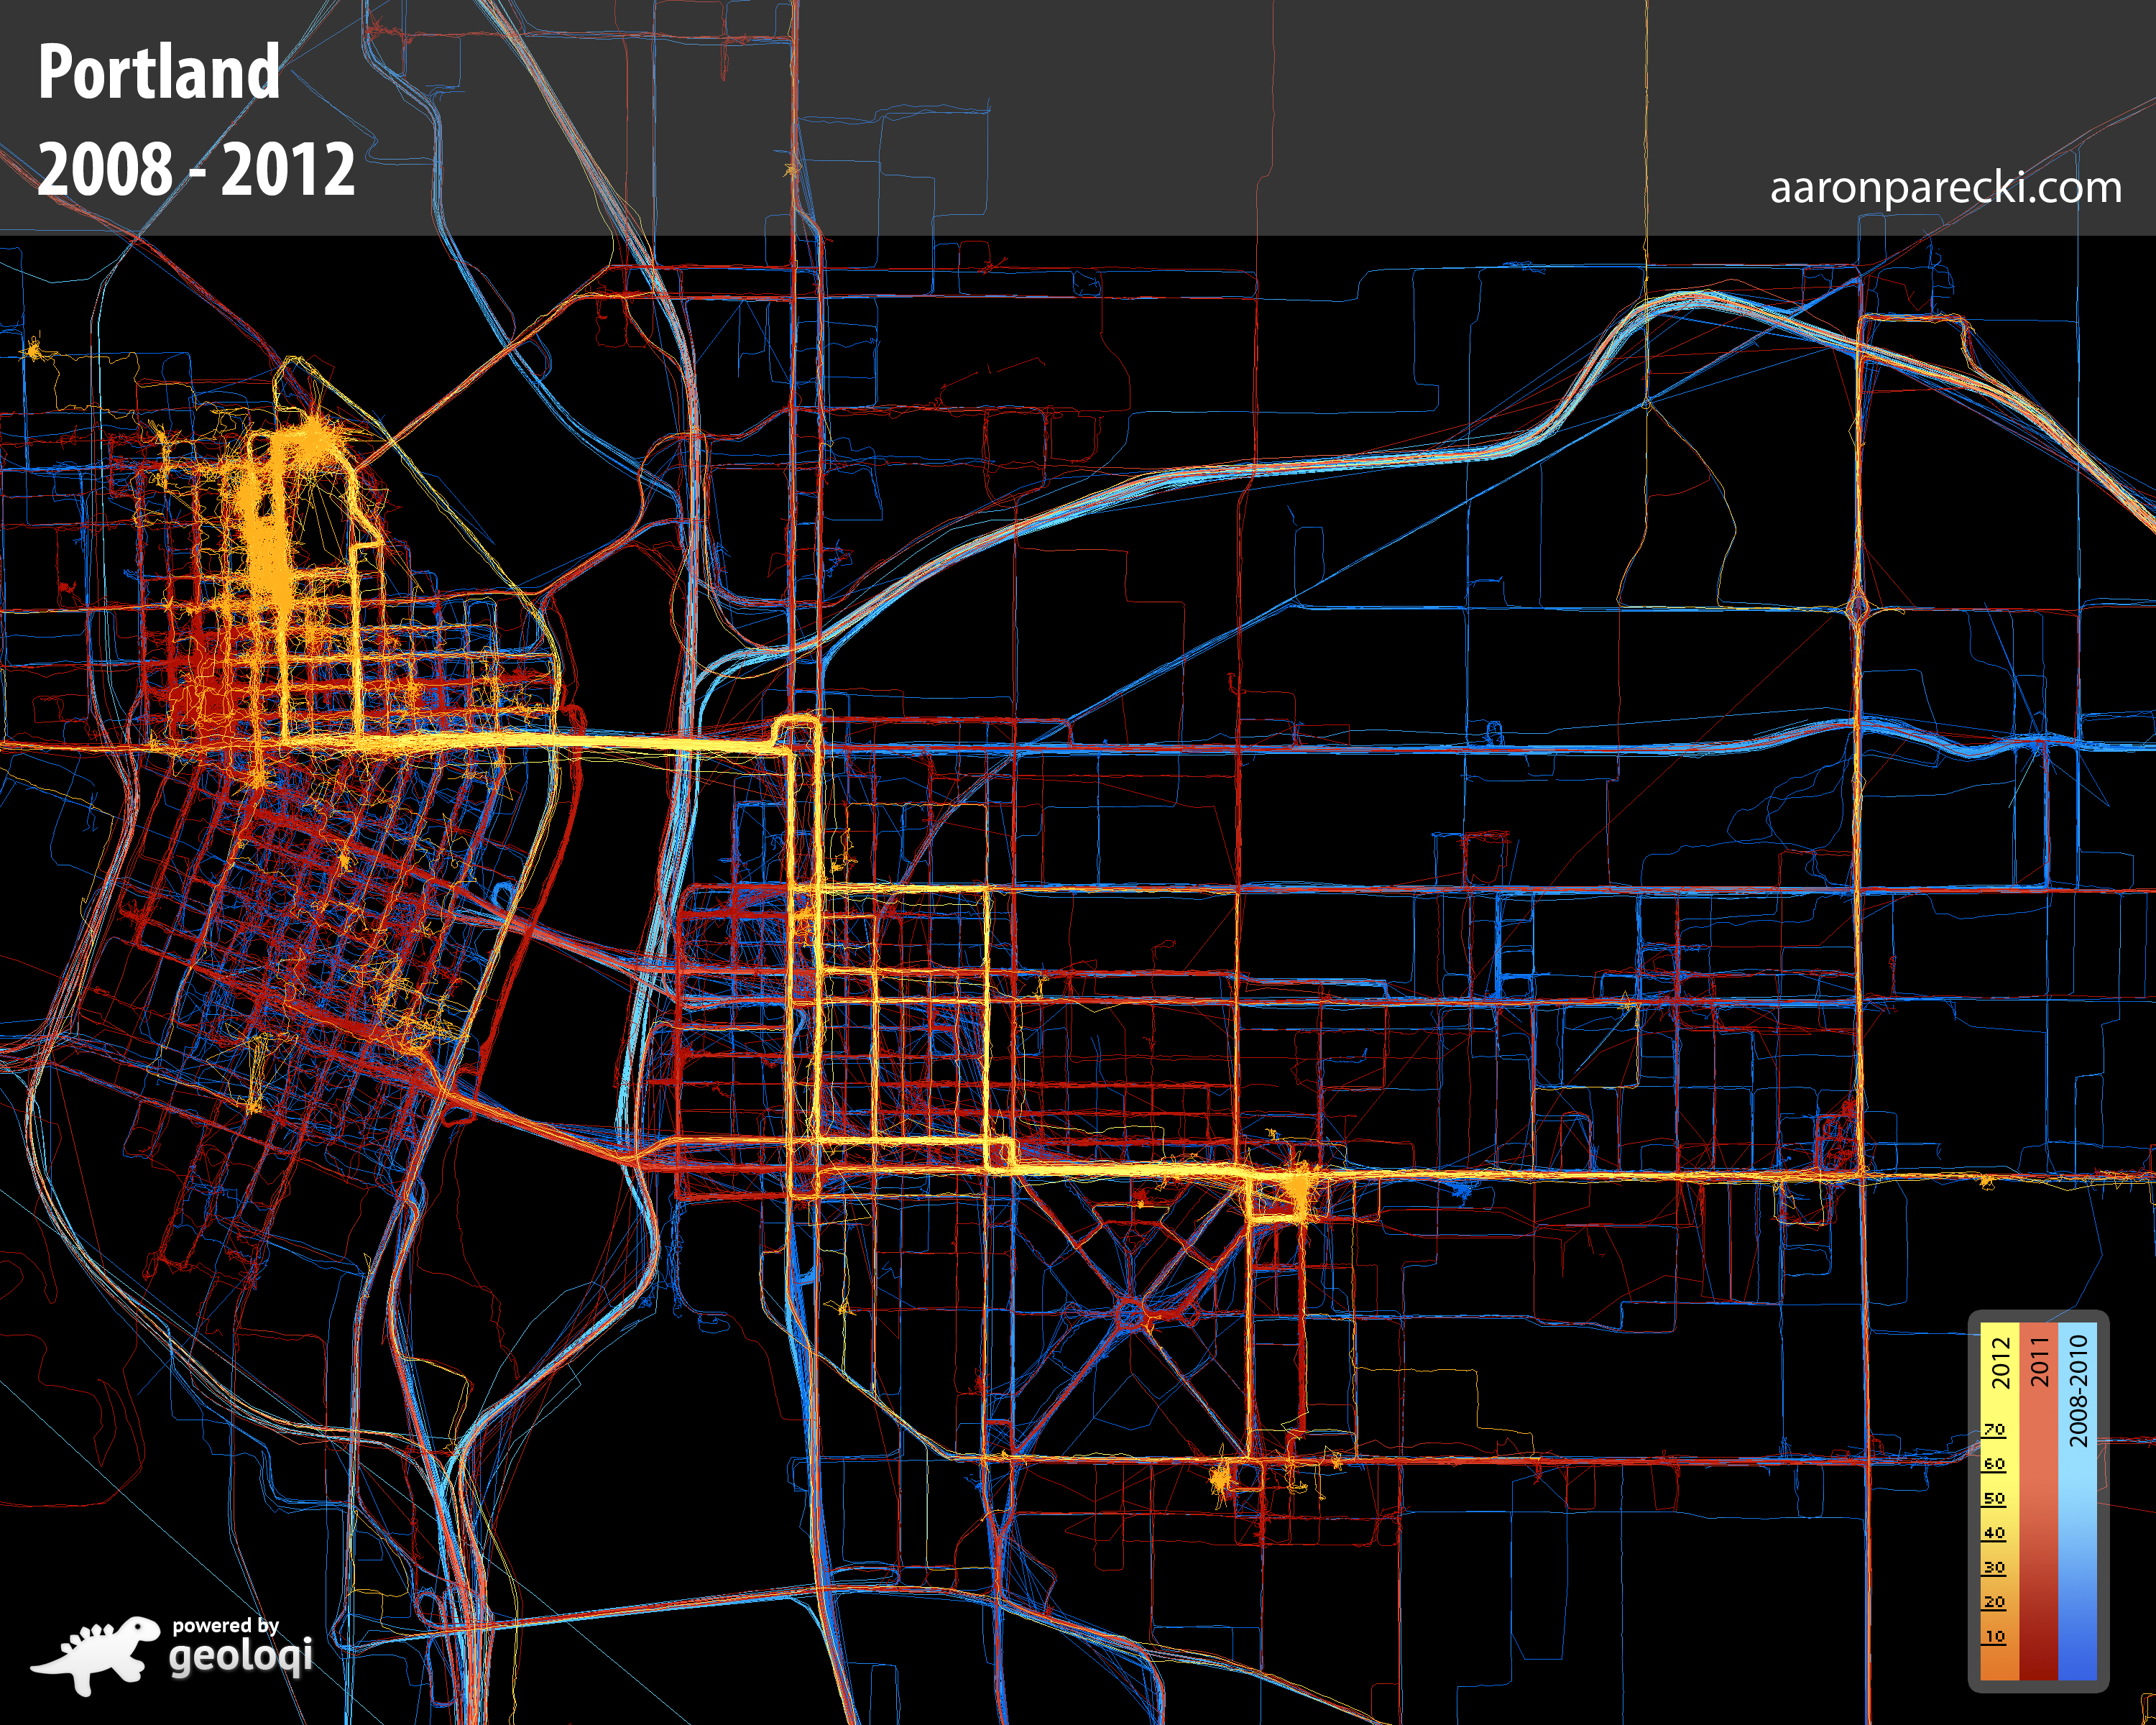
Parecki EverywhereIveBeen
Aaron Parecki
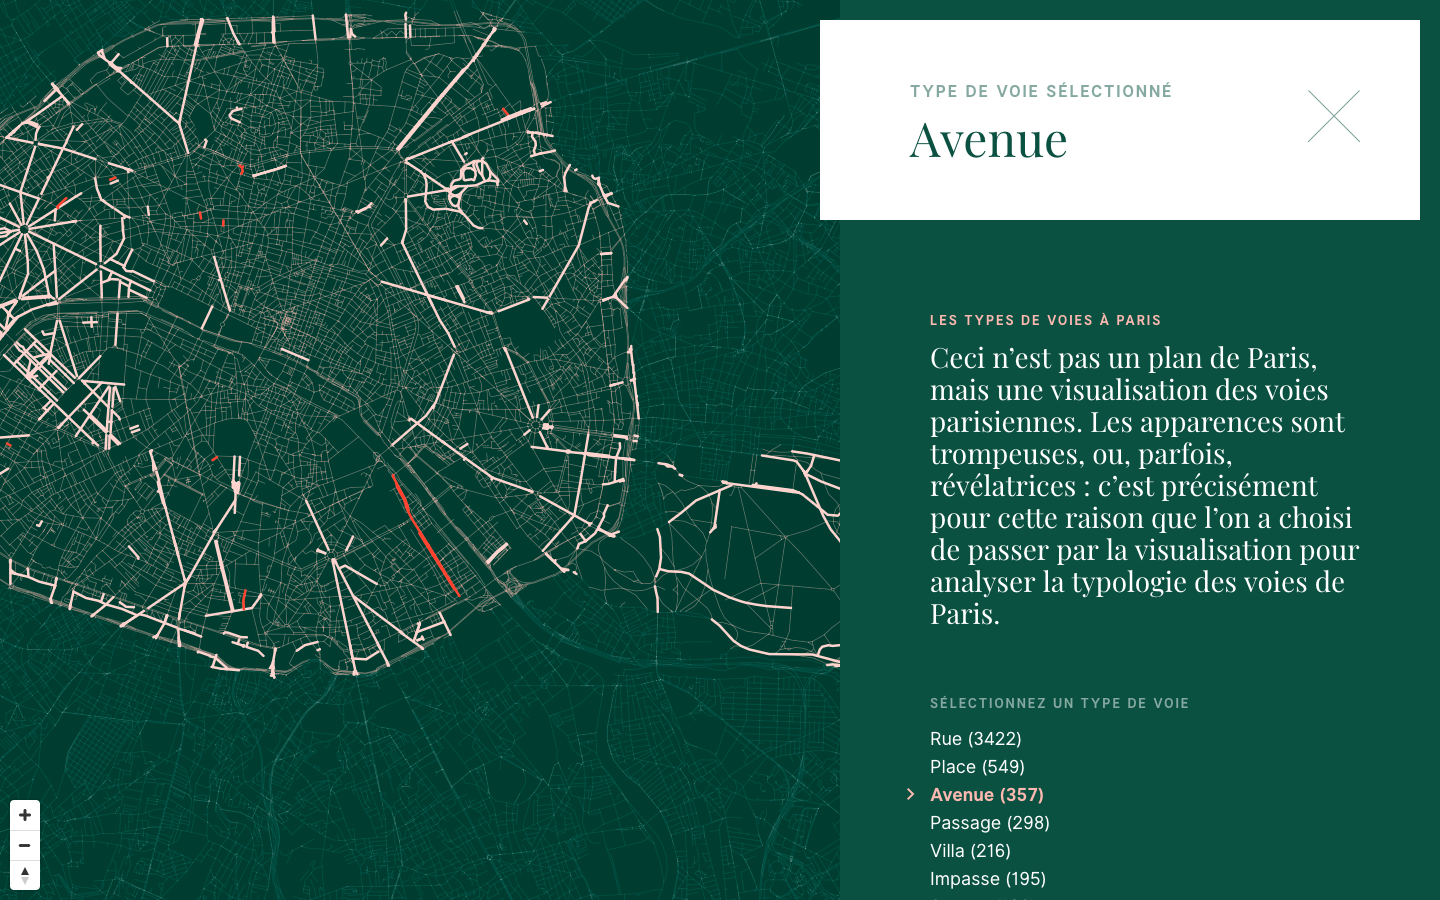
Paris Street Types
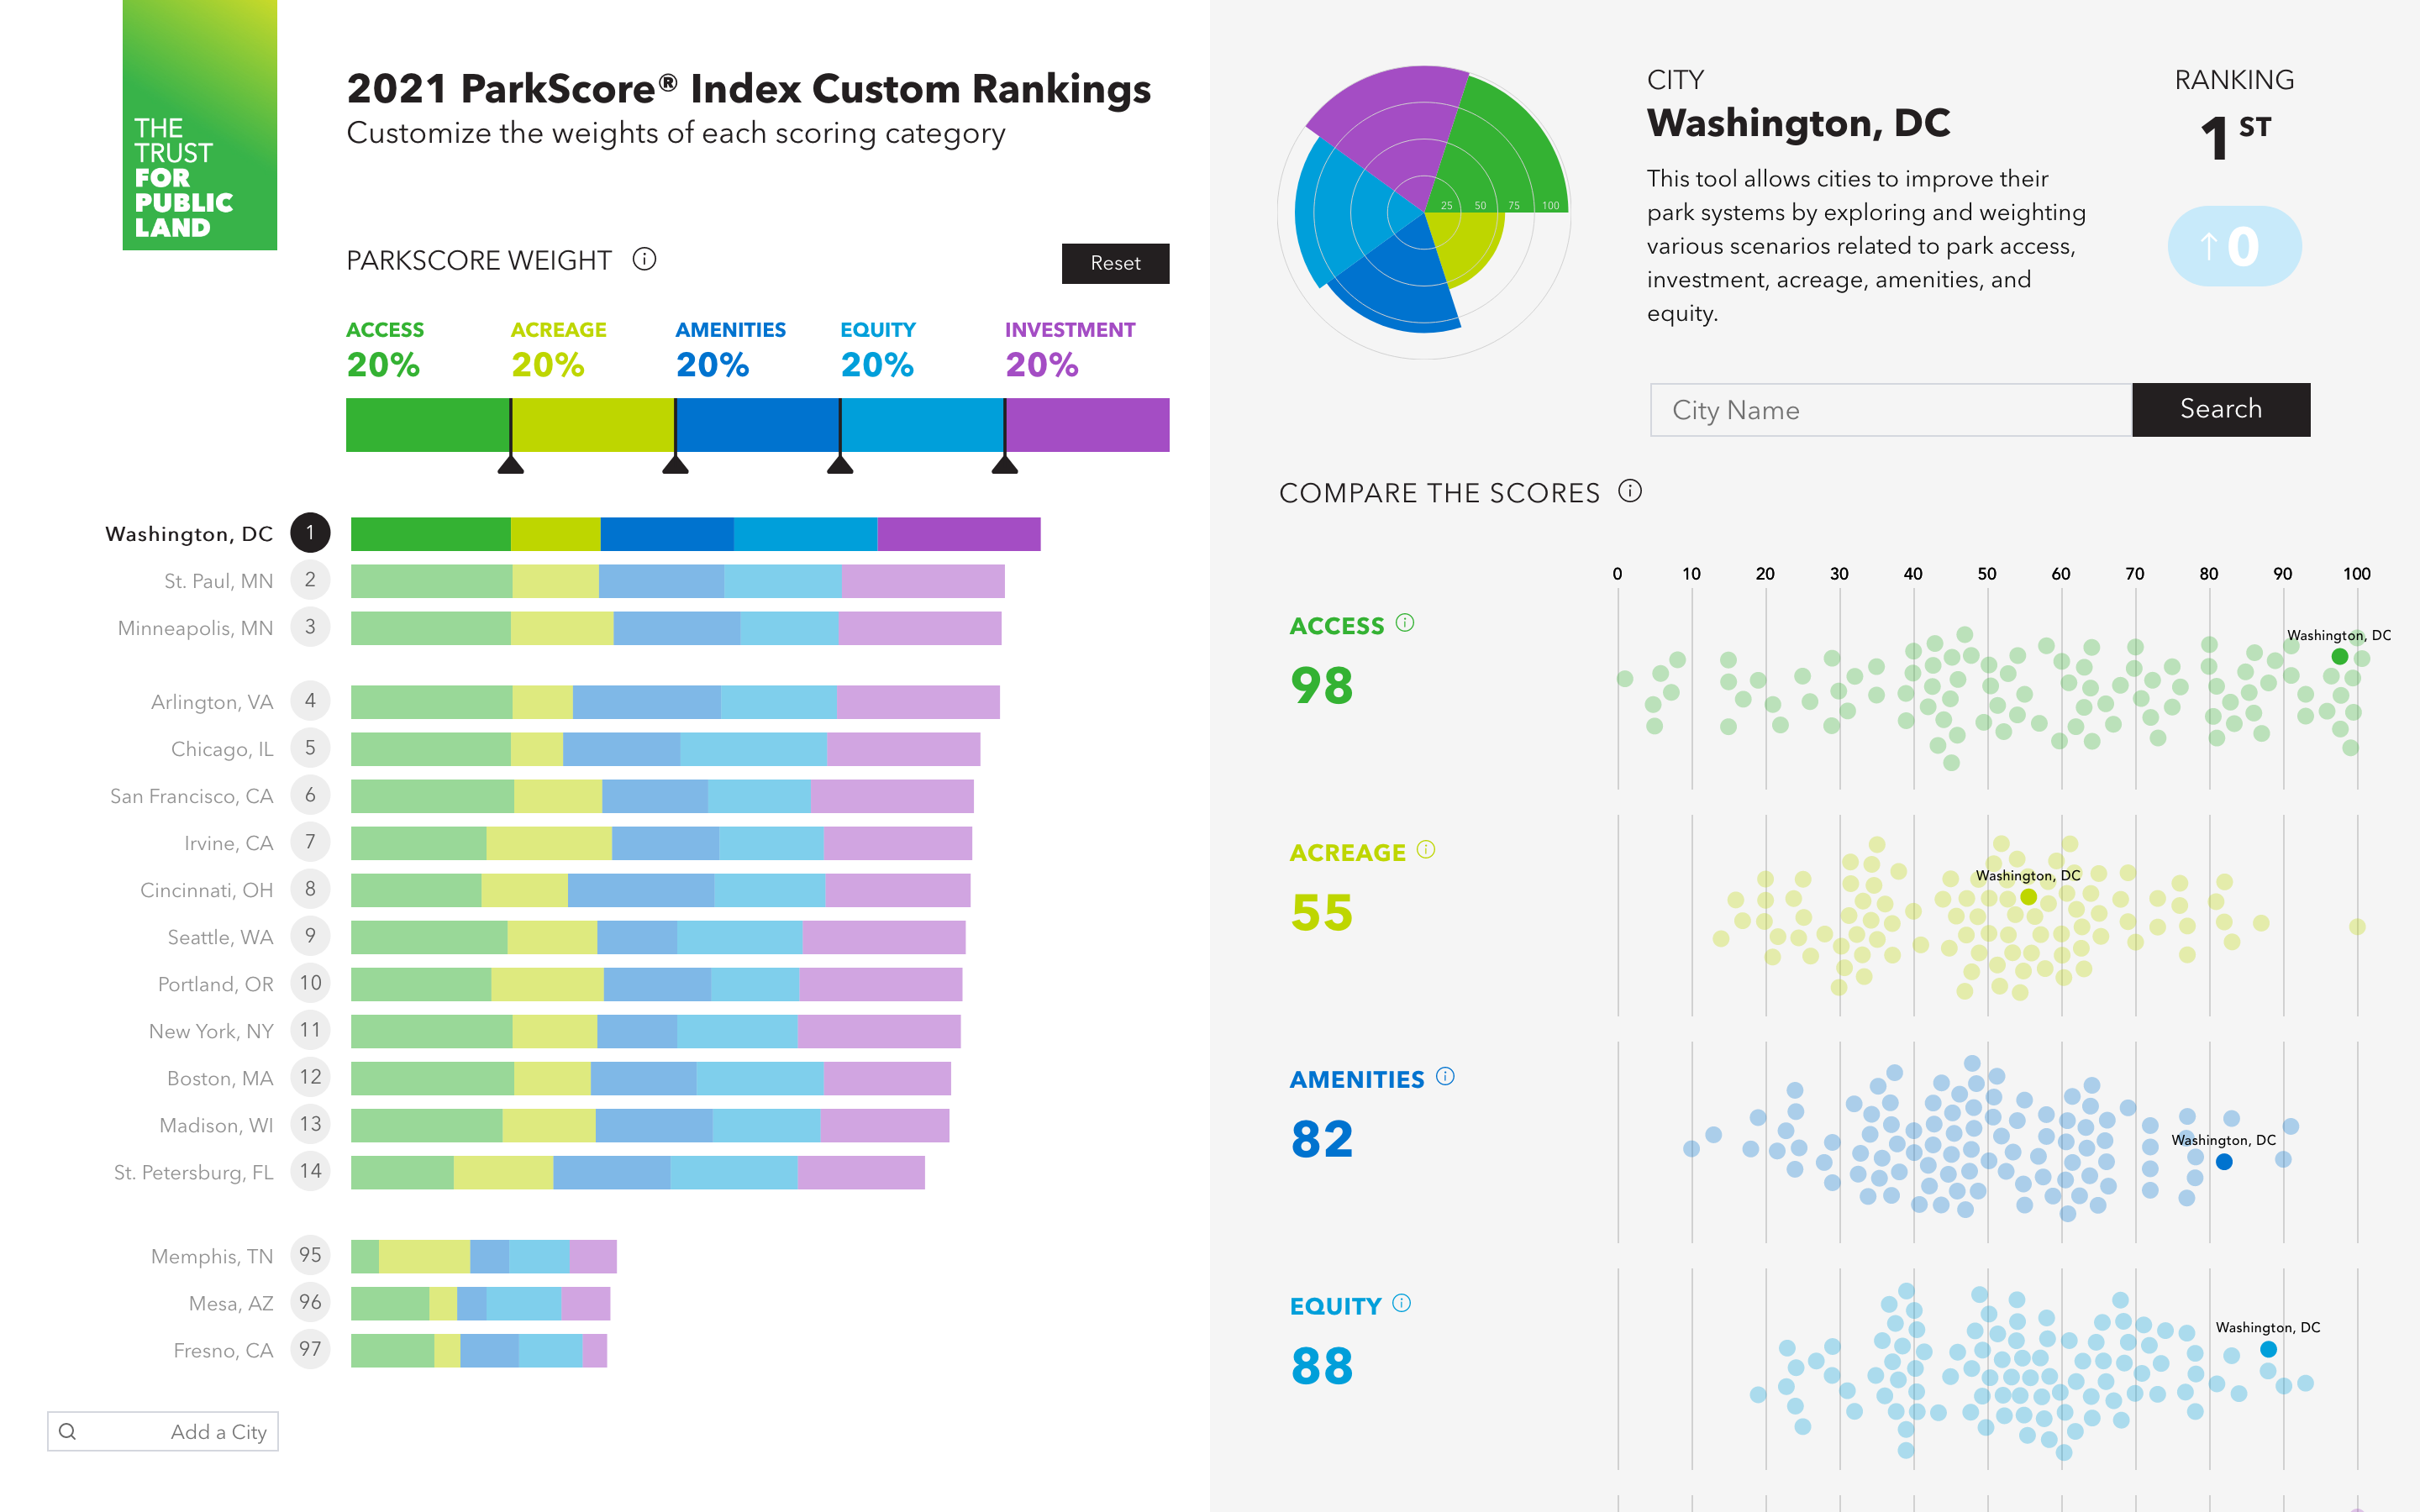
ParkScore Application
Schema Design
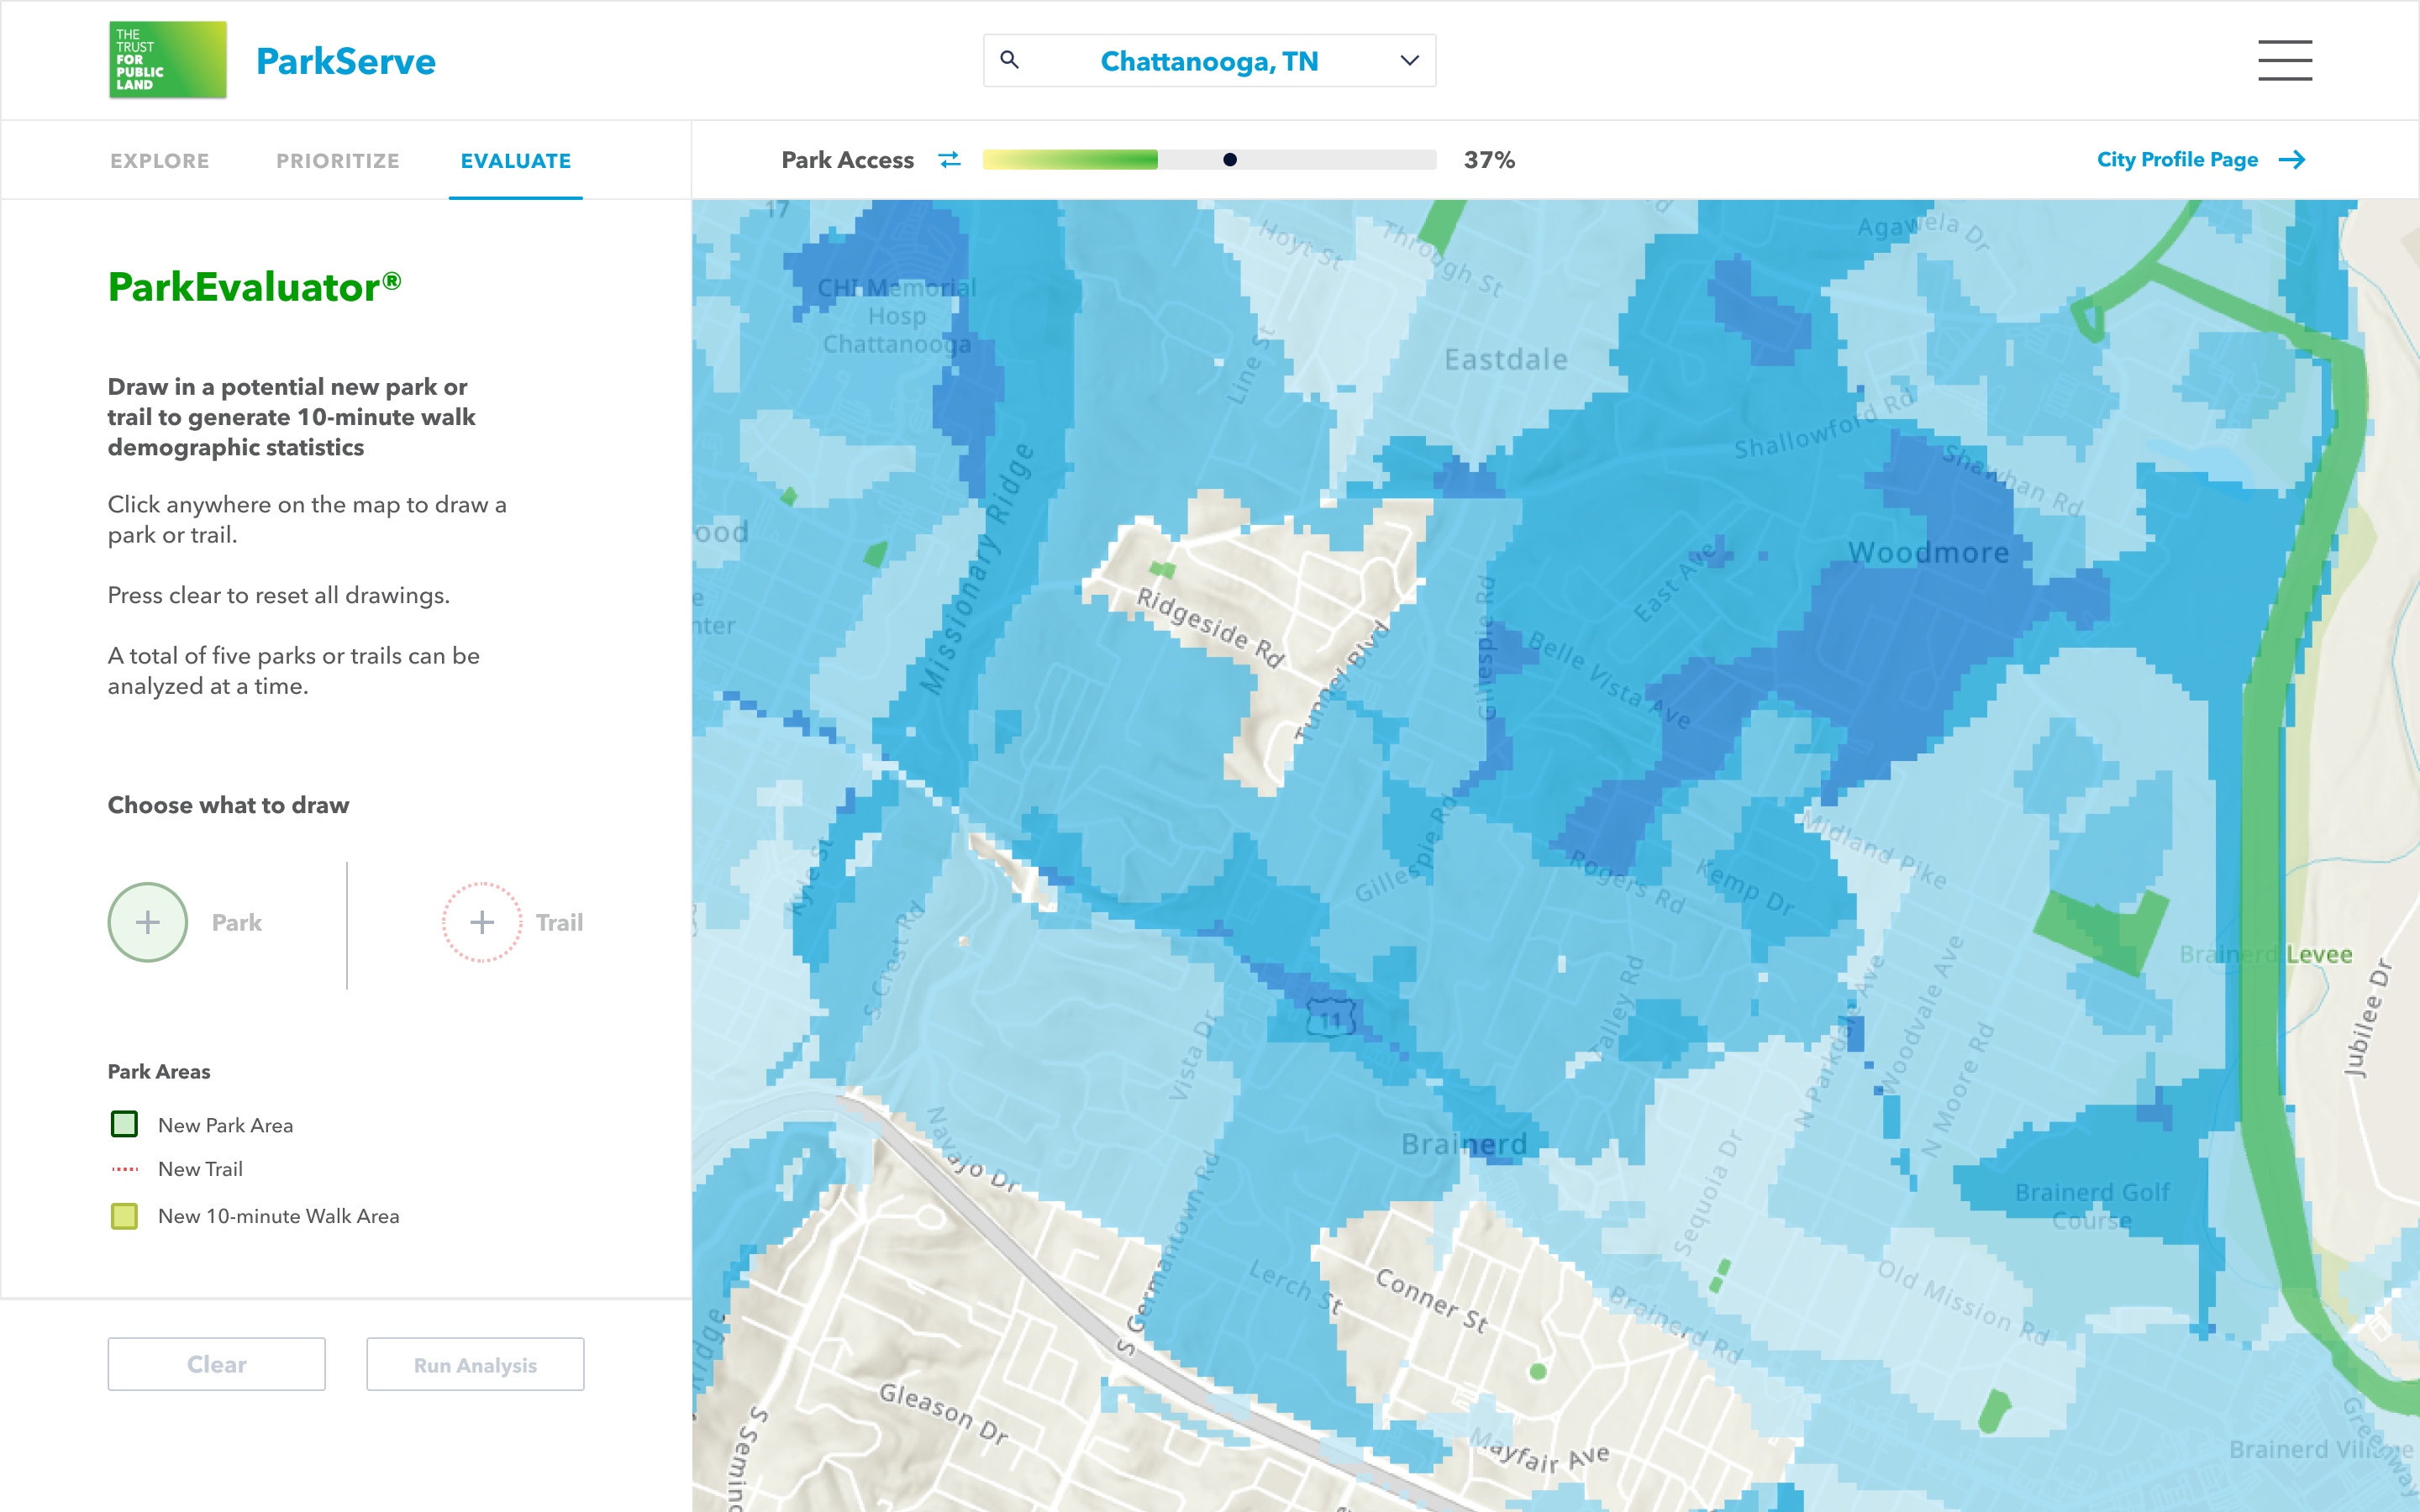
ParkServe
Schema Design
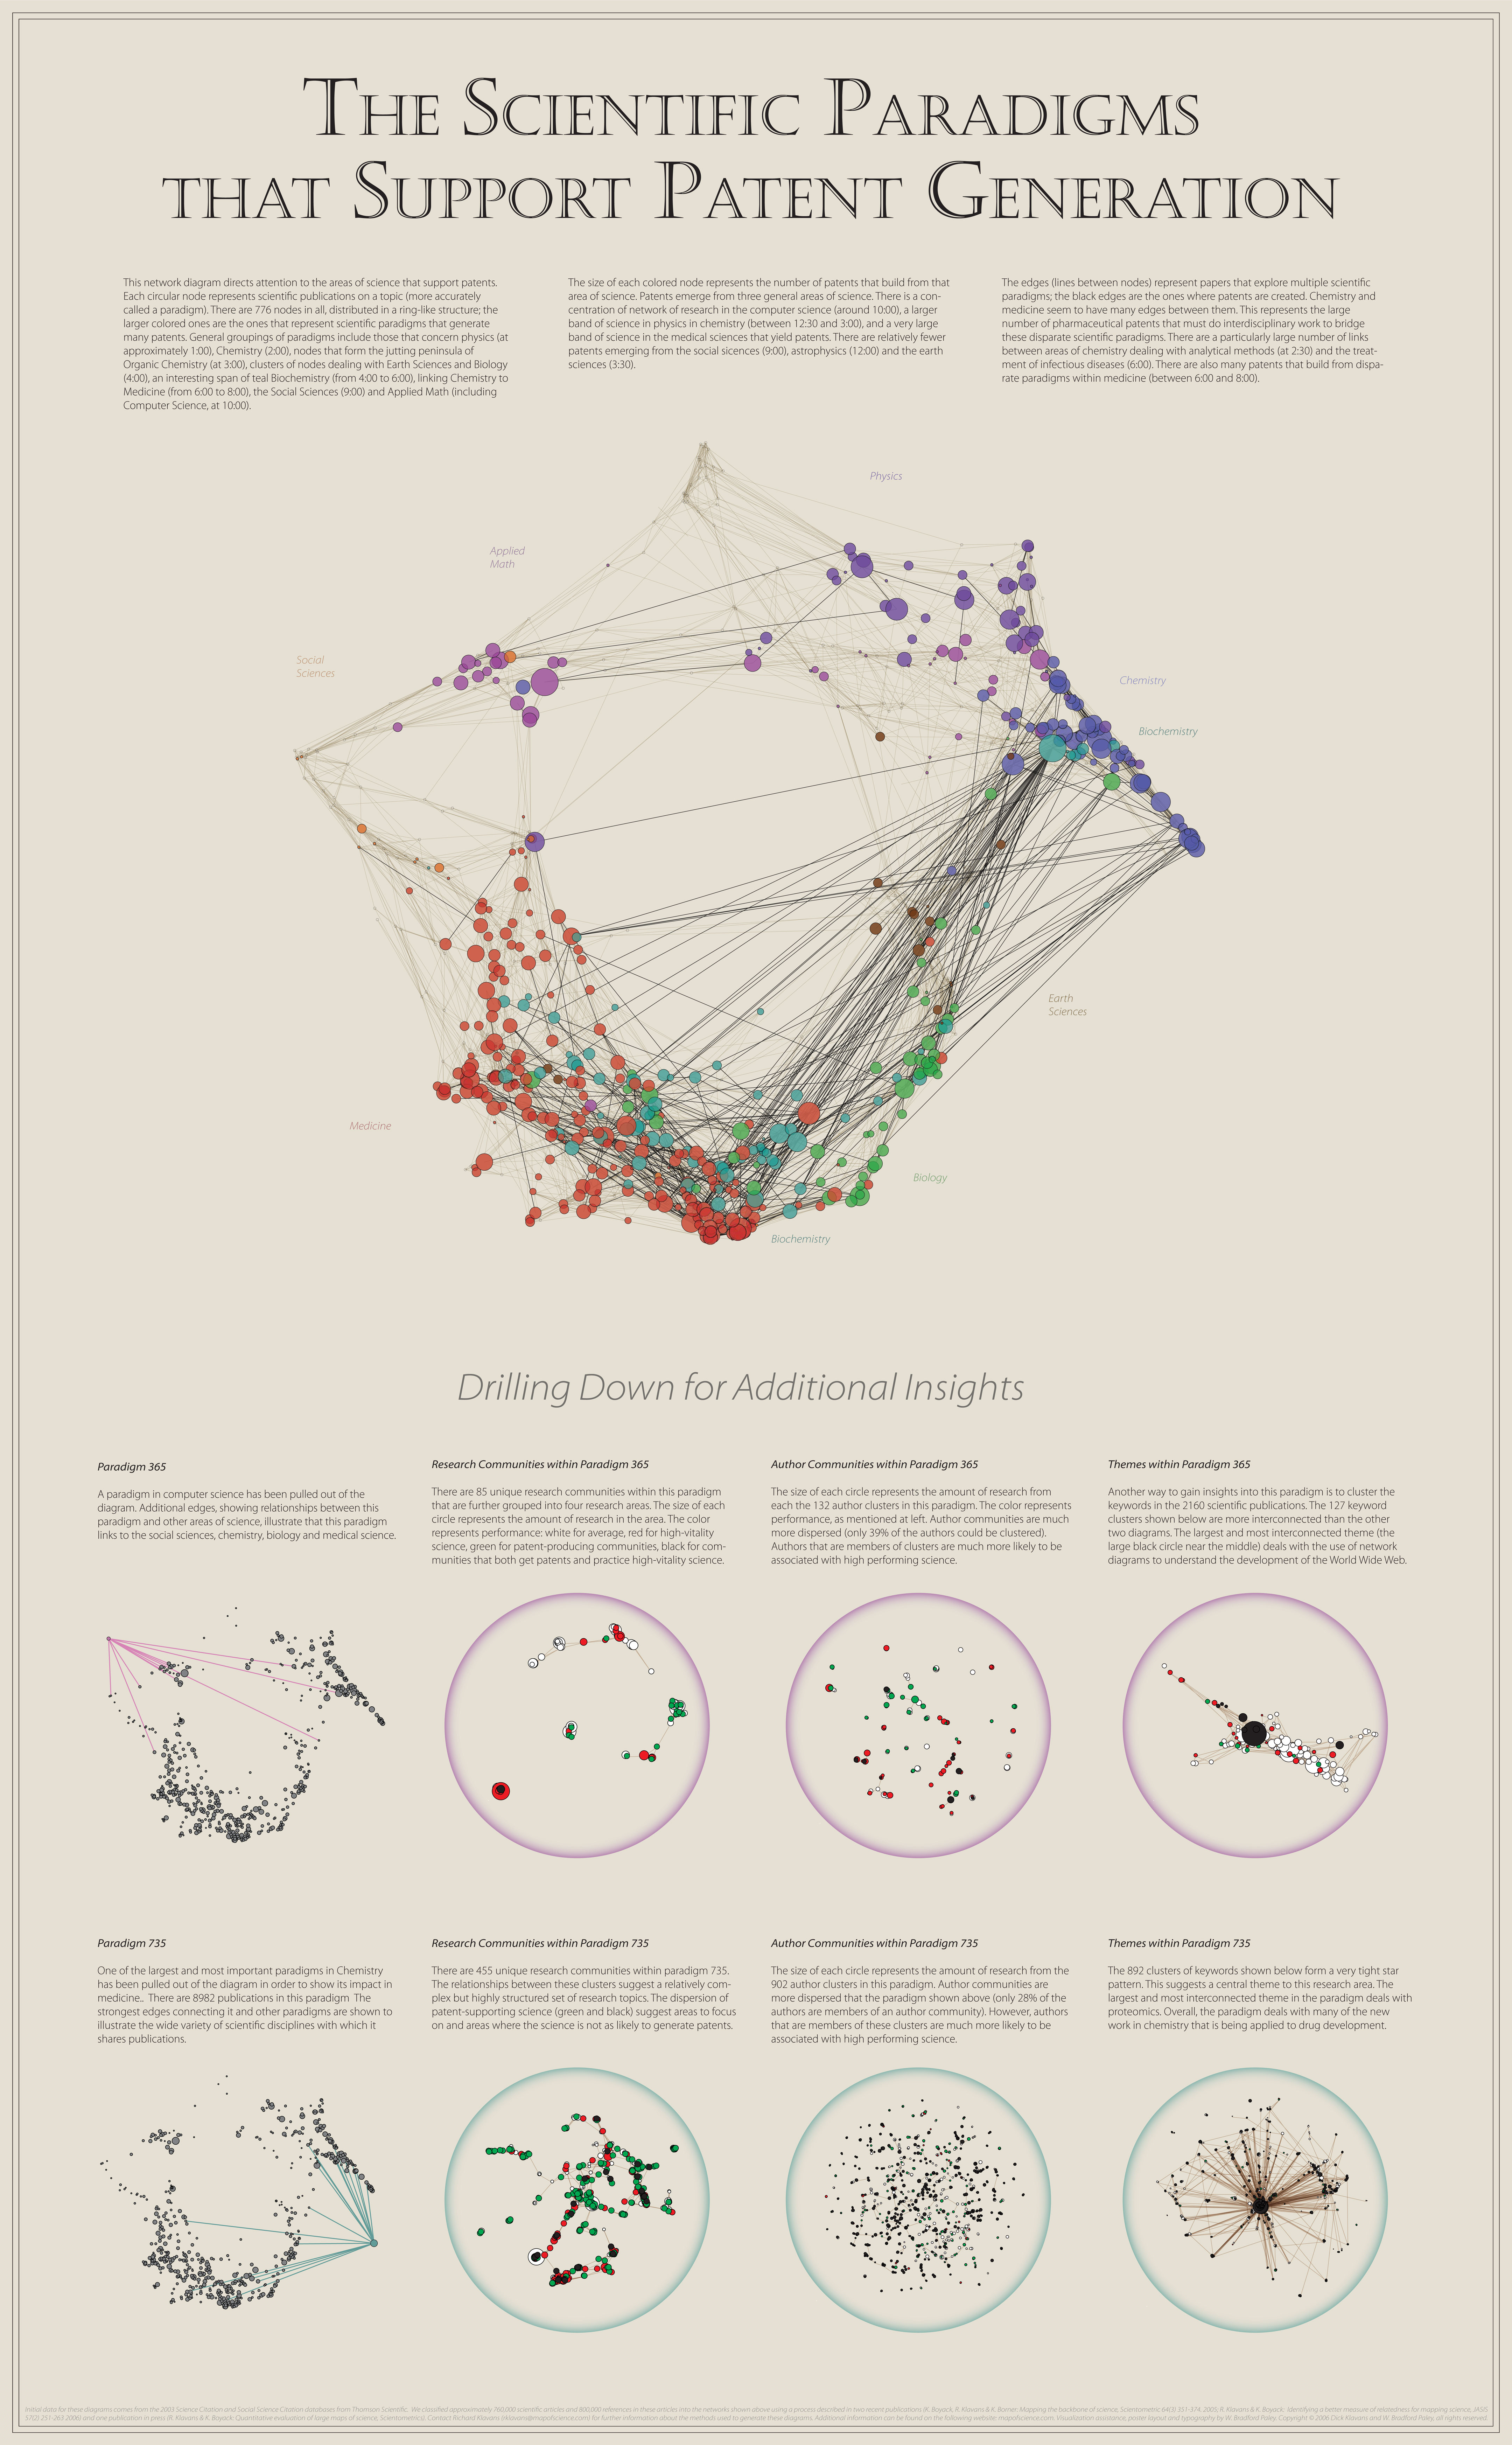
Patent Generation
W. Bradford Paley
Patrick Parrish Gallery Website (2023 Redesign)
Schema Design
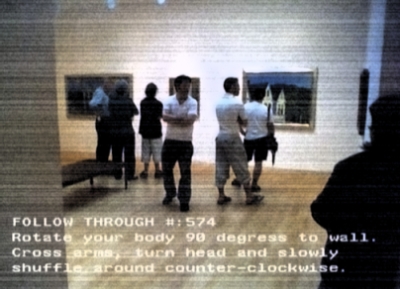
Patterson Follow Through
Patterson
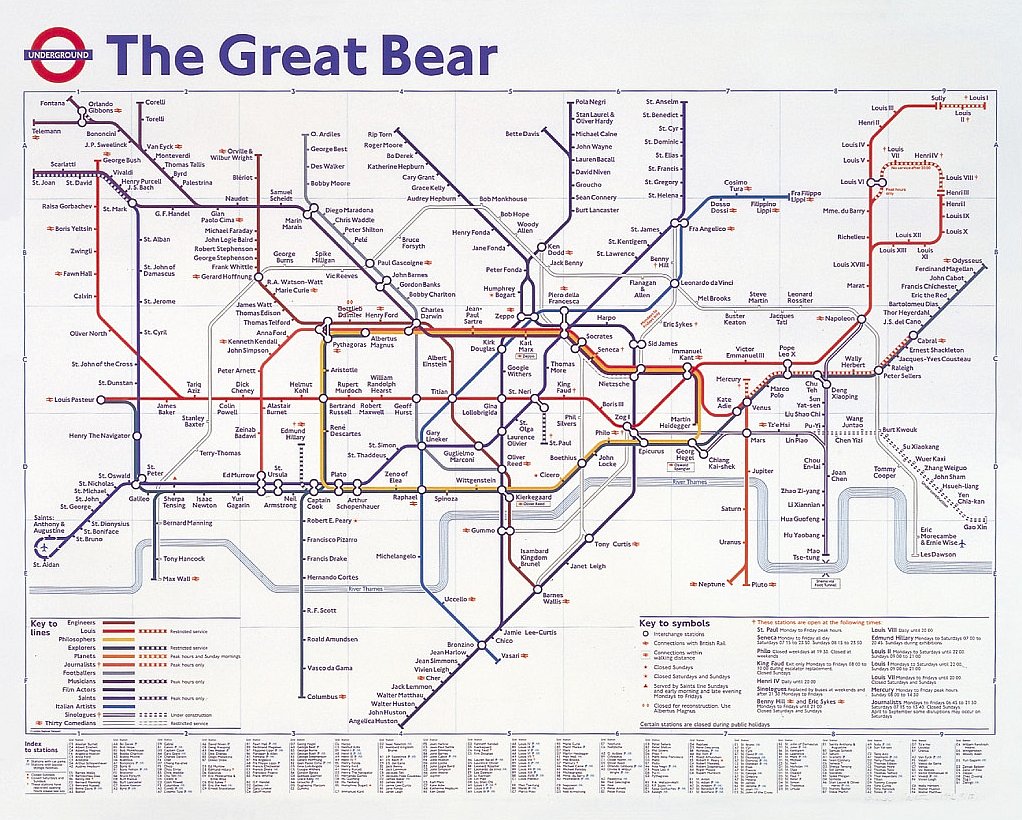
Patterson The Great Bear
Simon Patterson
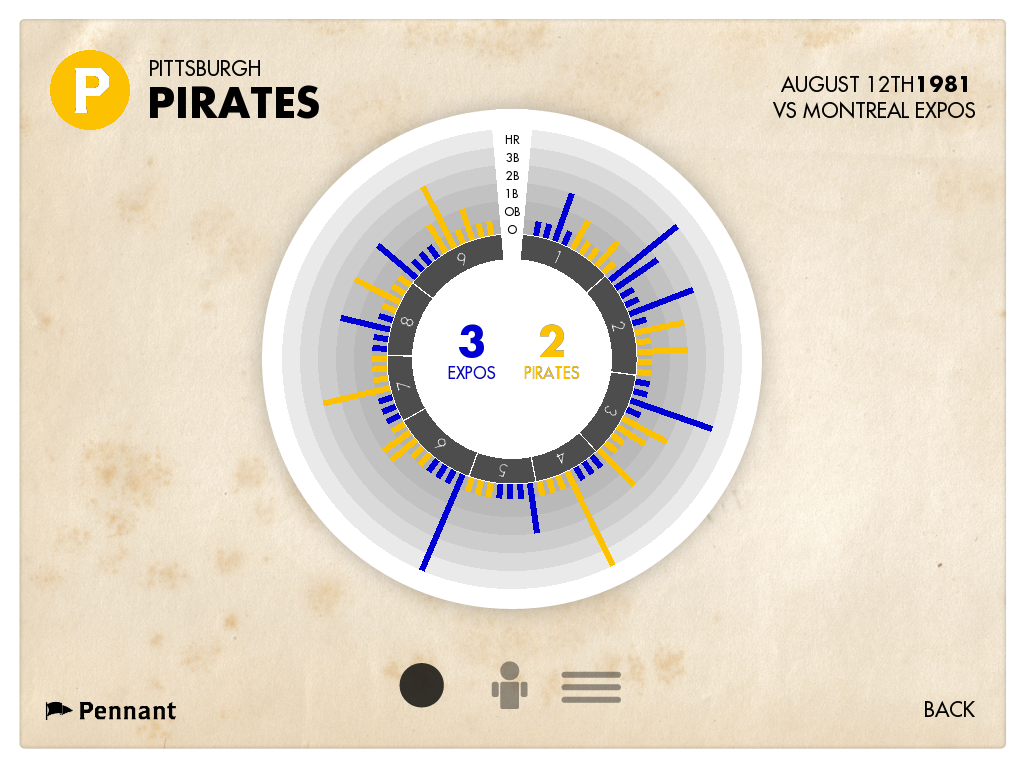
Pennant
n/a
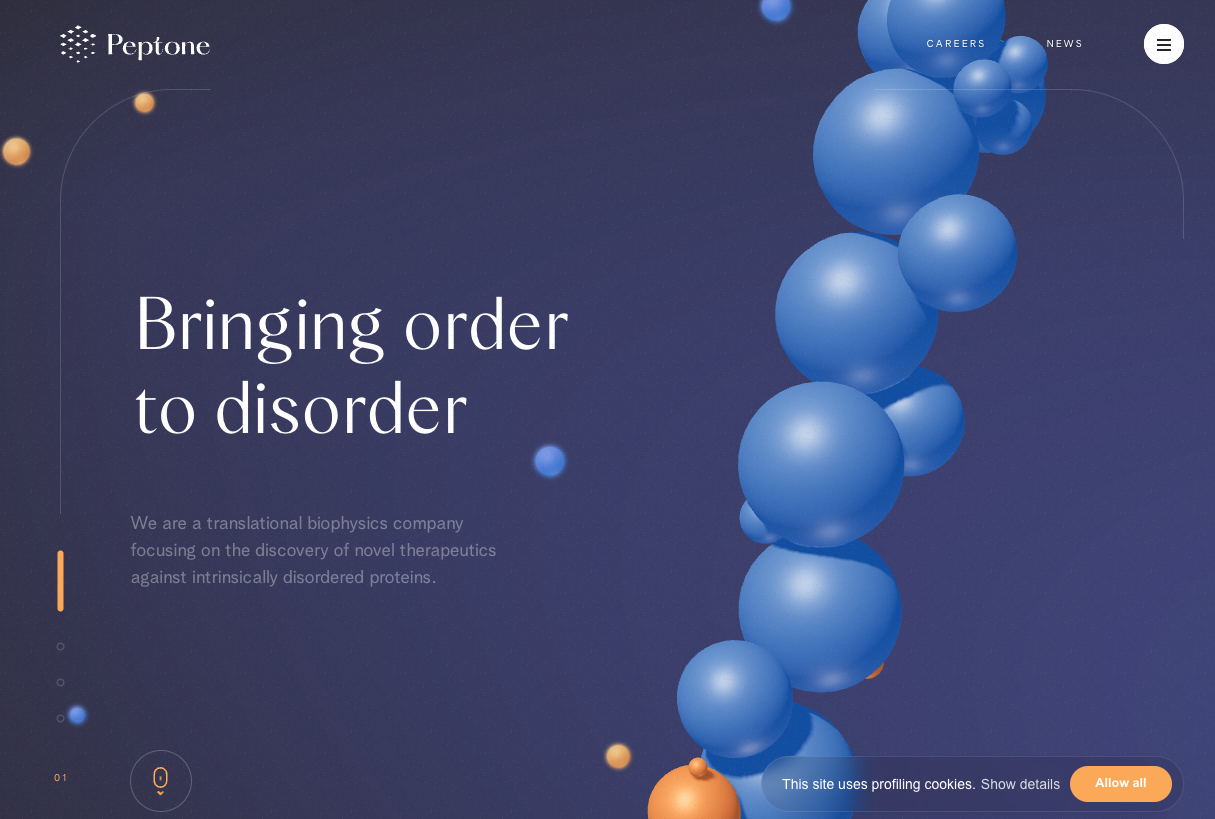
Peptone
Personal Data Visualizations
Jer Thorp / Hwang

Pinellas County’s Public School Inequalities for Black Pupils, Tampa Bay Times
Tampa Bay Times
Pitch Interactive
Pitch Interactive

Playboy Centerfold Averages
Jason Salavon

Plot Parade
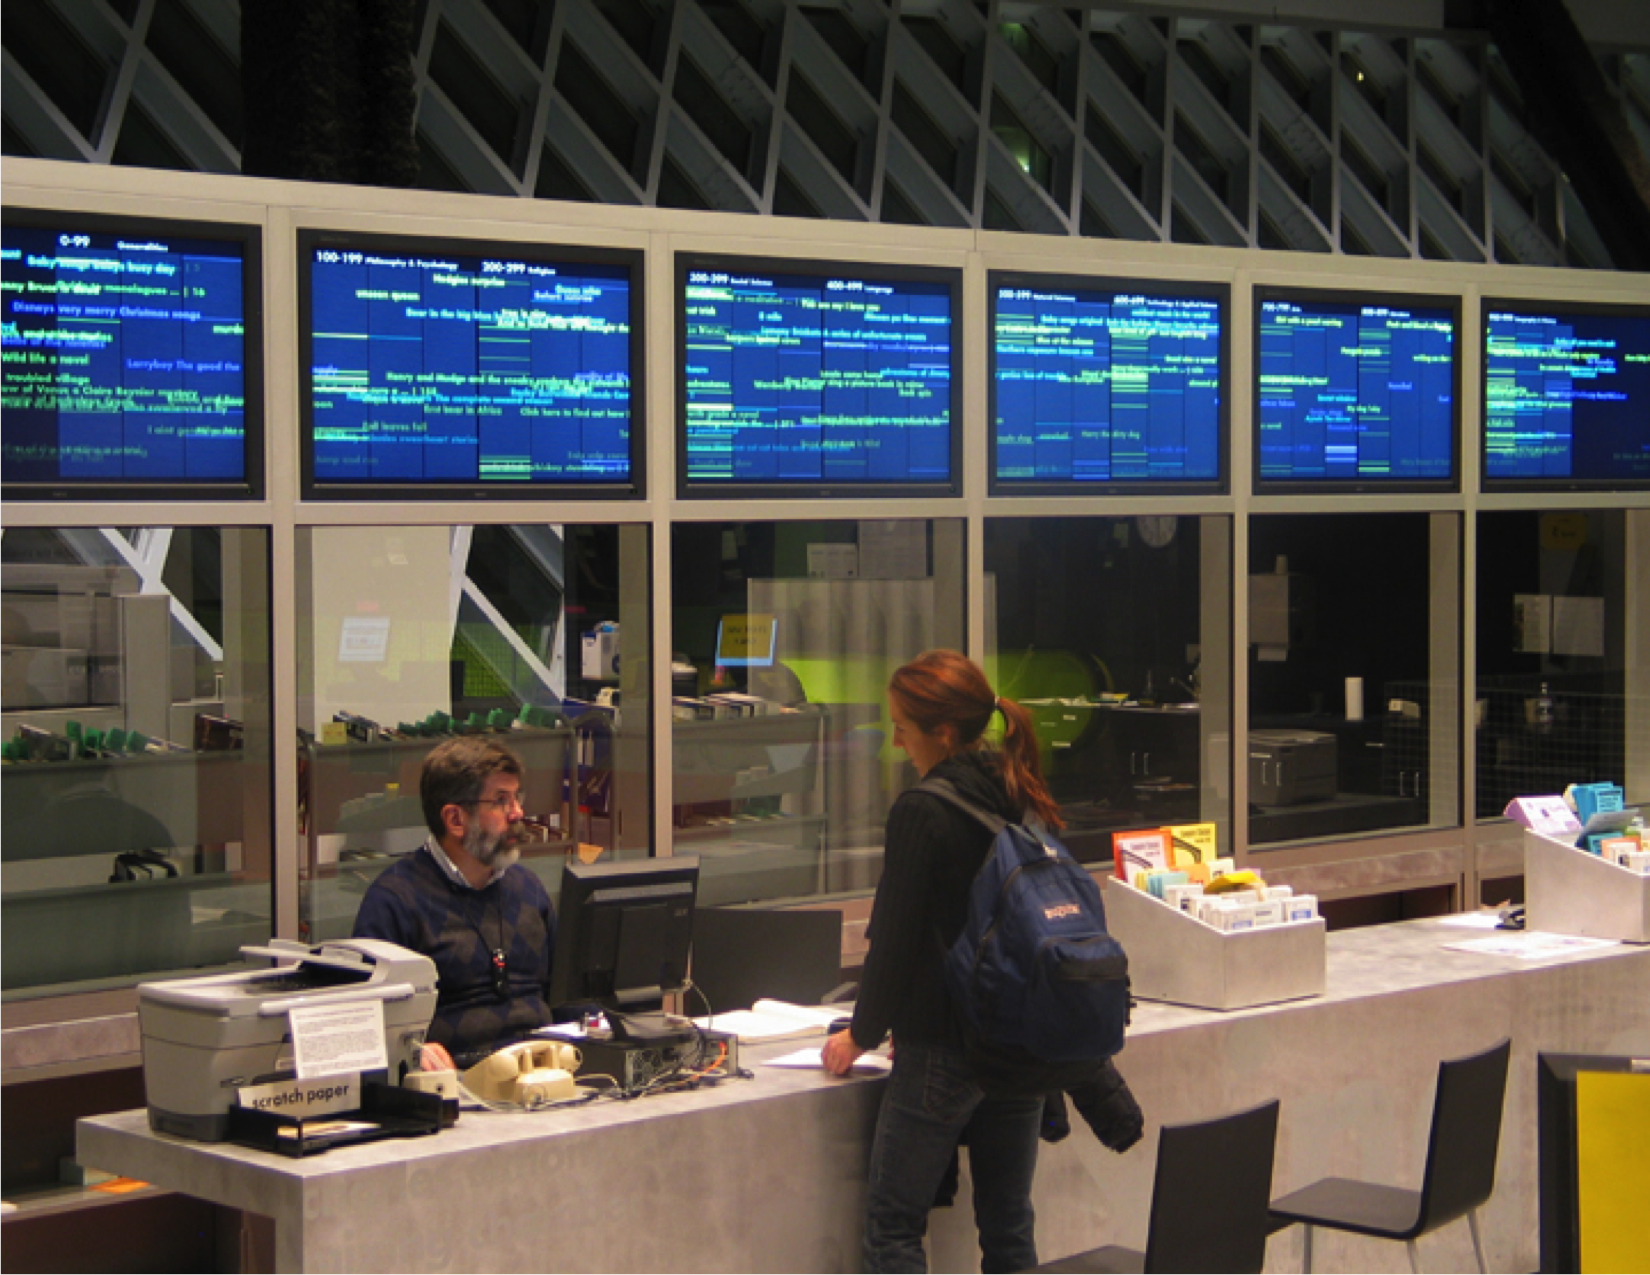
Pockets Full of Memories
George Legrady
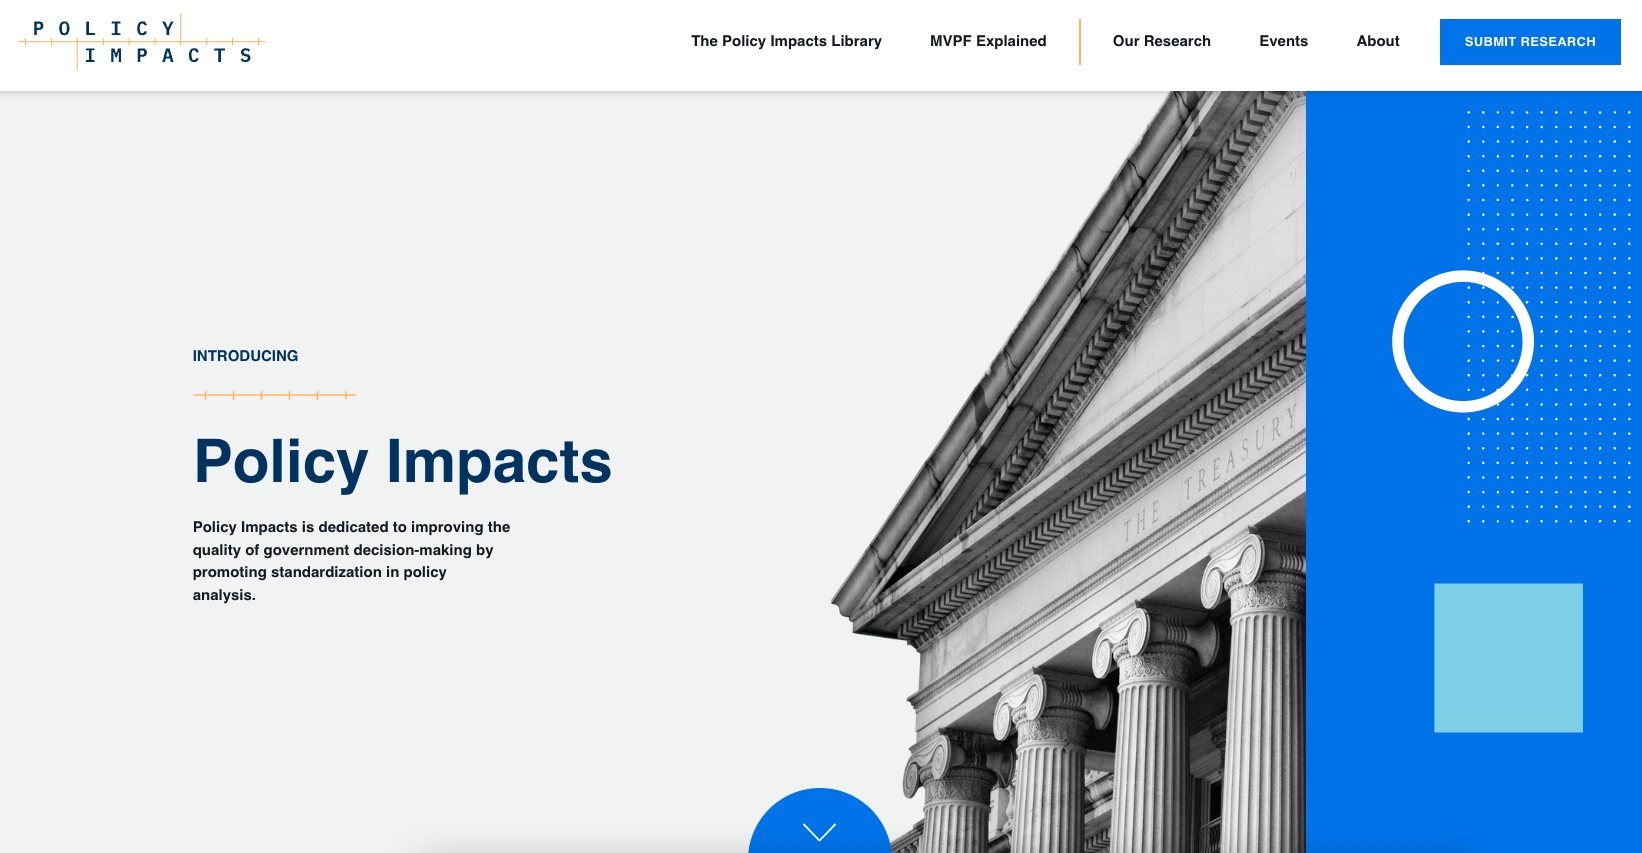
Policy Impacts
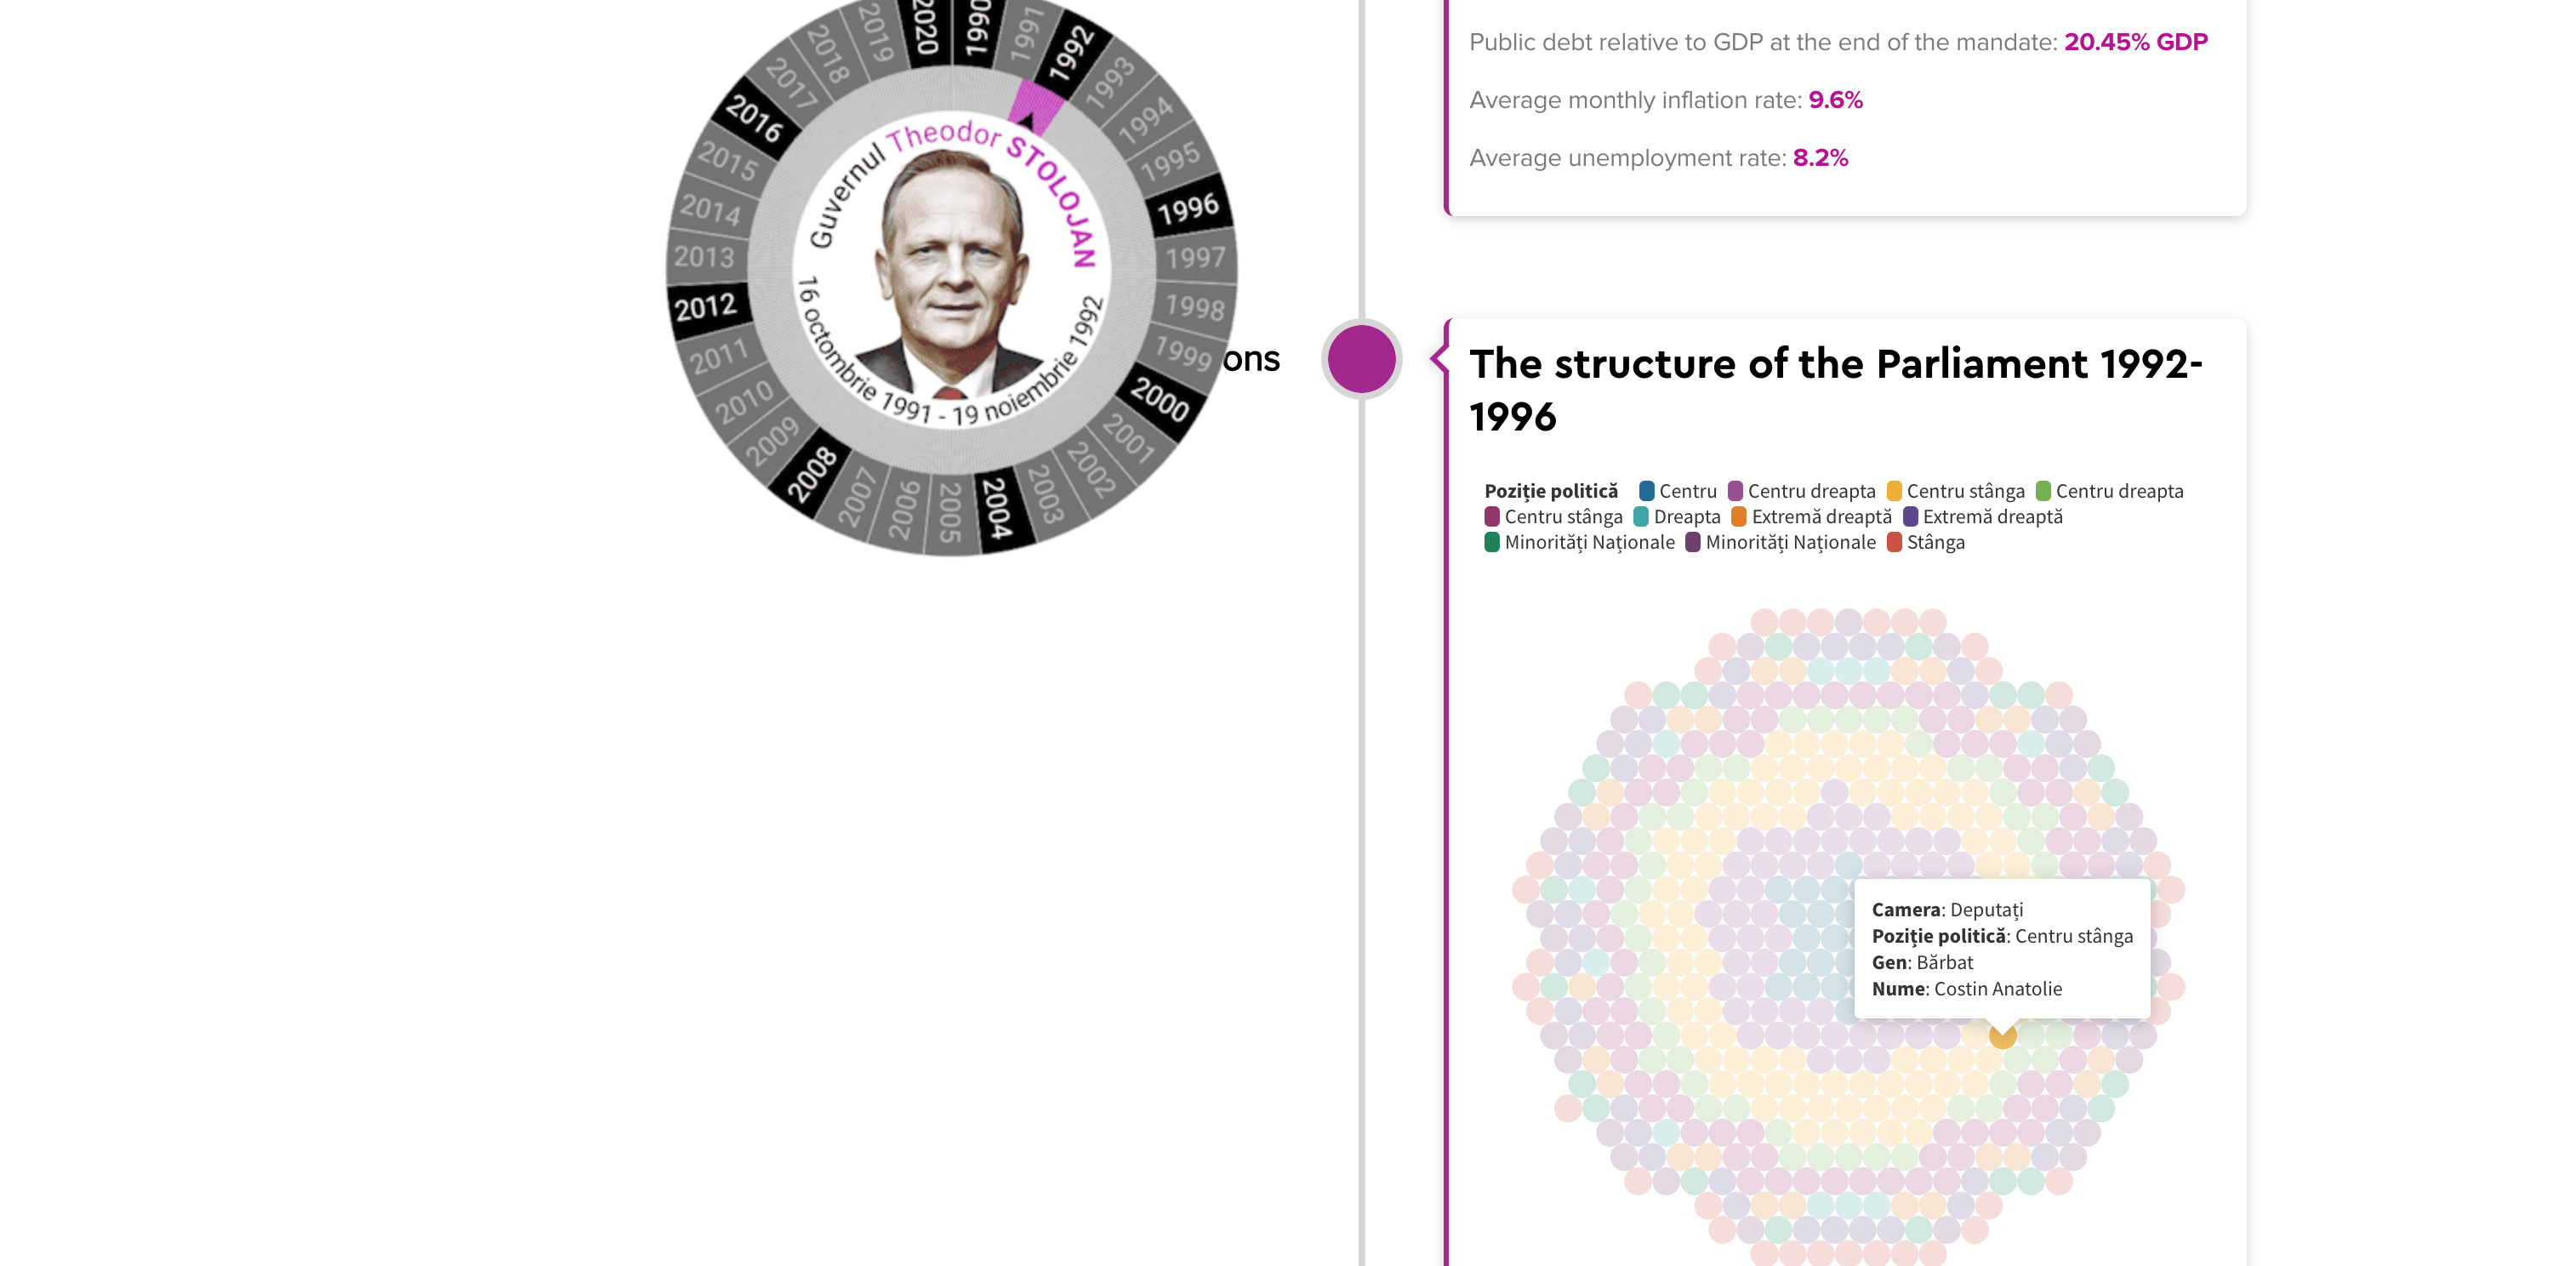
Political History of Romania
Panorama
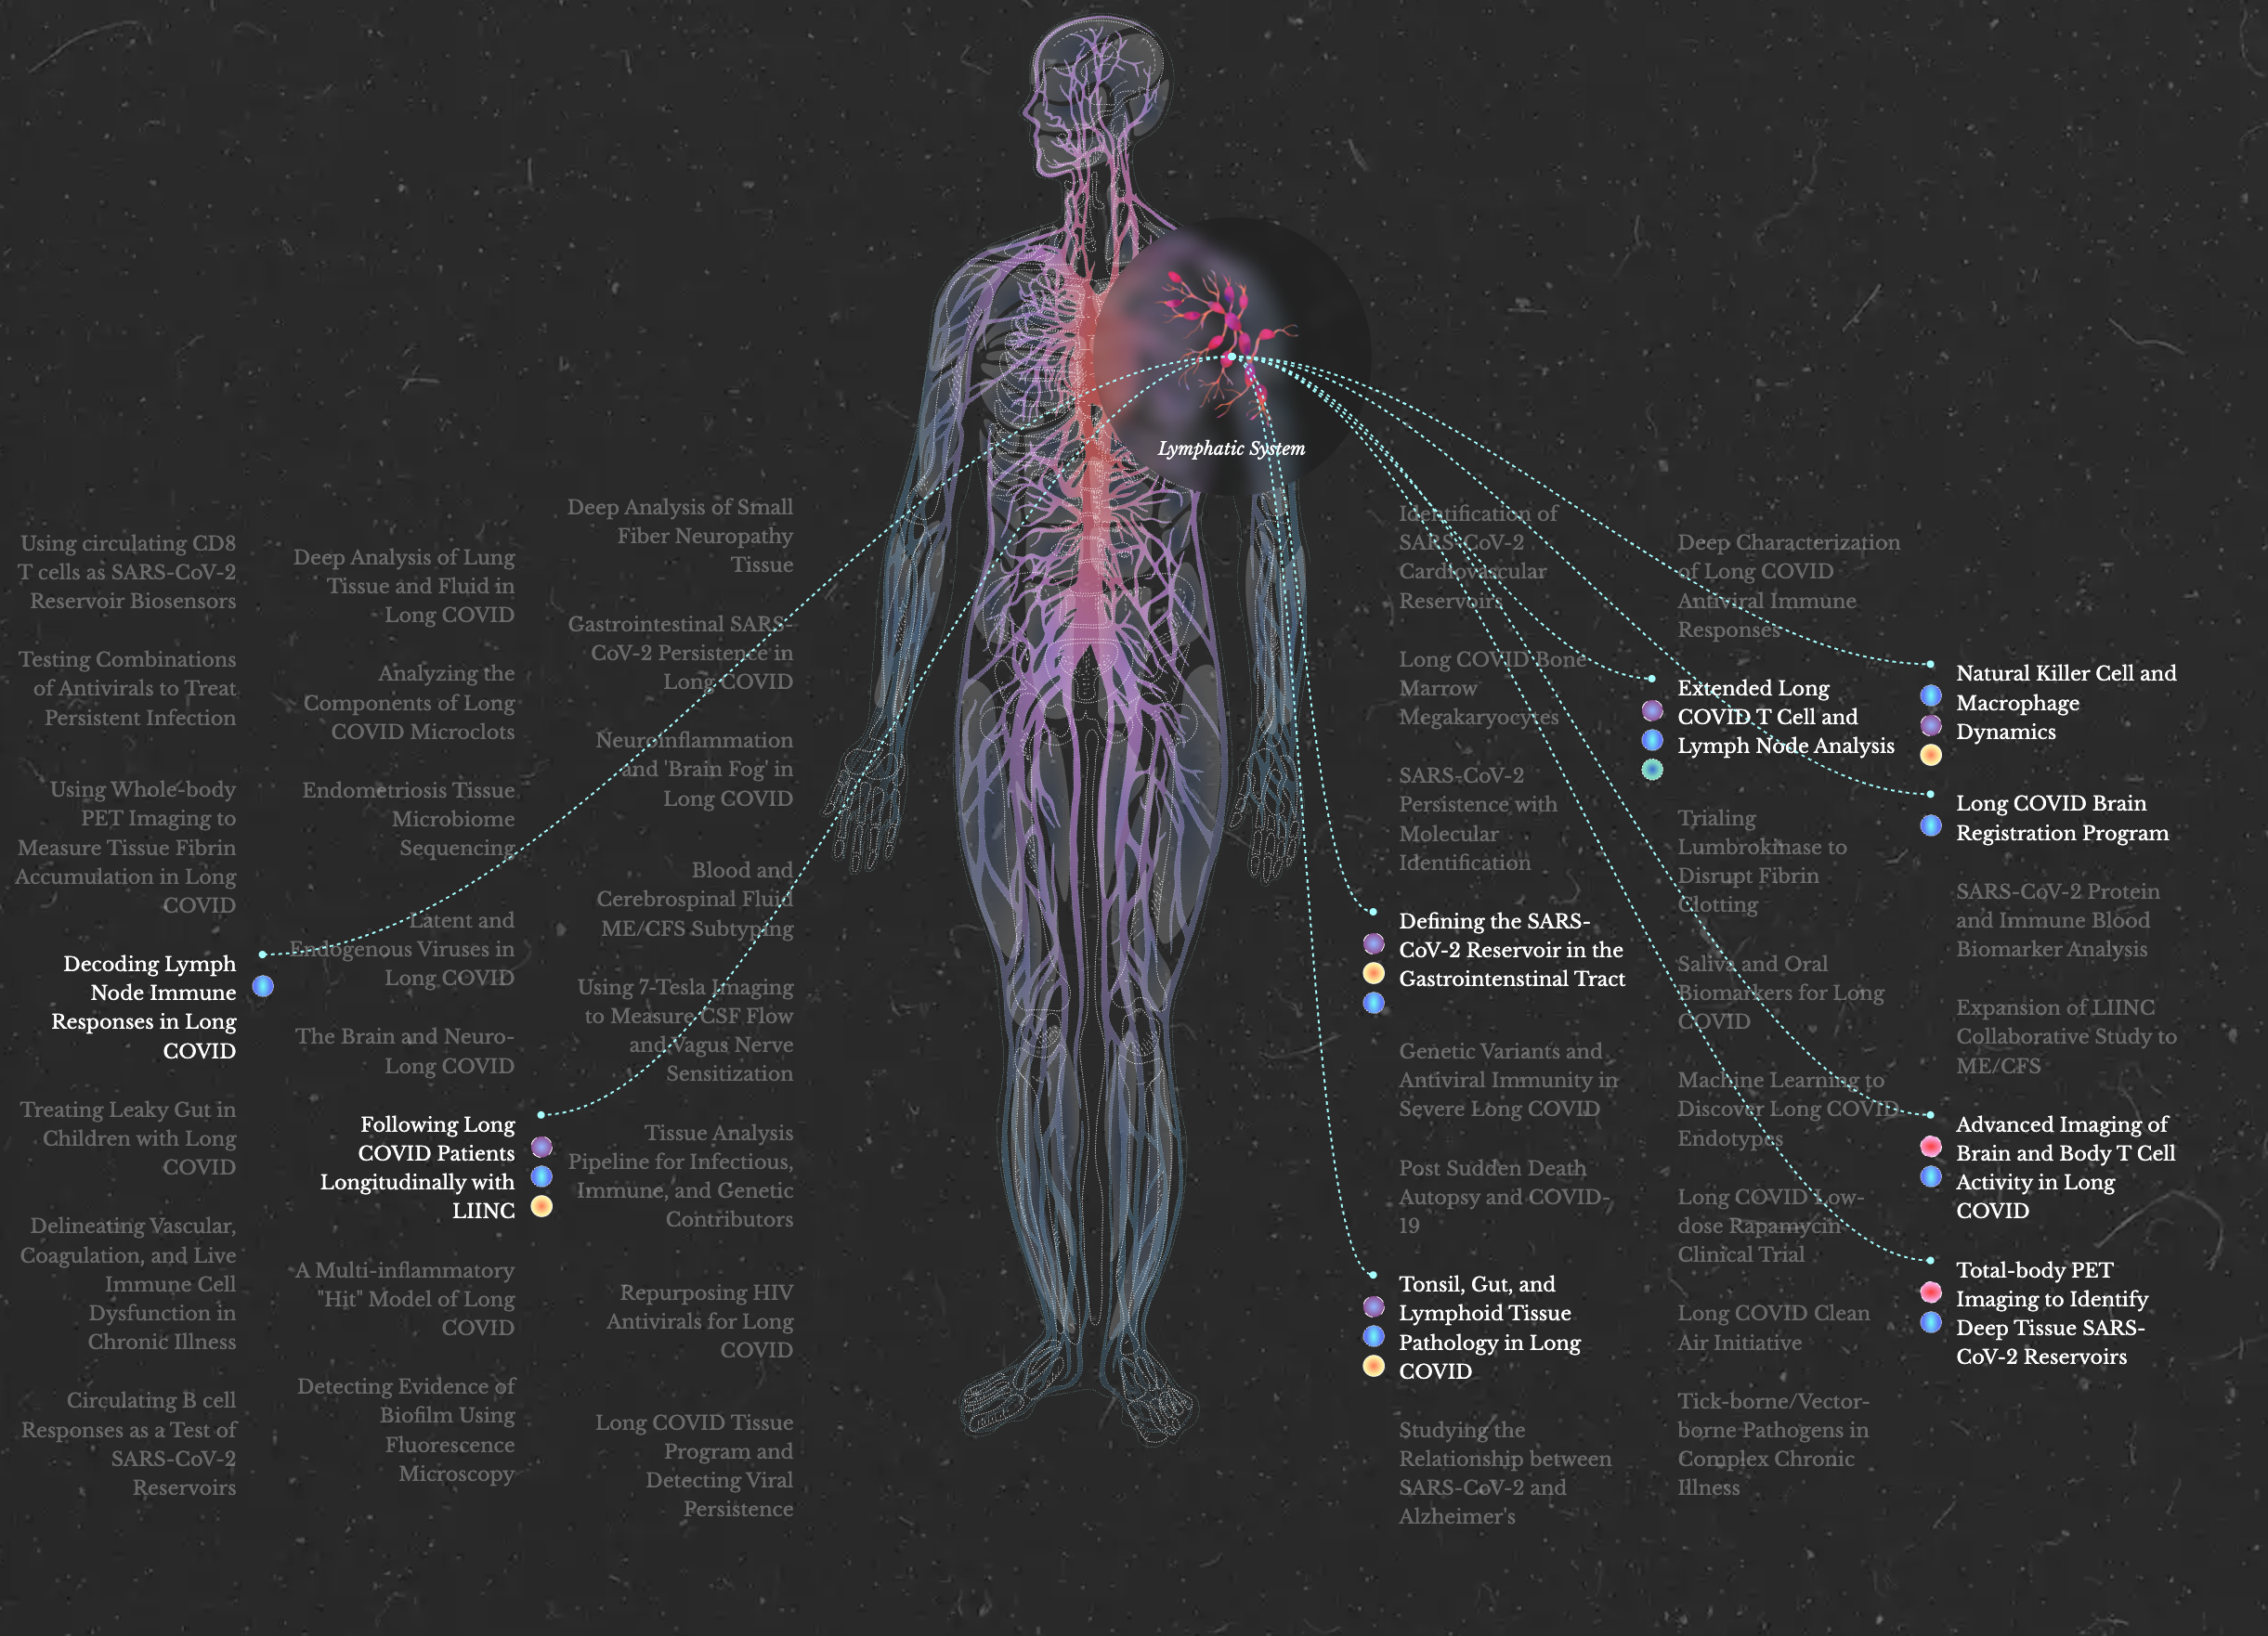
PolyBio Research Foundation
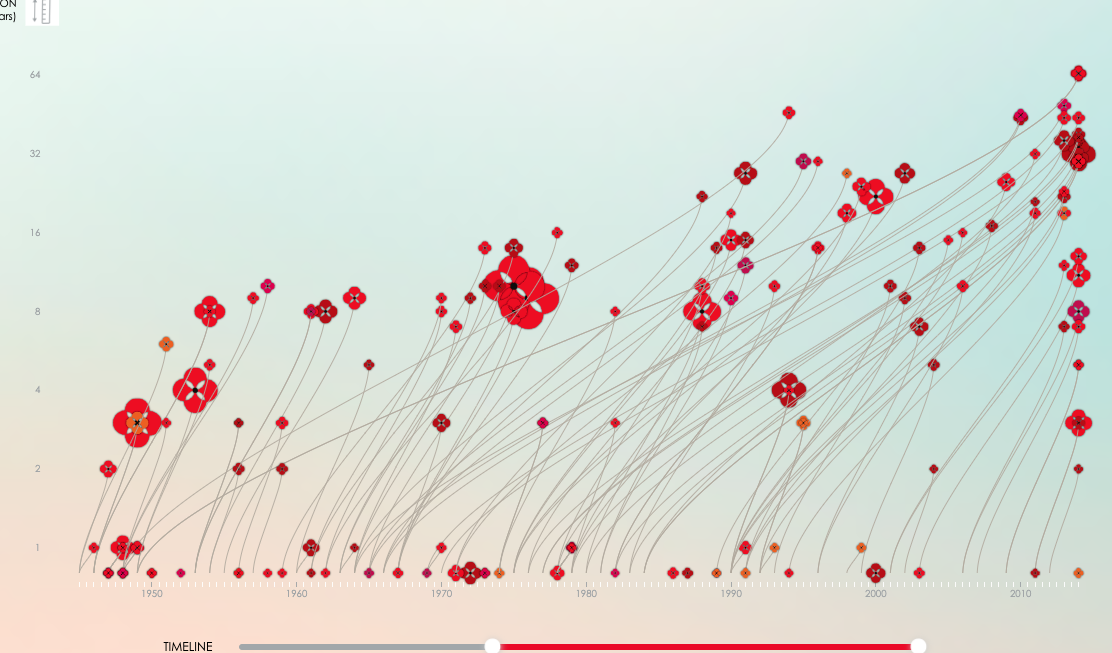
Poppy Field
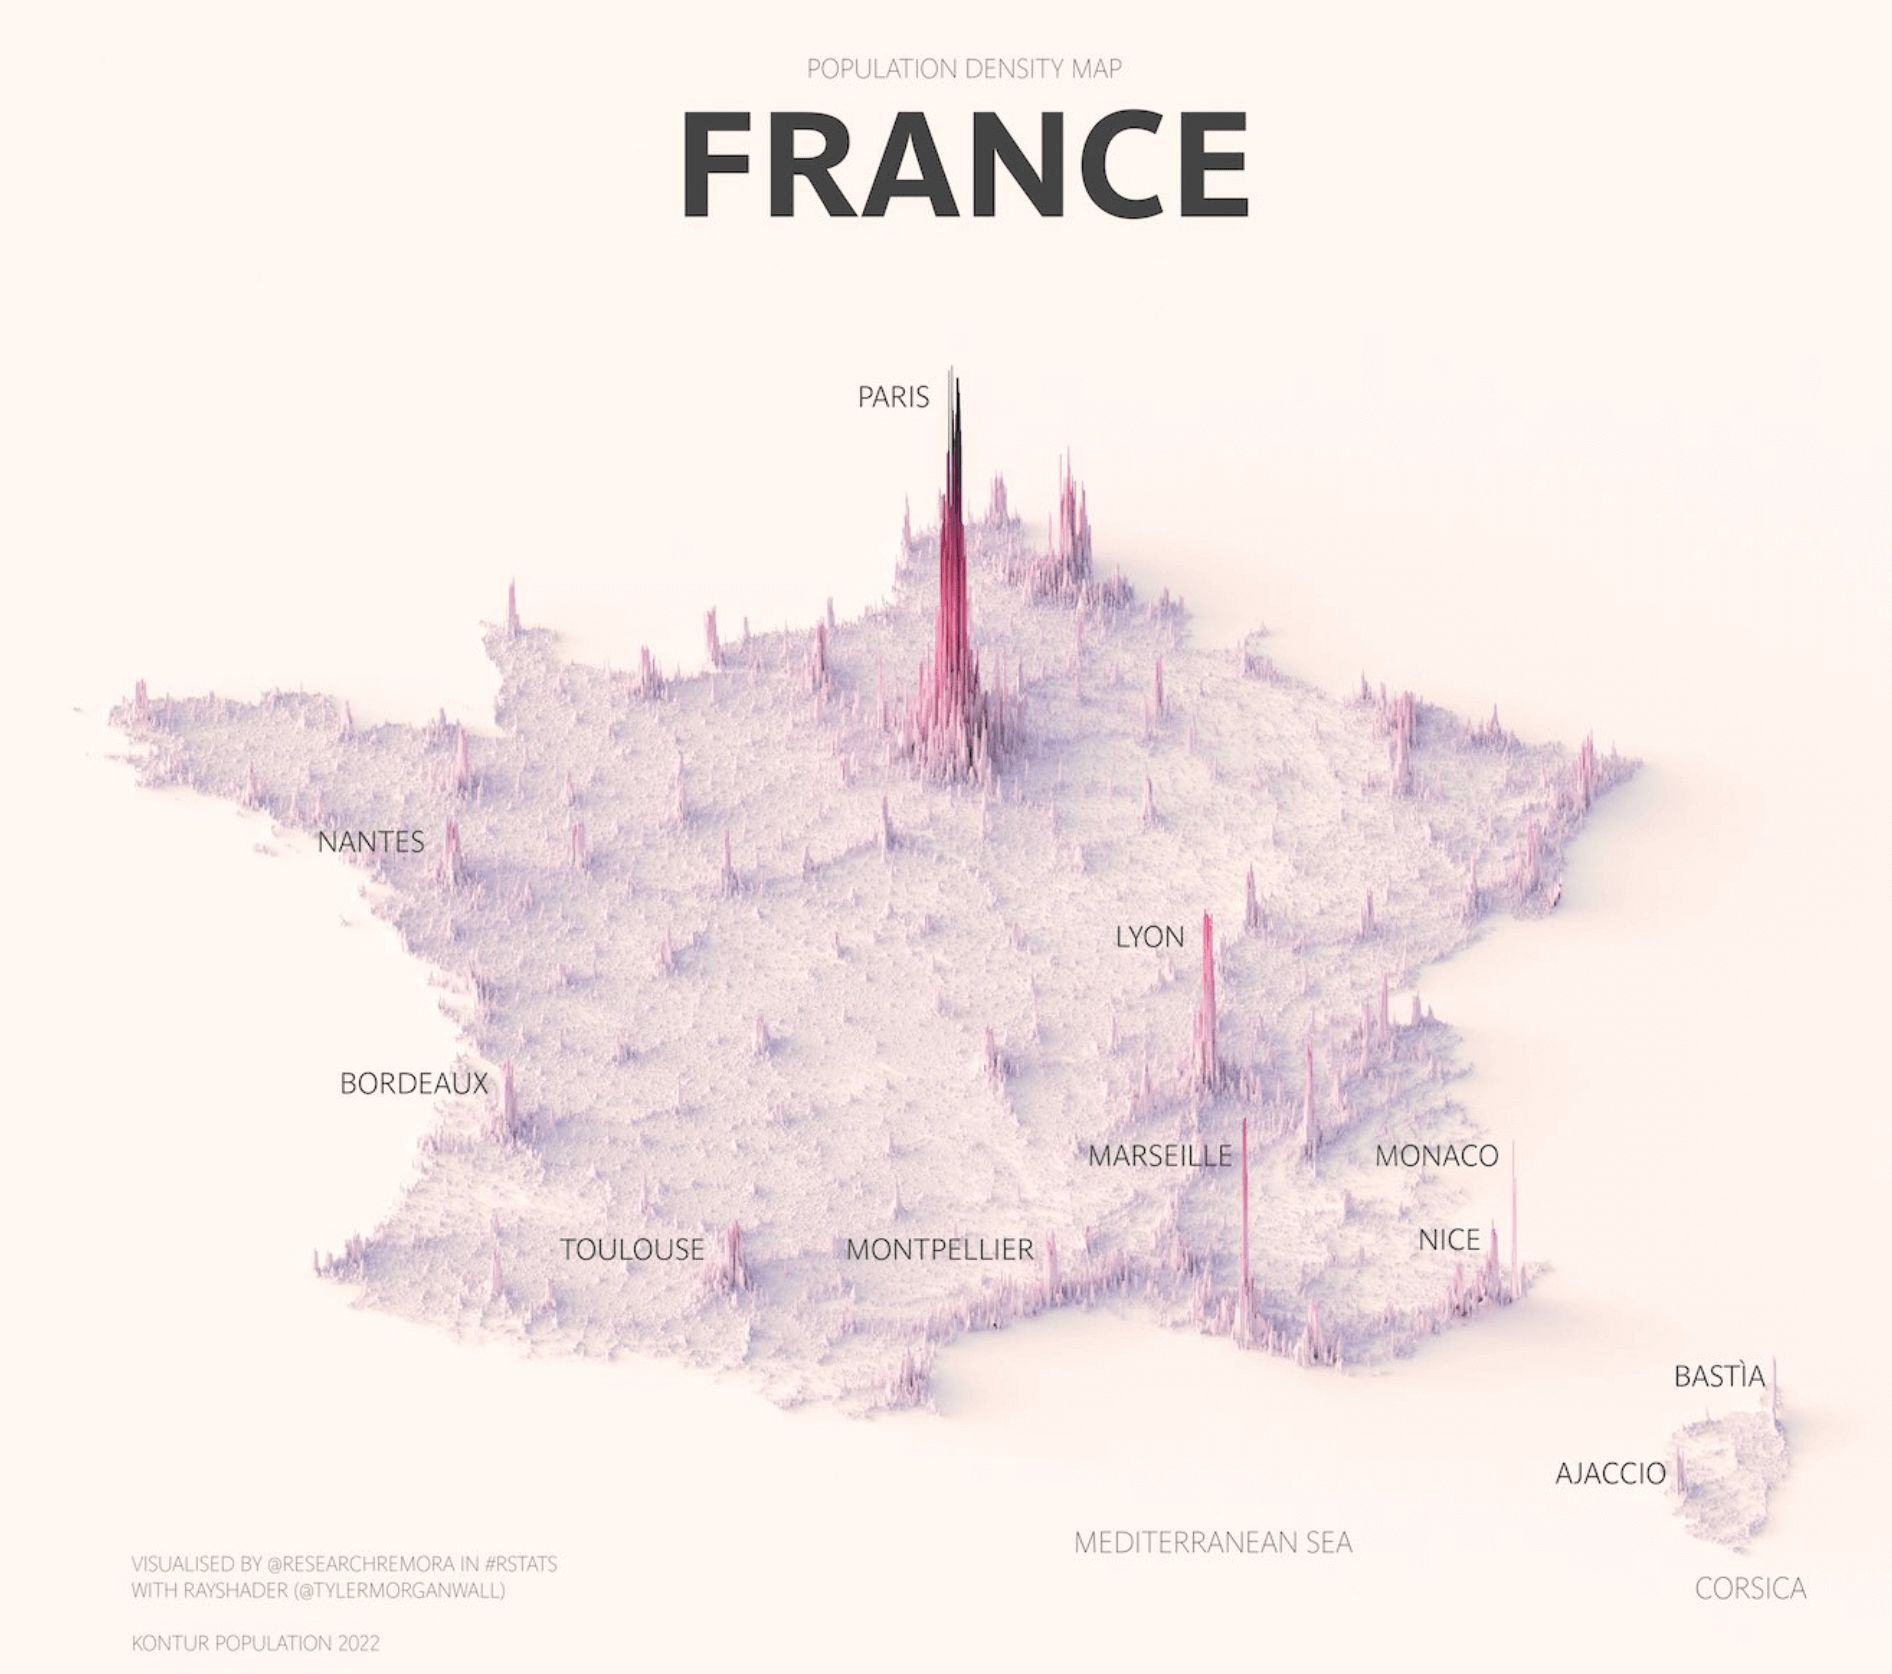
Population Density Maps
Unknown
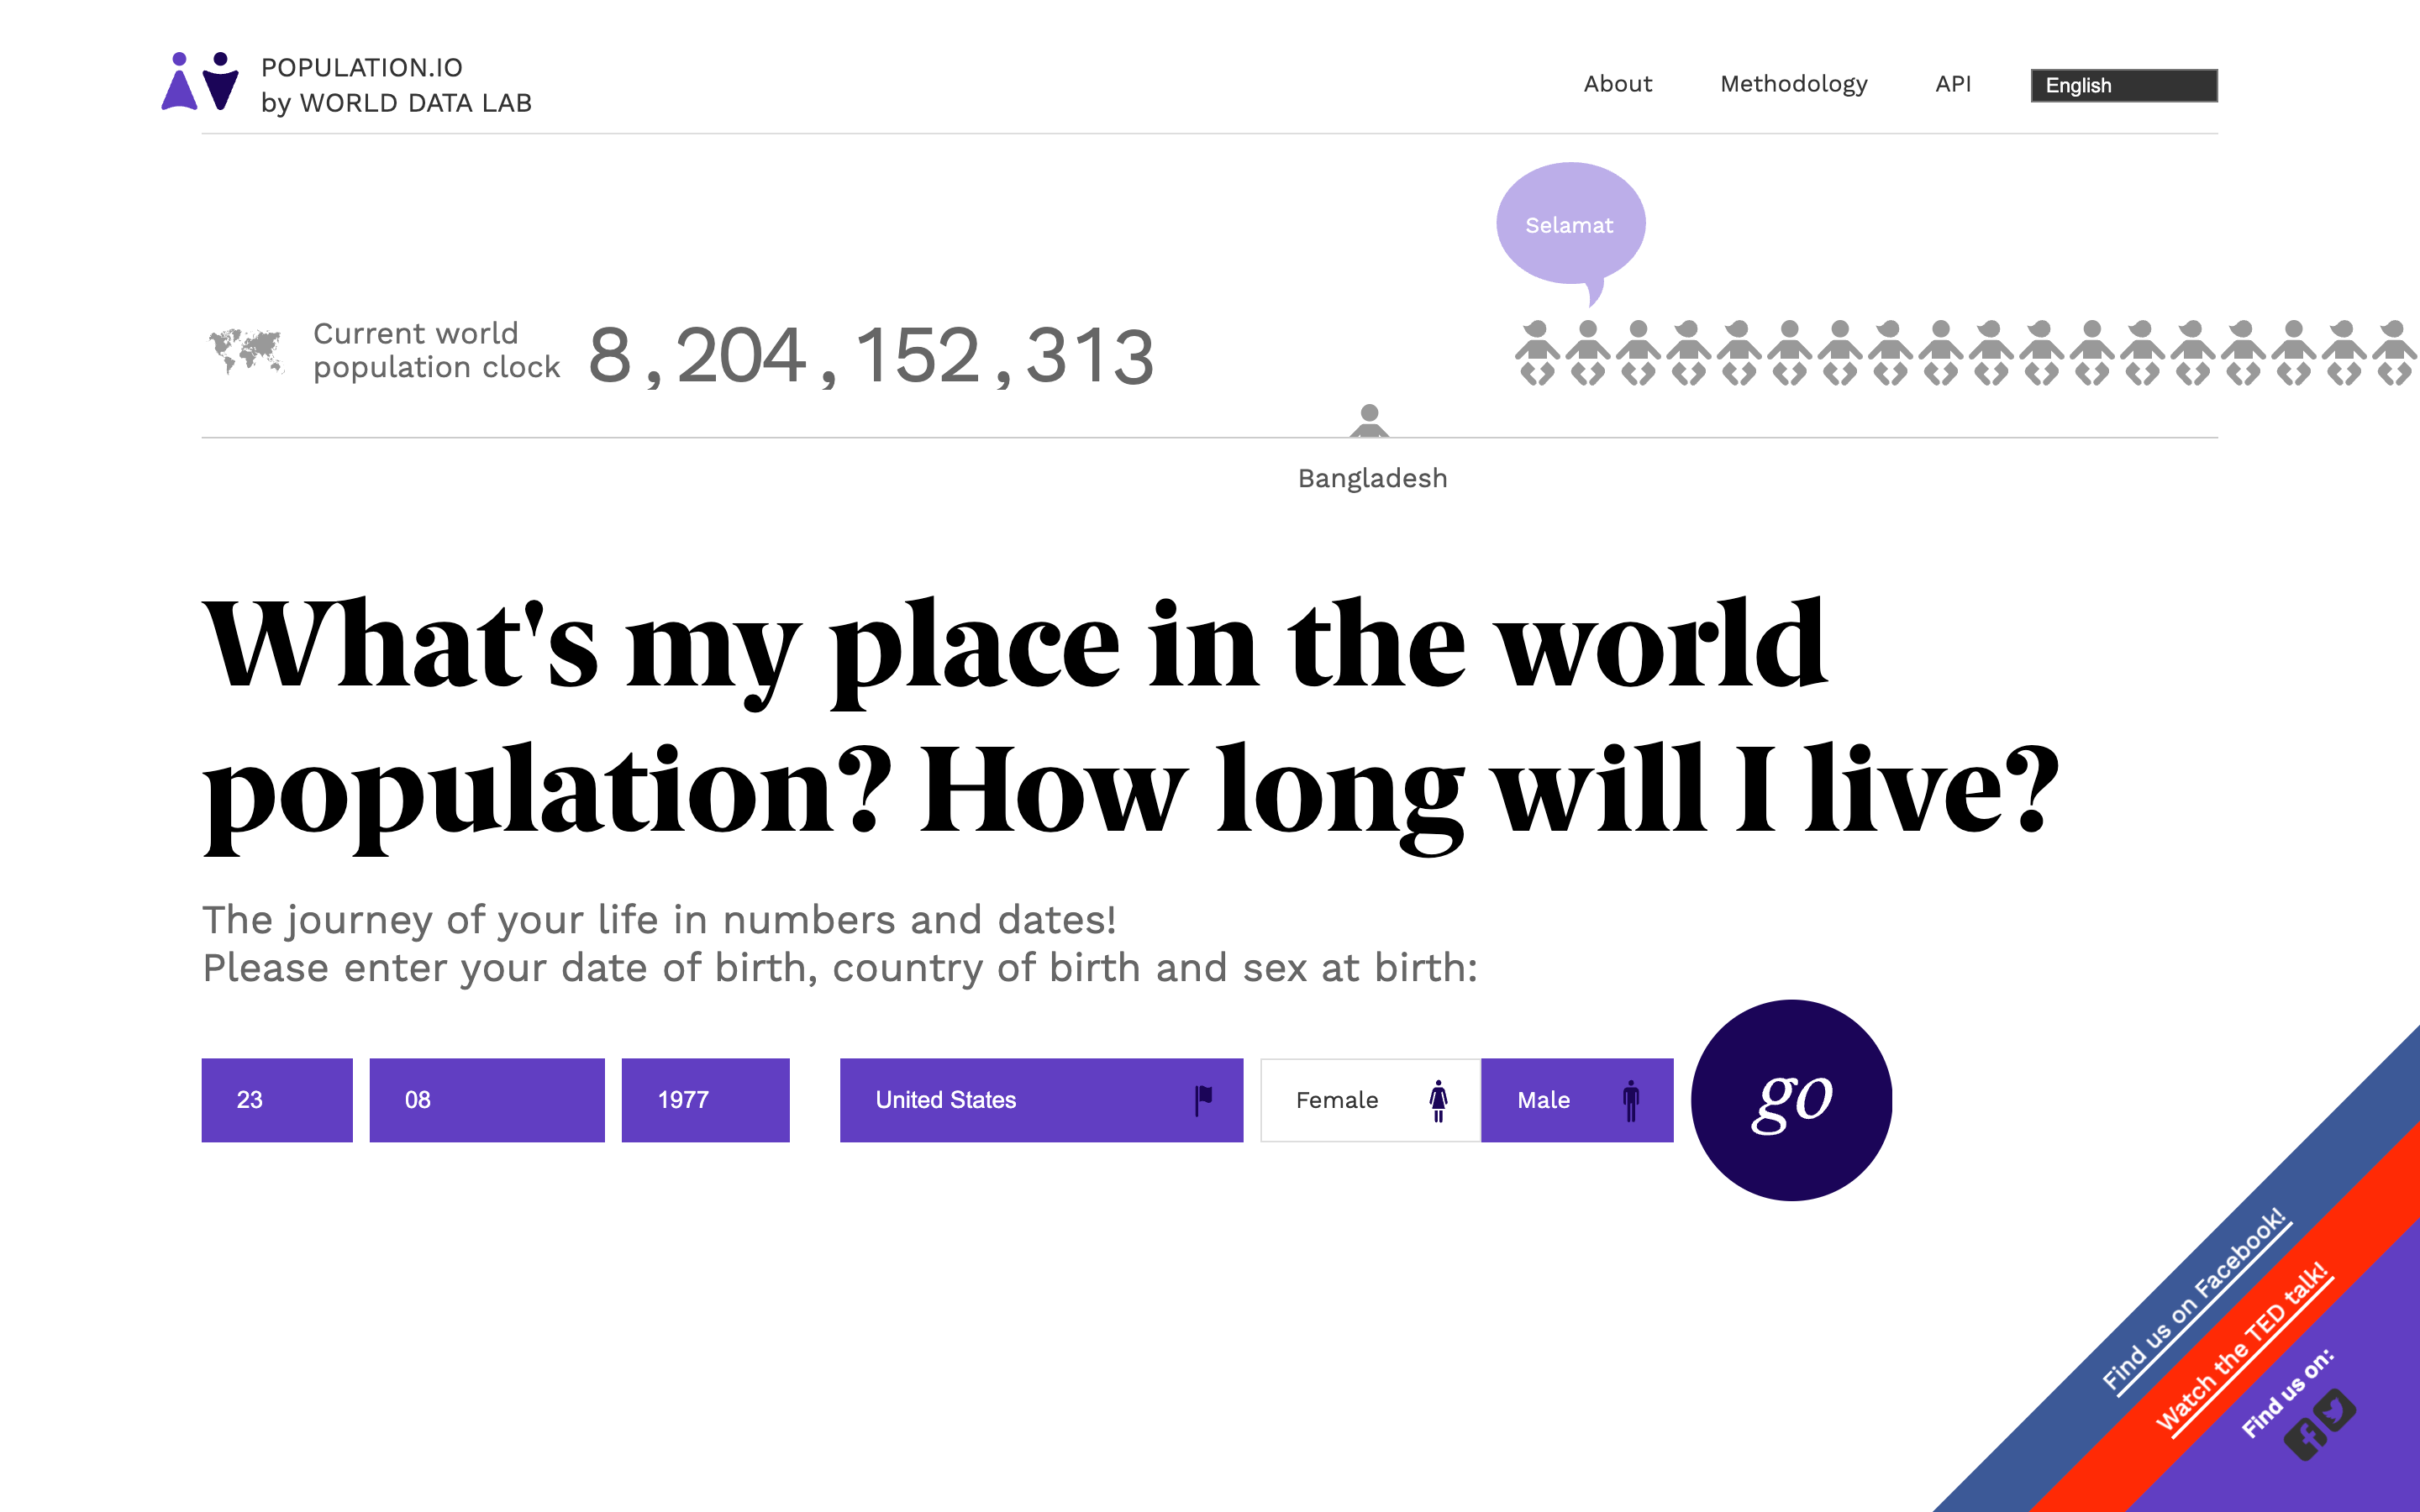
Population.io
World Data Lab
Post.Design
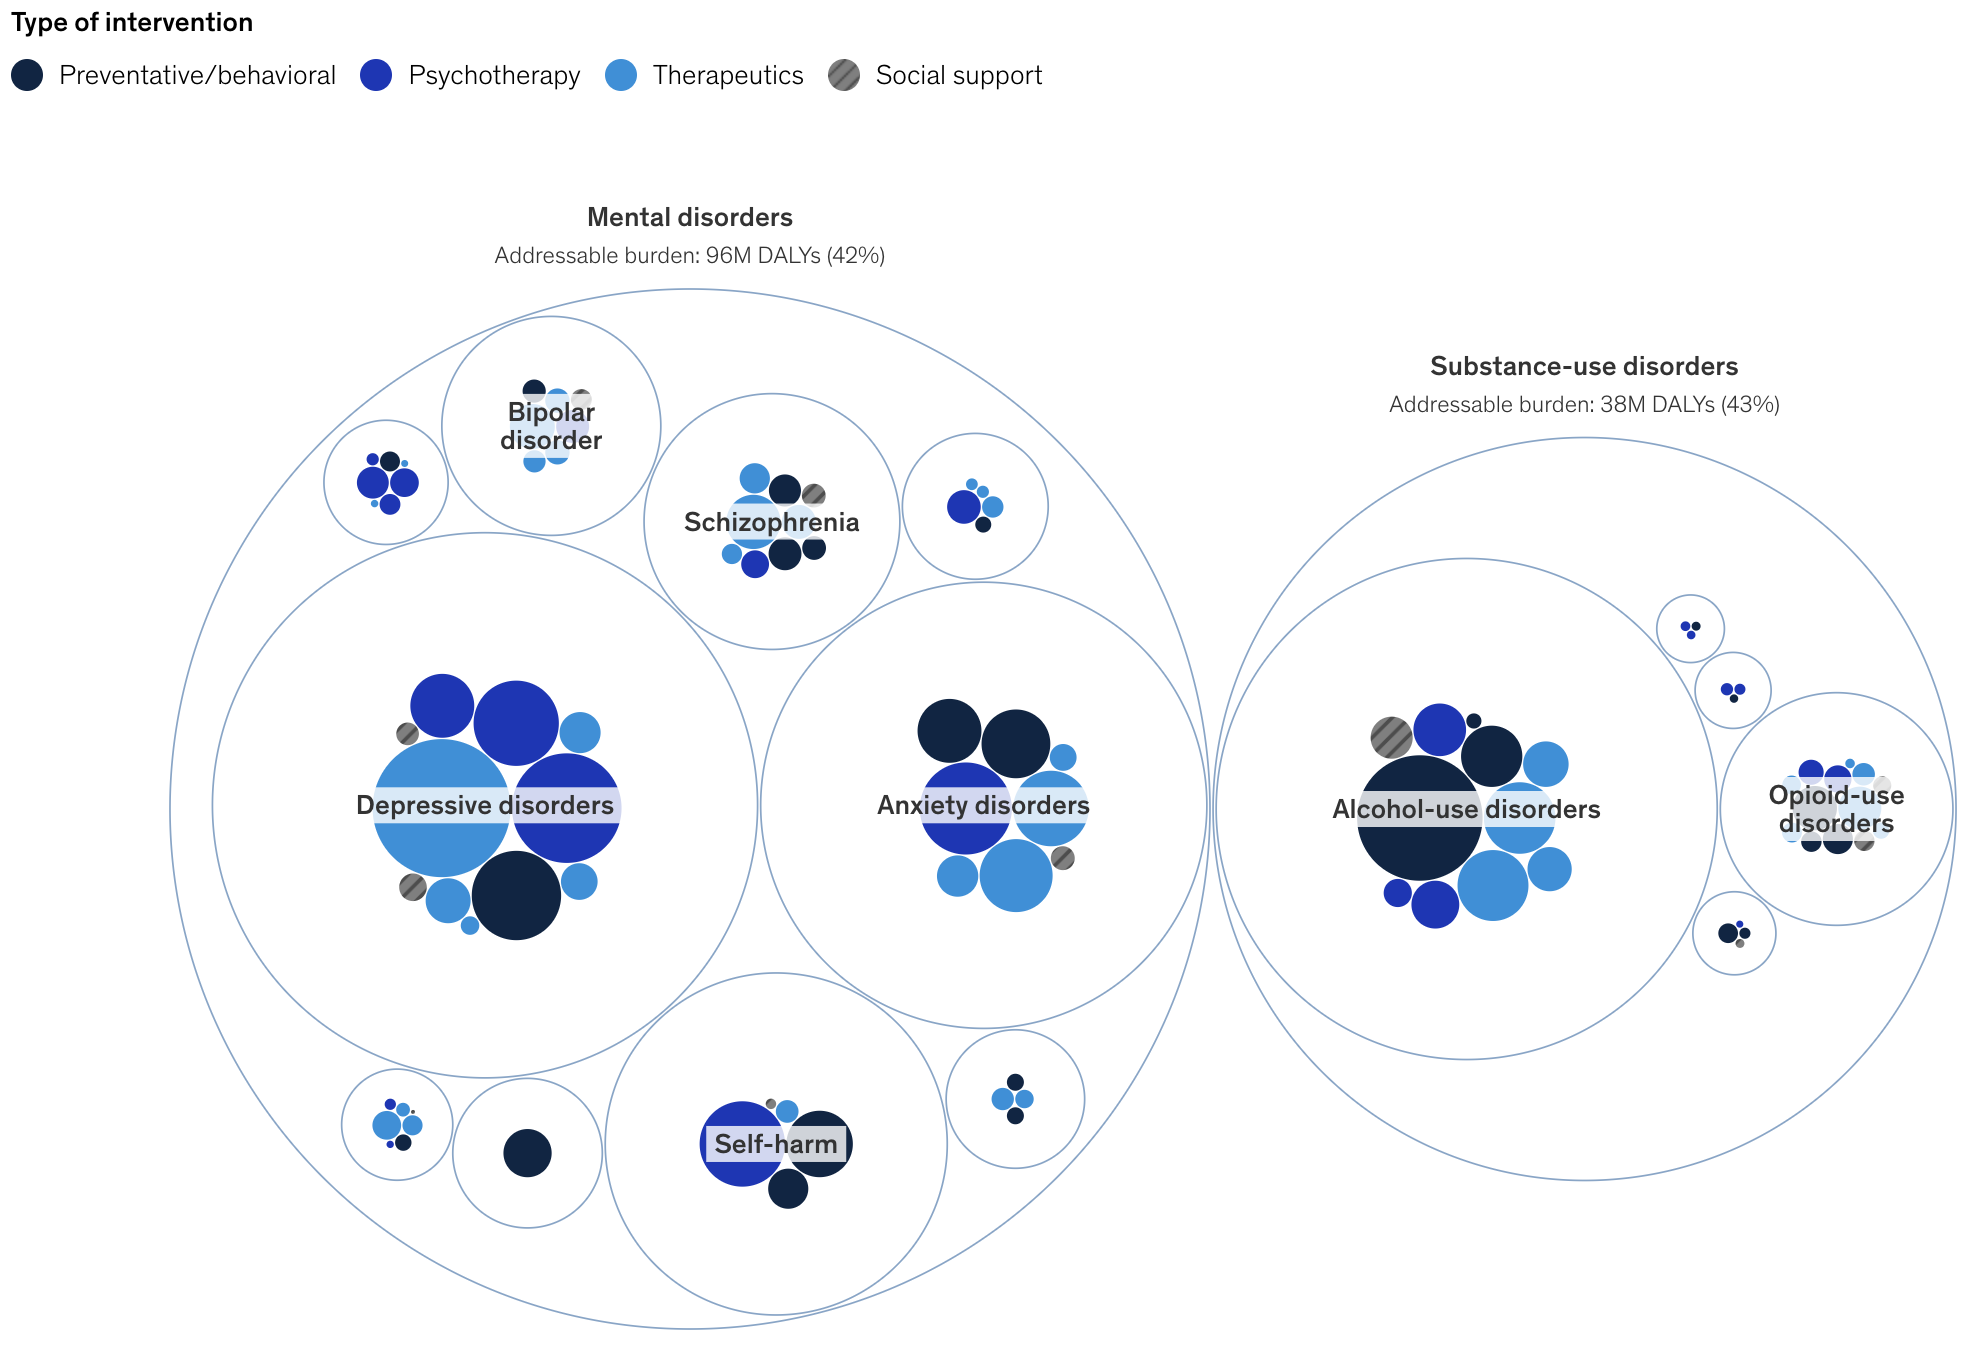
Prioritizing Brain Health: Scaling What Works to Add Years to Life and Life to Years
McKinsey
Prioritizing Gender Equality Can Help US Build Back Stronger from COVID-19., Gates Foundation
Gates Foundation
Privacy Preserving Proximity Tracing
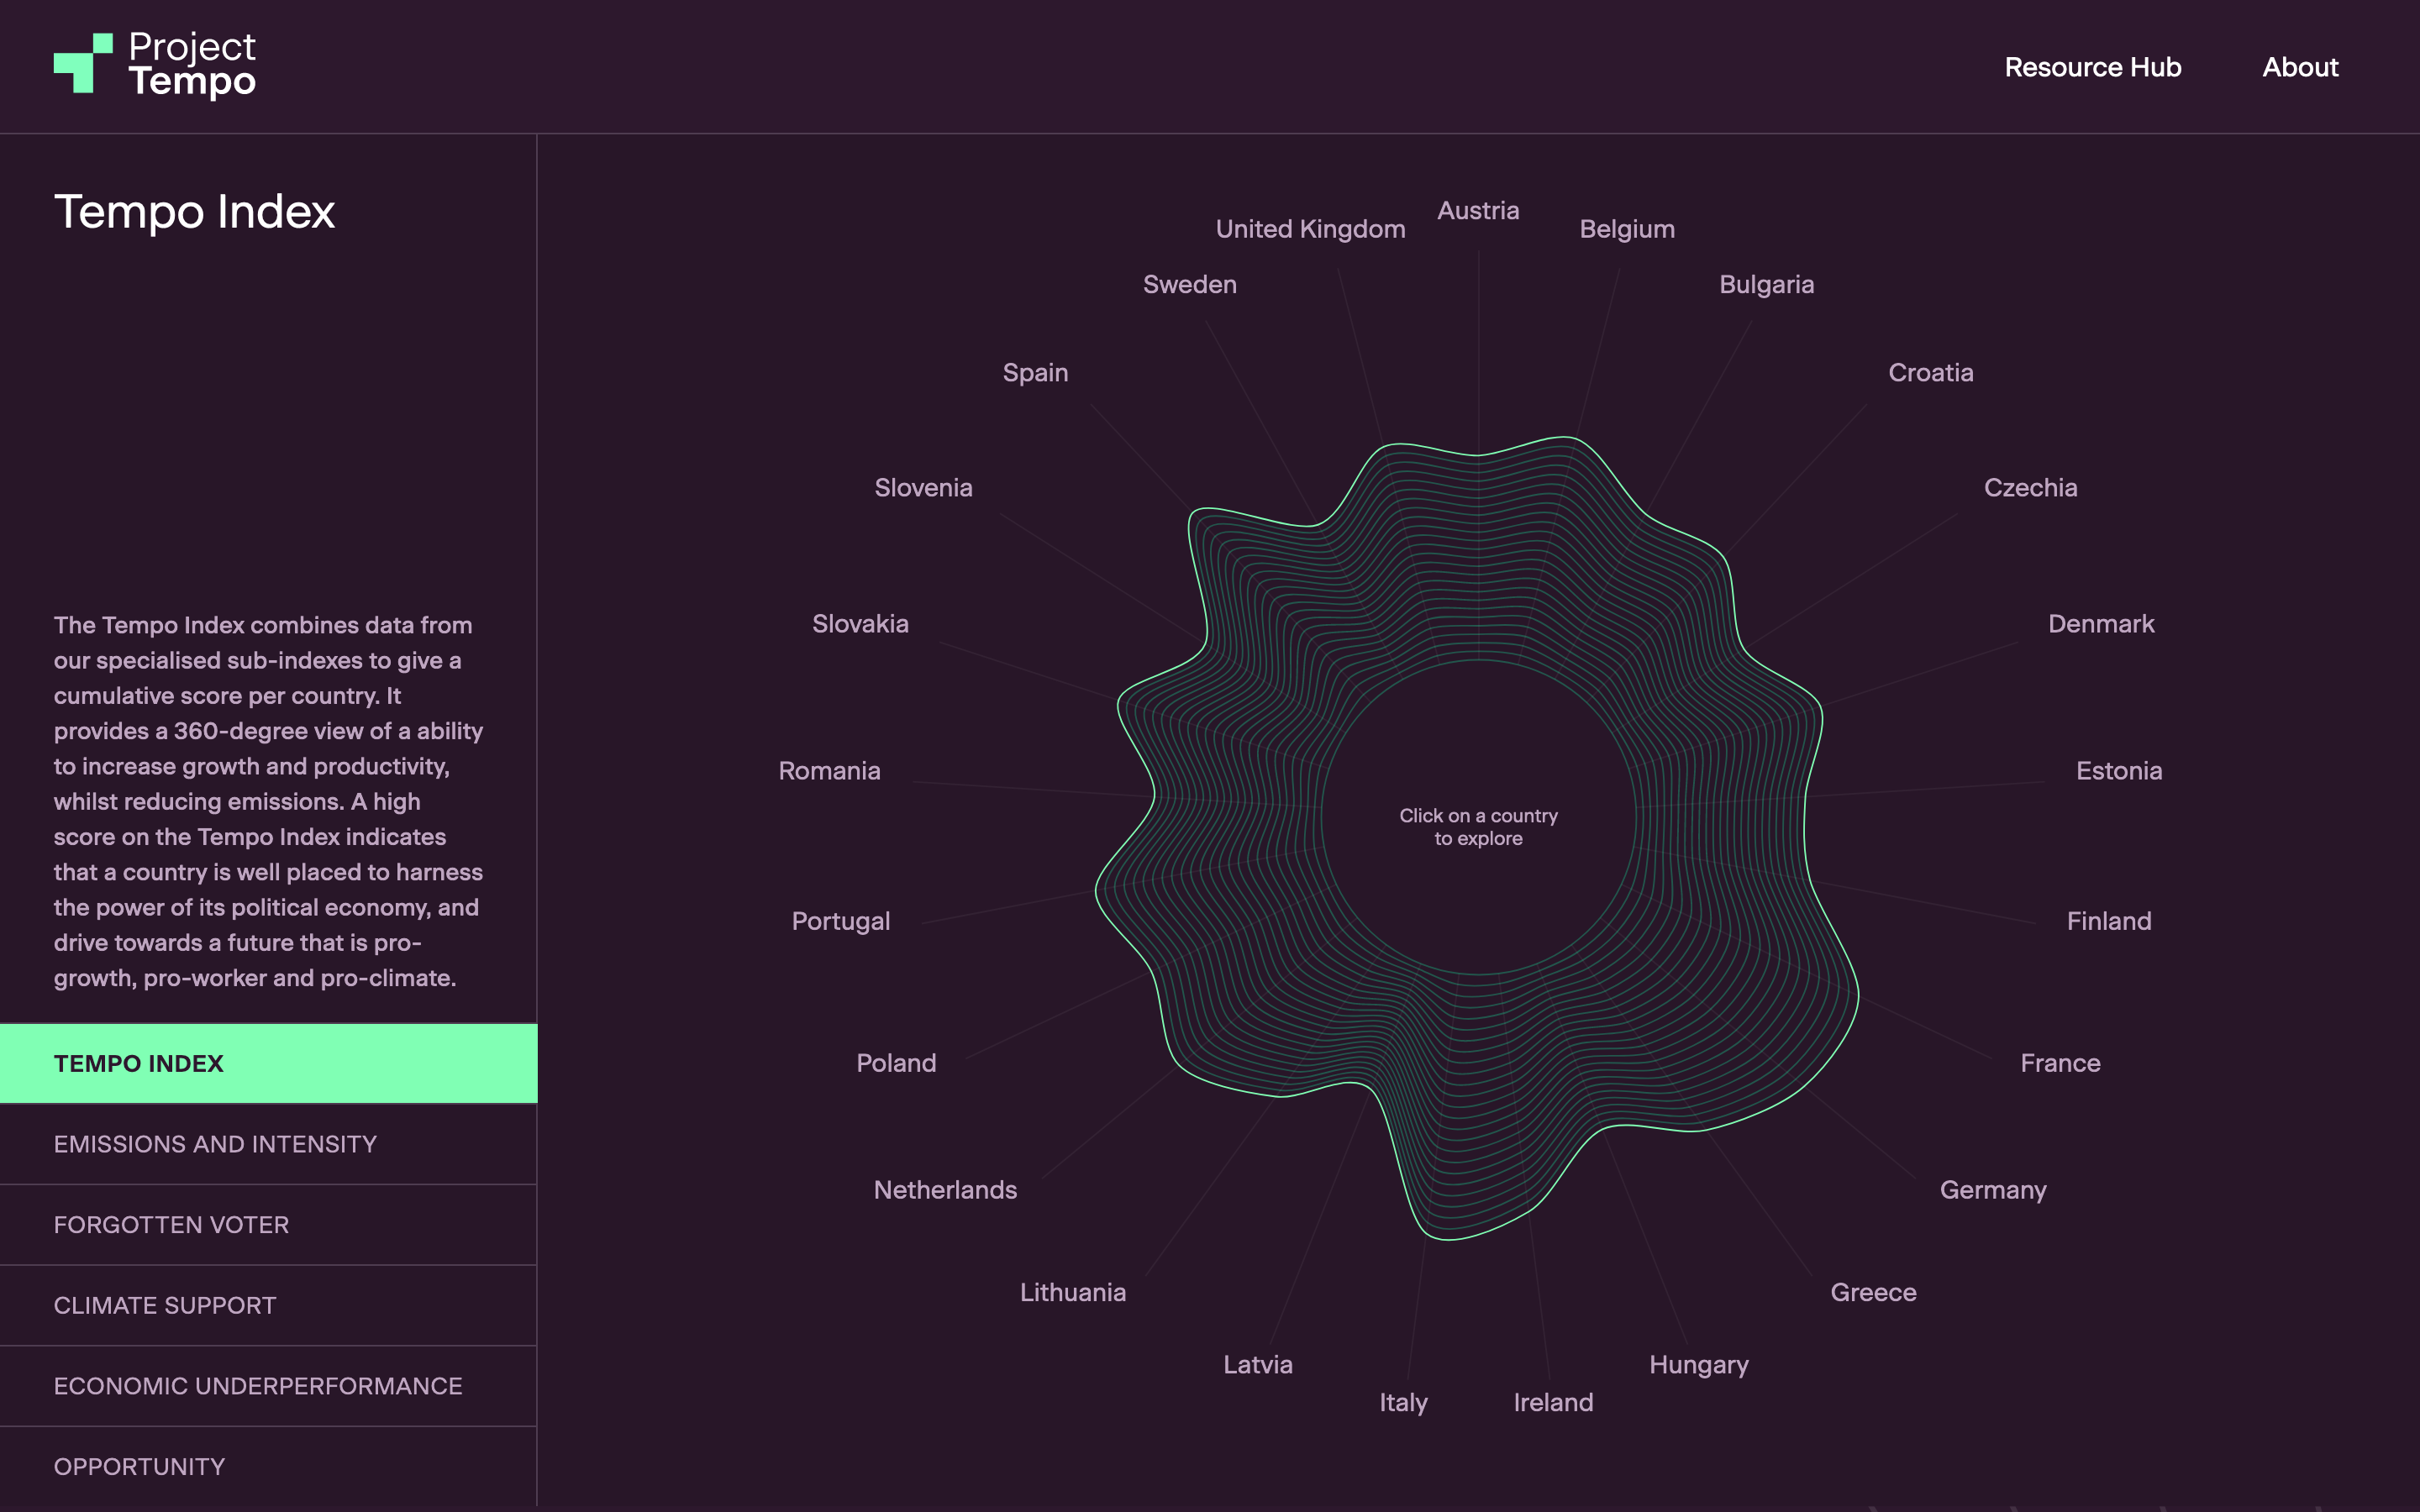
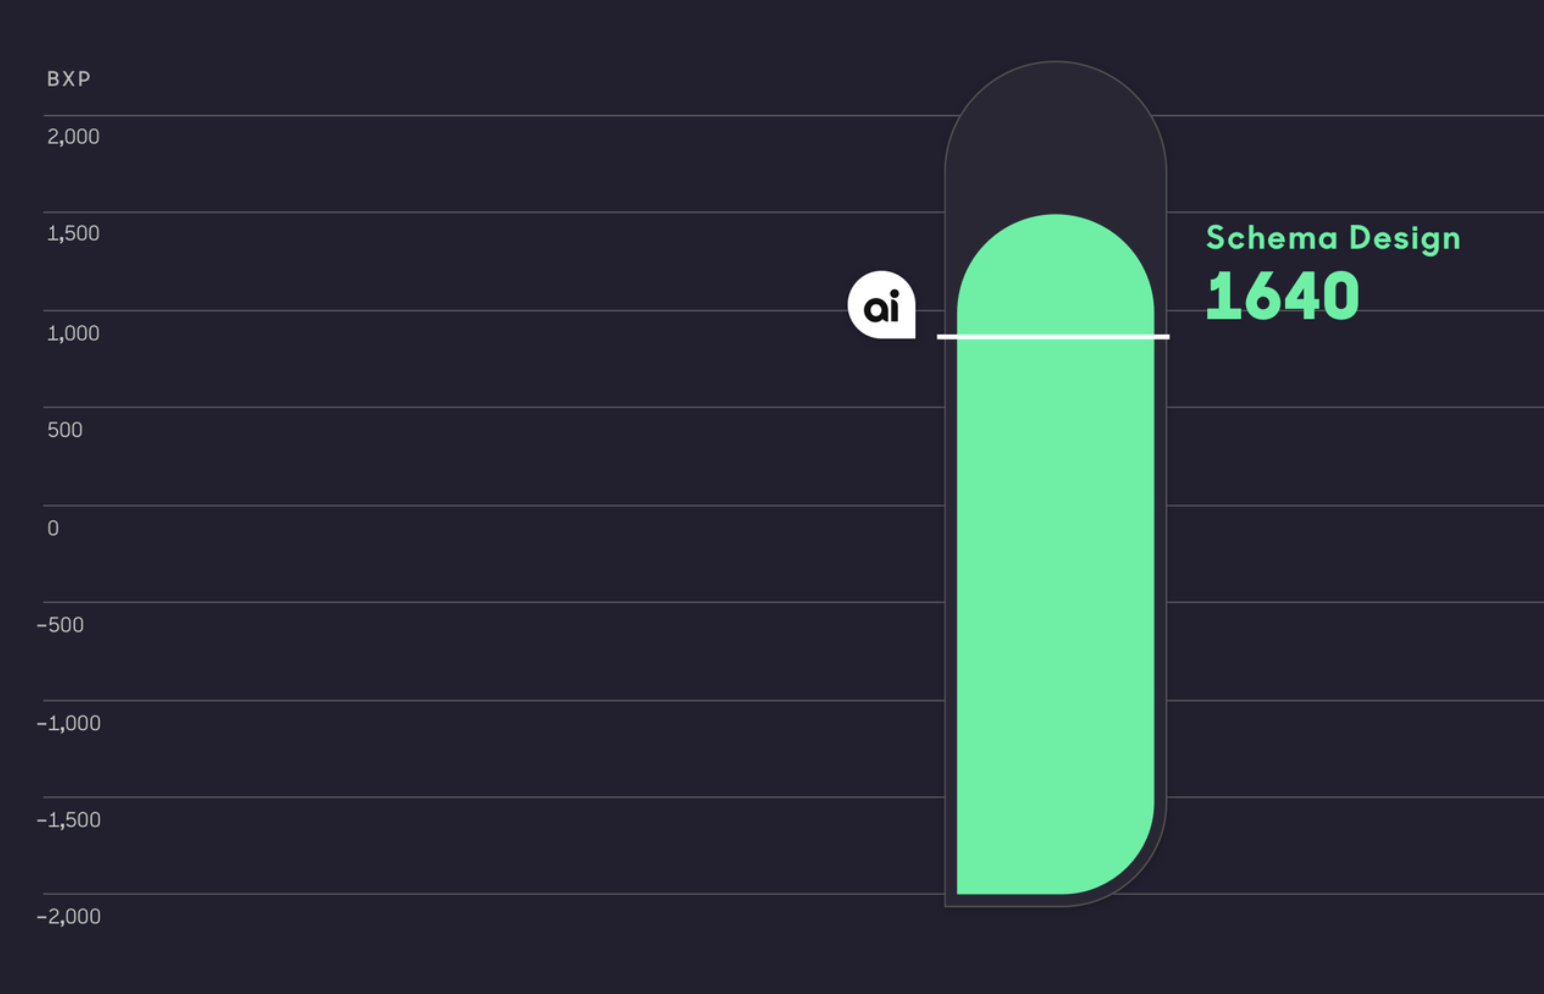
Project Tempo
Schema Design
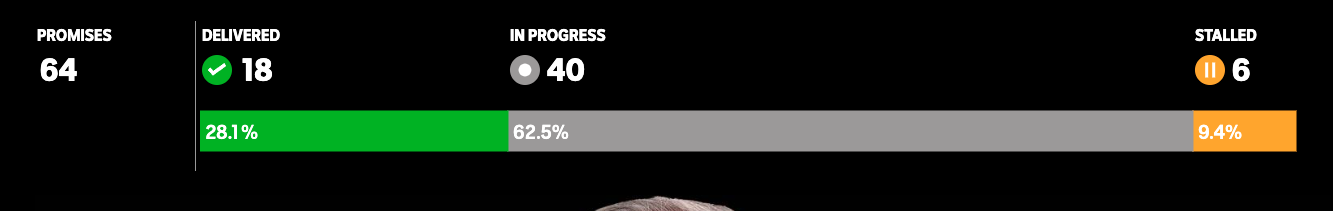
Promise Tracker
ABC News
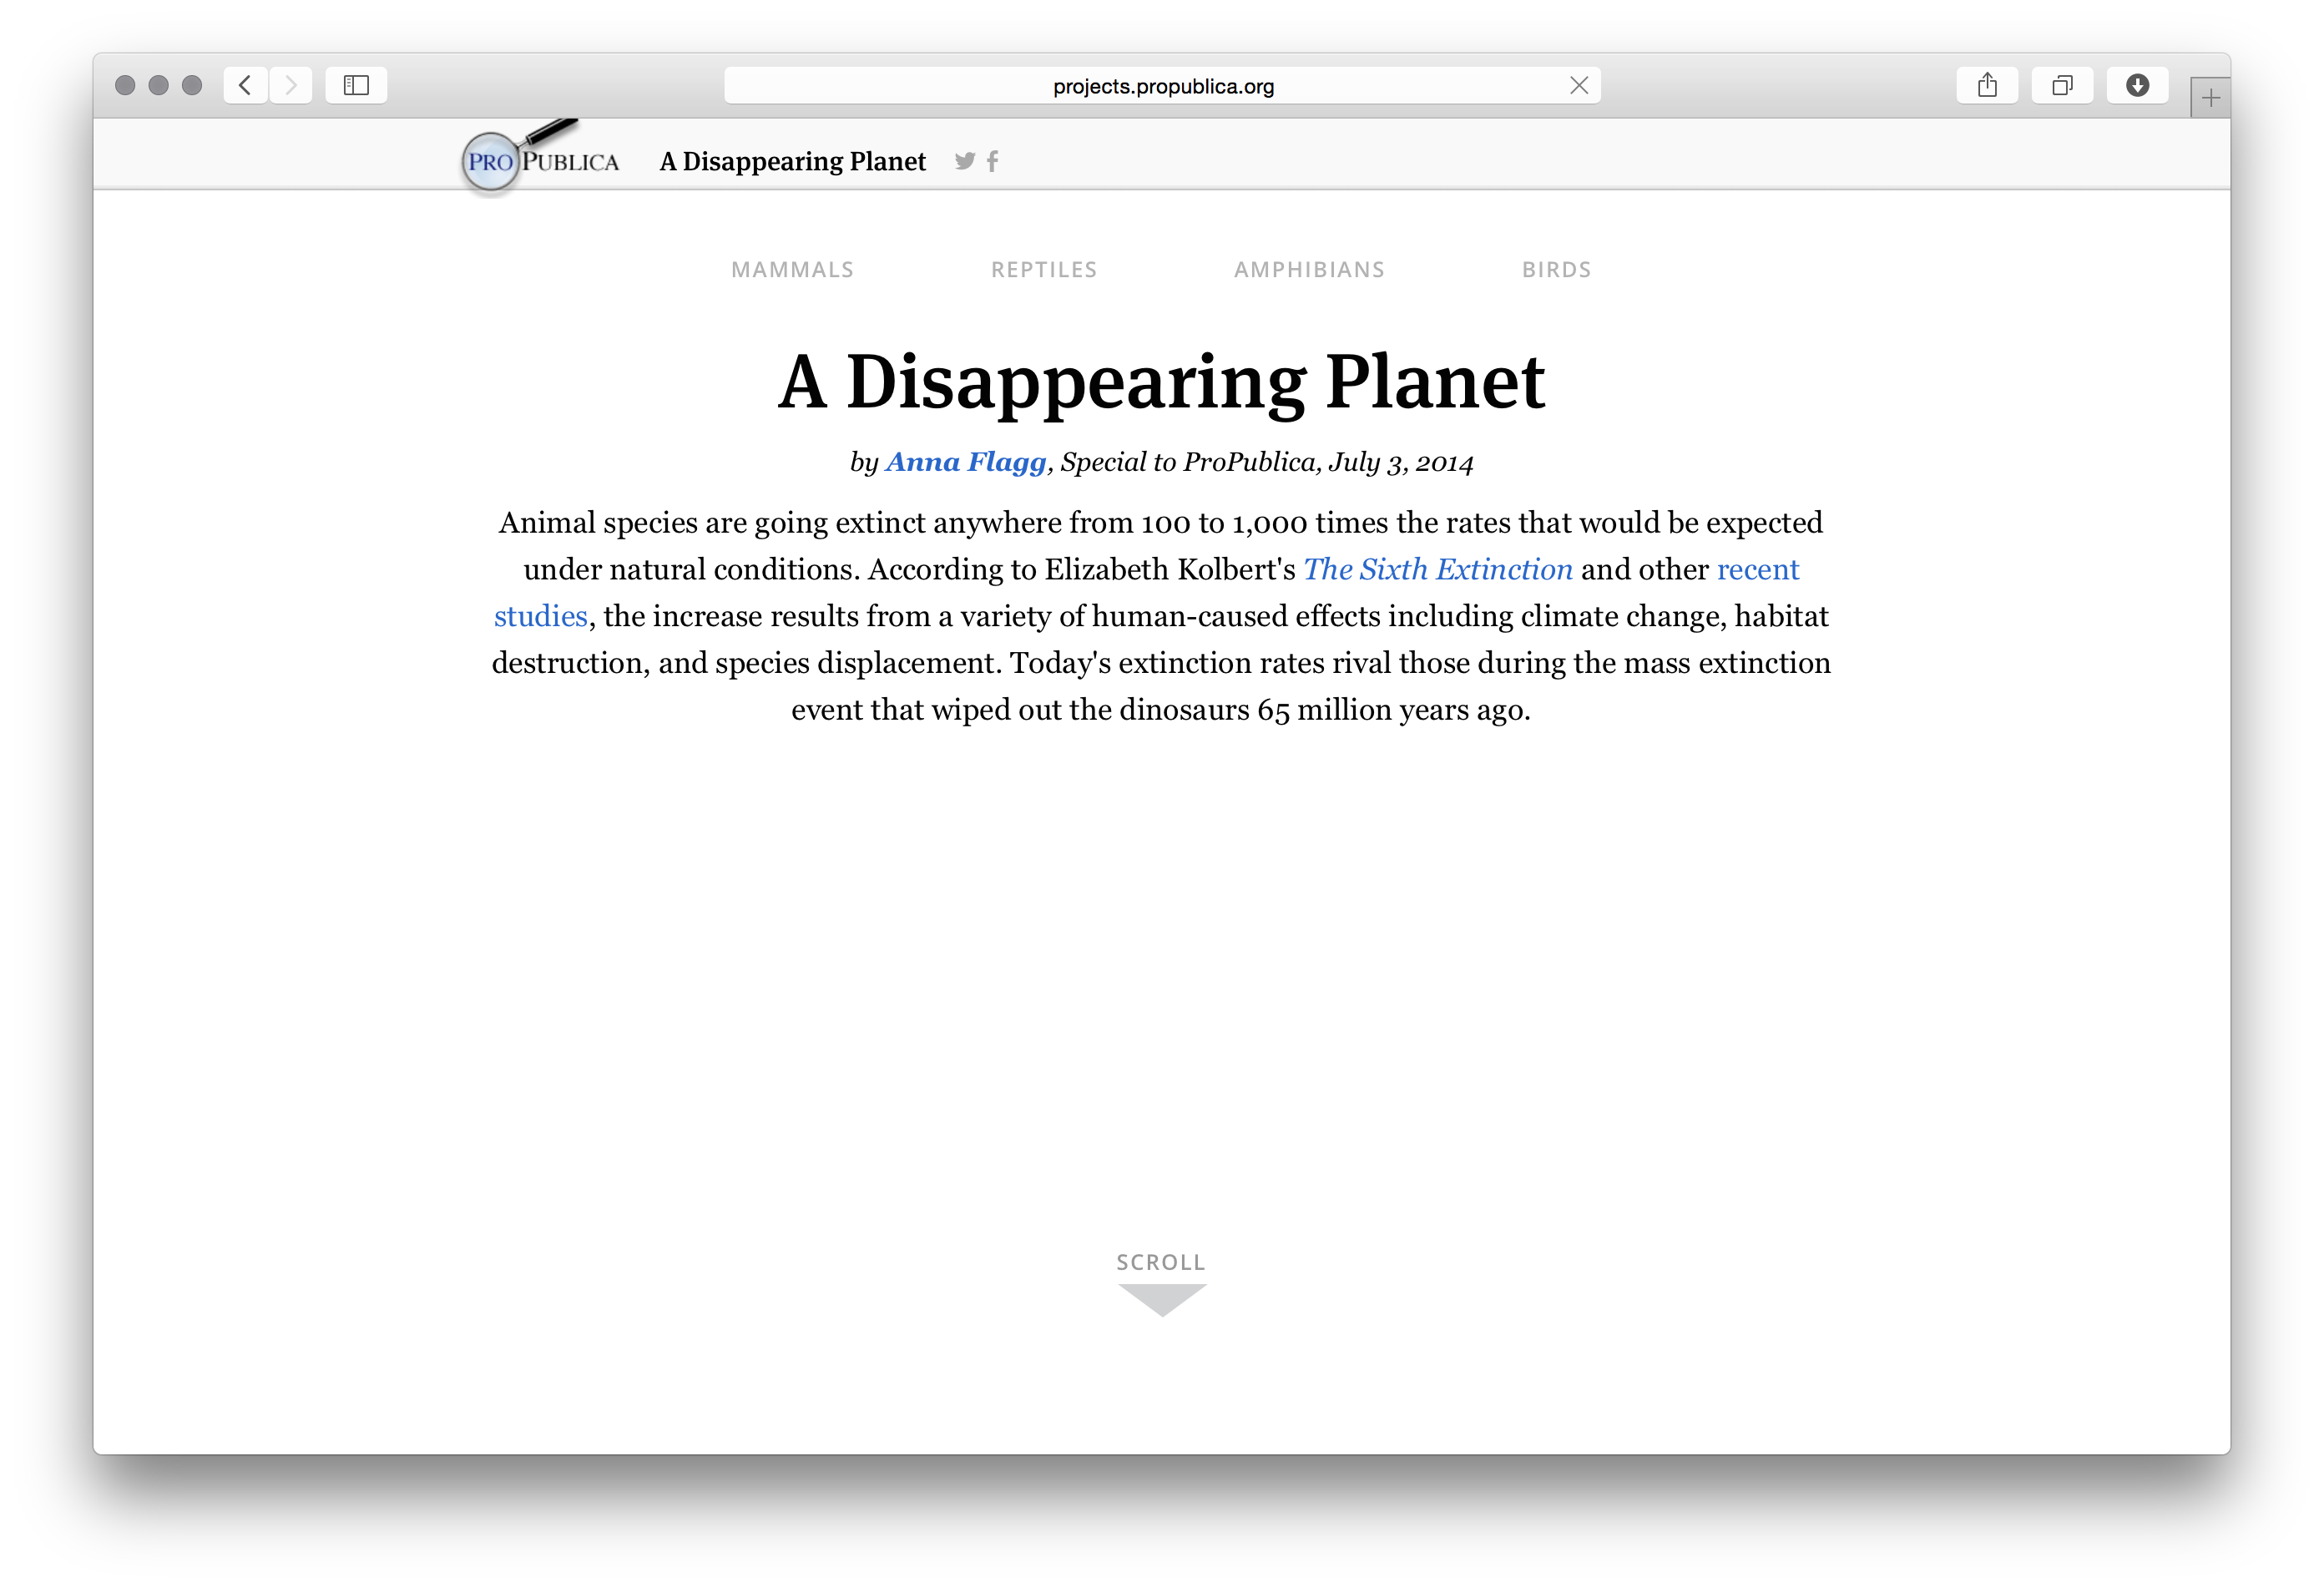
ProPublic DisappearingPlanet
ProPublica
ProQuo AI Visual Identity, Application, and Website
Schema Design
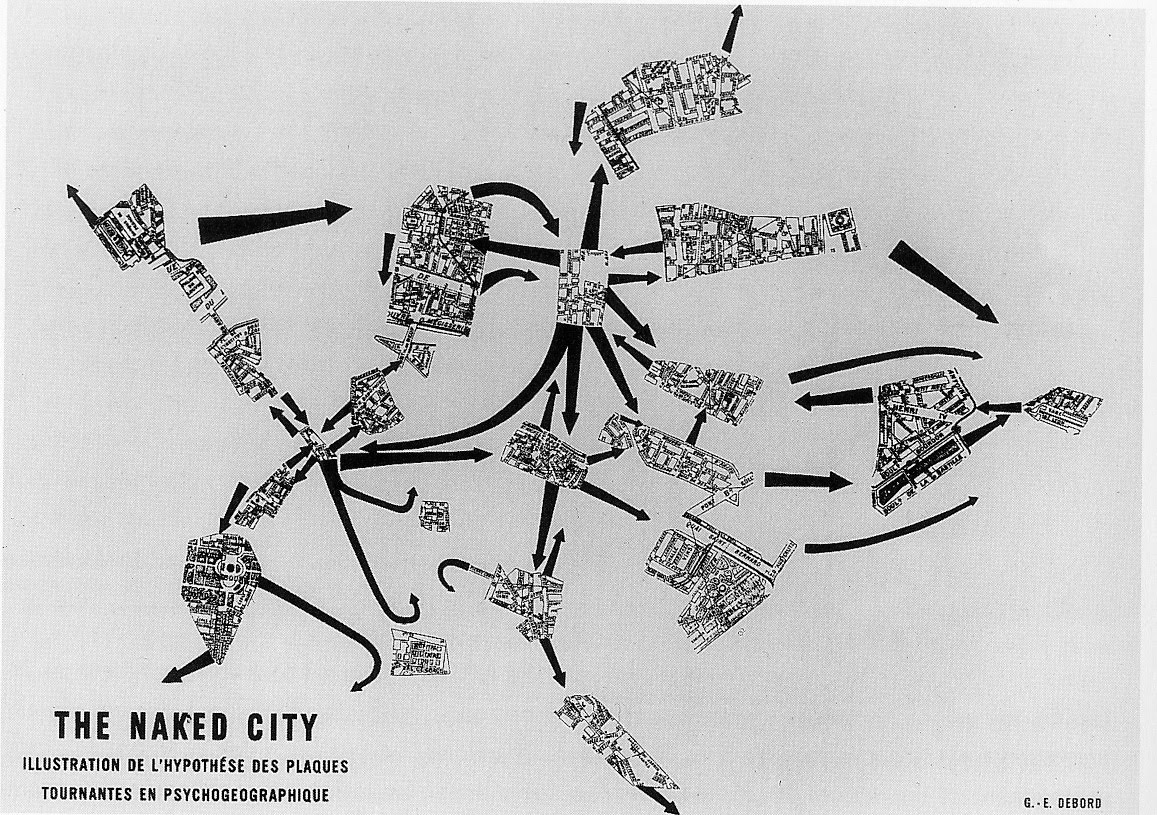
Psychogeographic Maps
Guy Debord
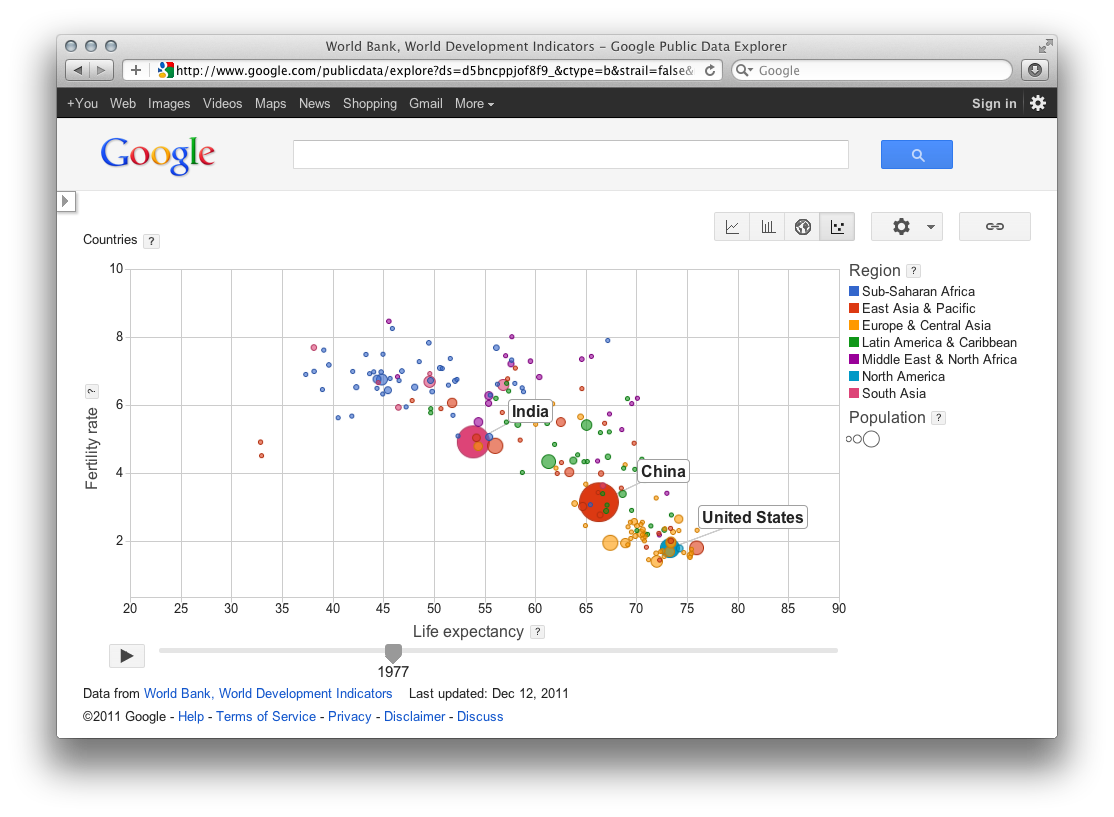
Public Data Explorer
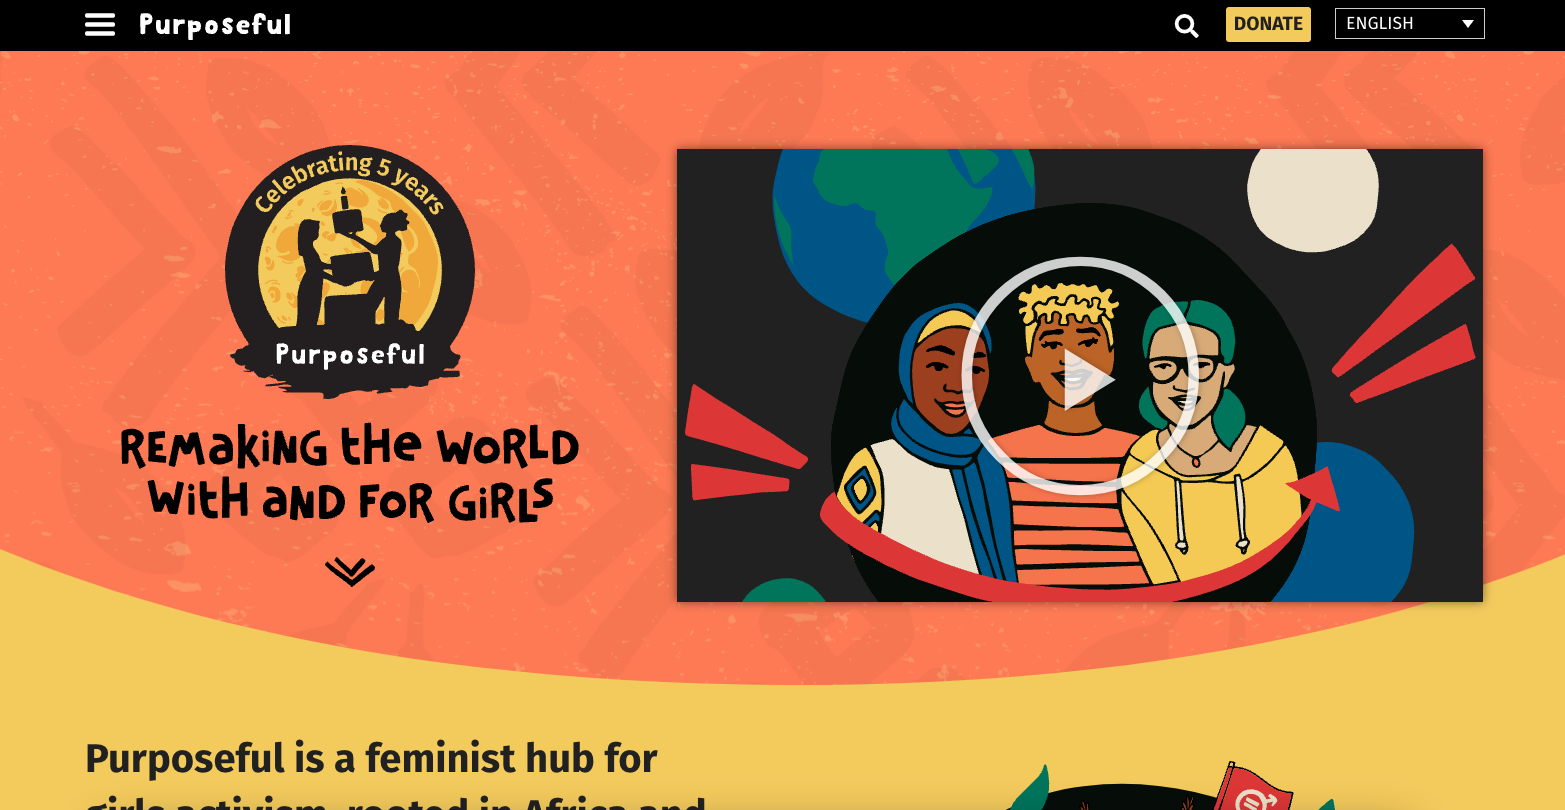
Purposeful Website
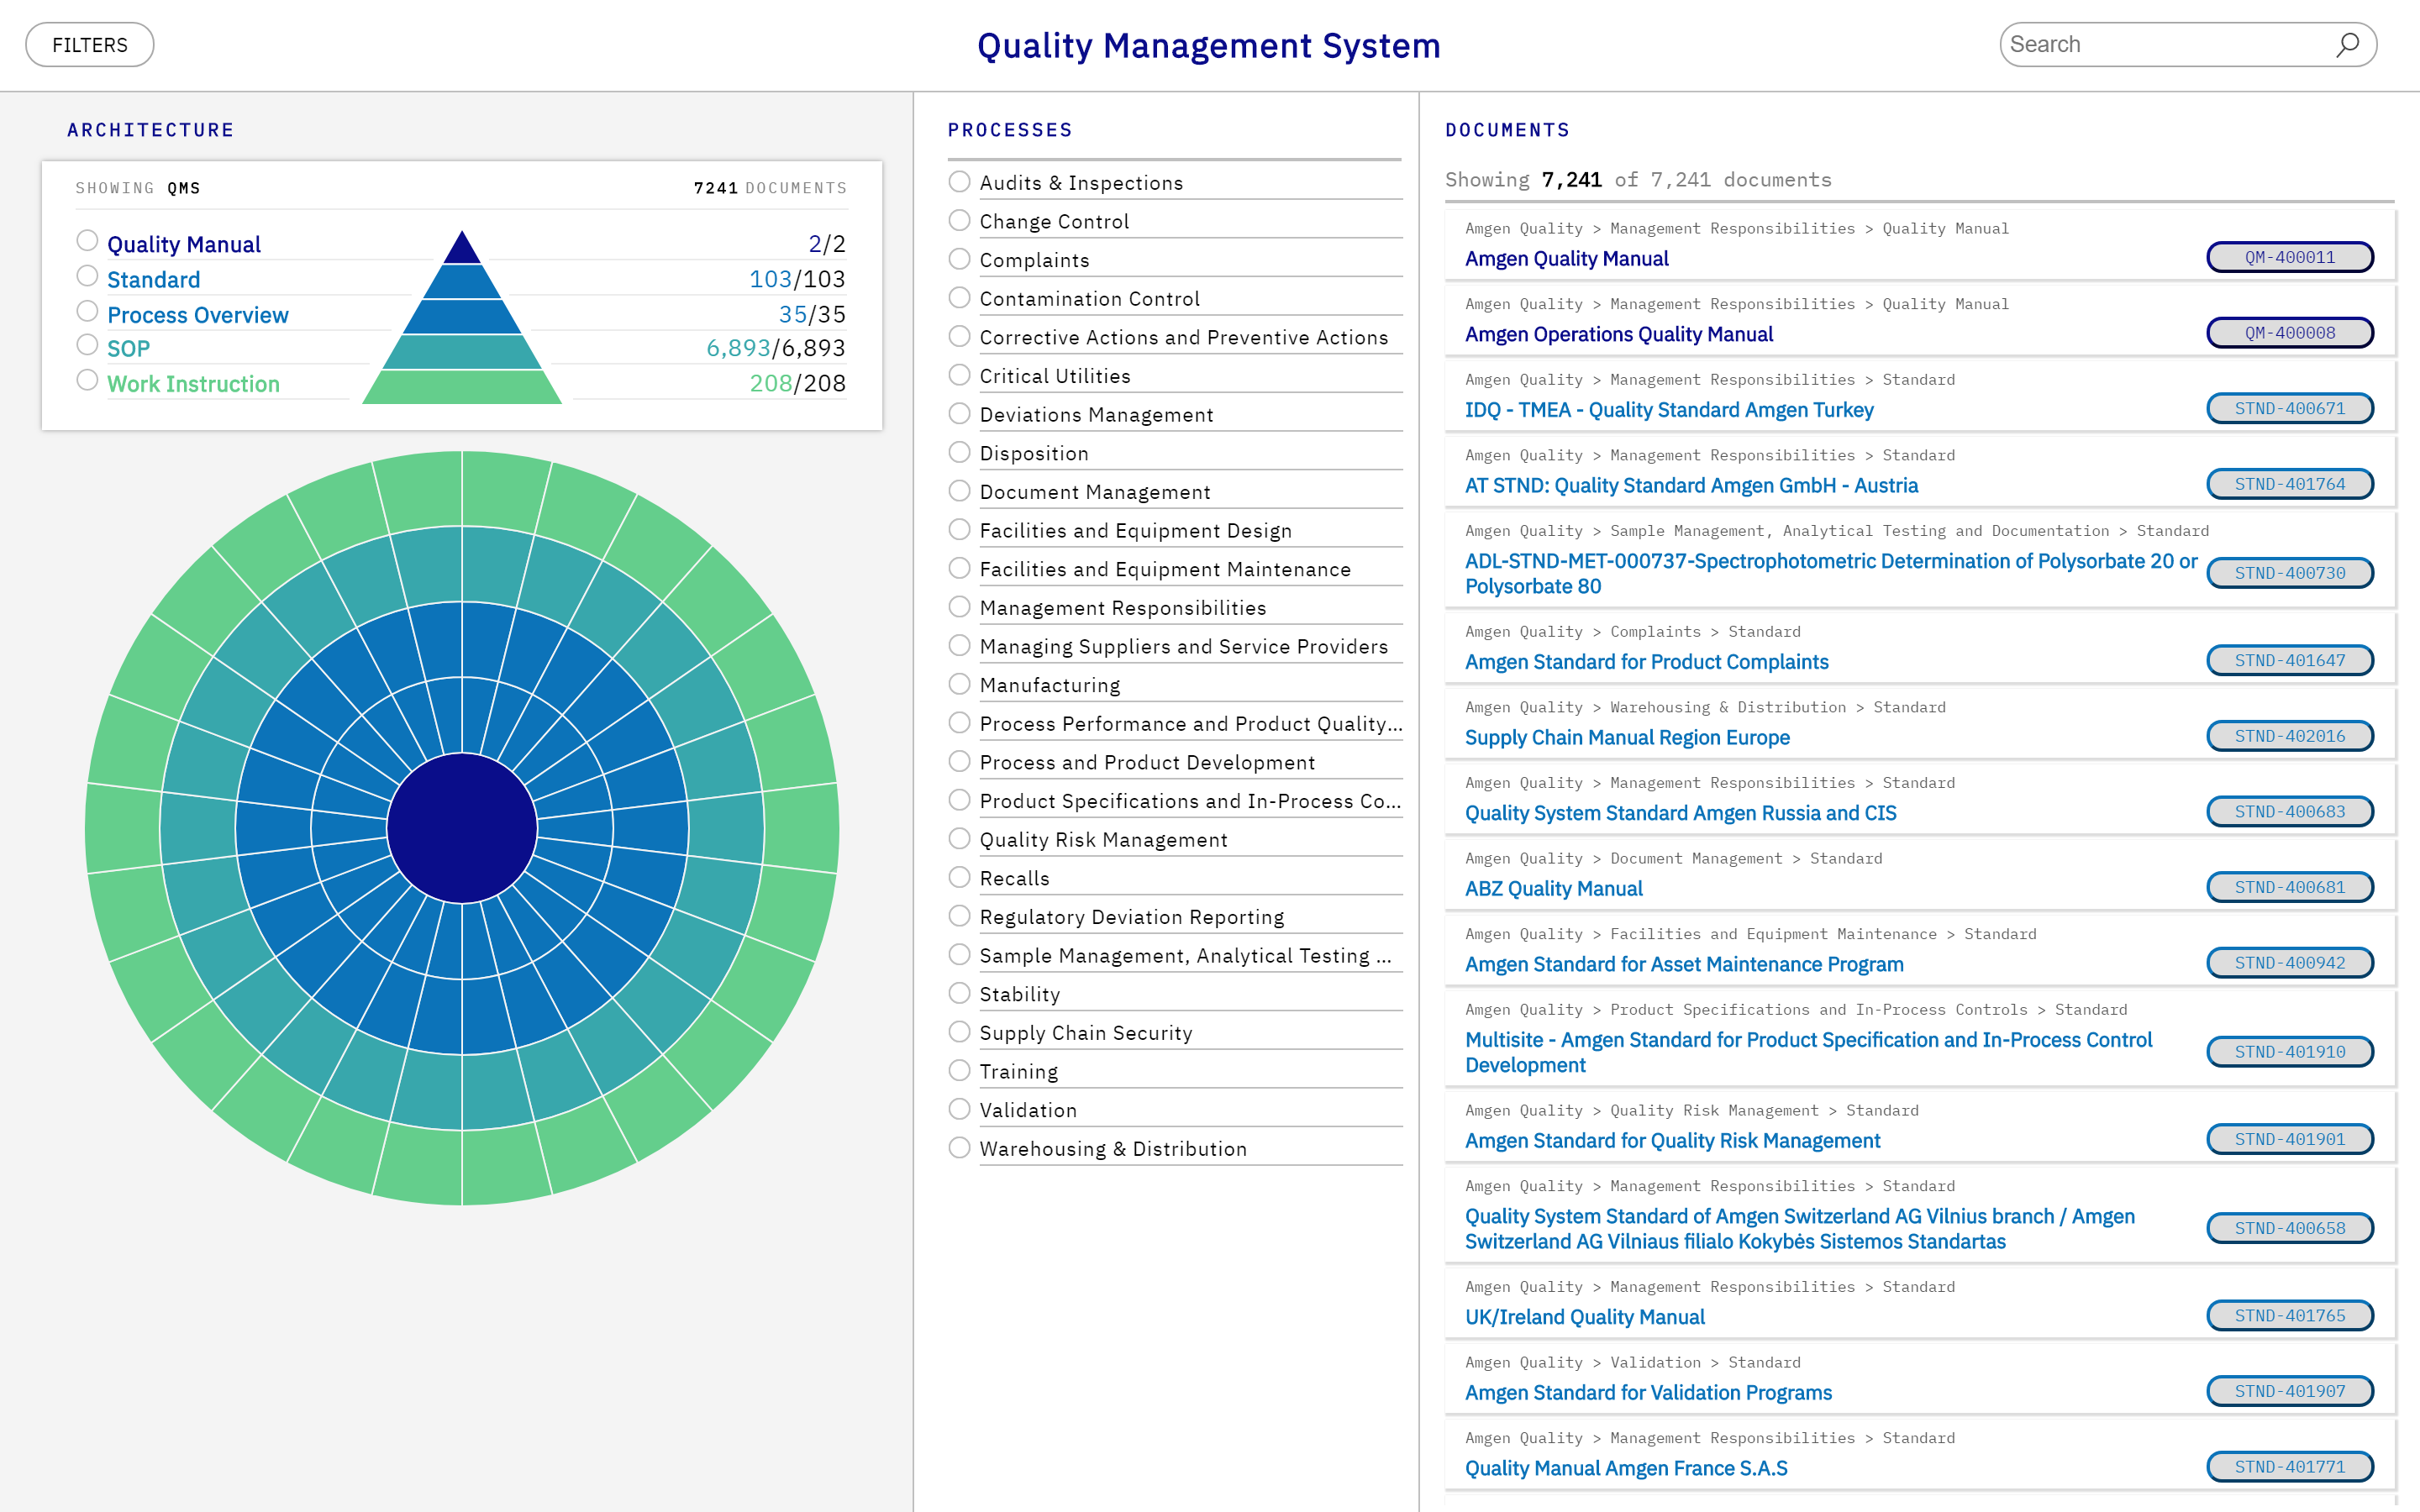
QMS Tool
Schema Design
Quality of Life 2020

Quantified Breakup
Lam Thuy Vo
Quantified Self
Bob Troia
R2D3
Race and Ethnicity across the Nation
CNN
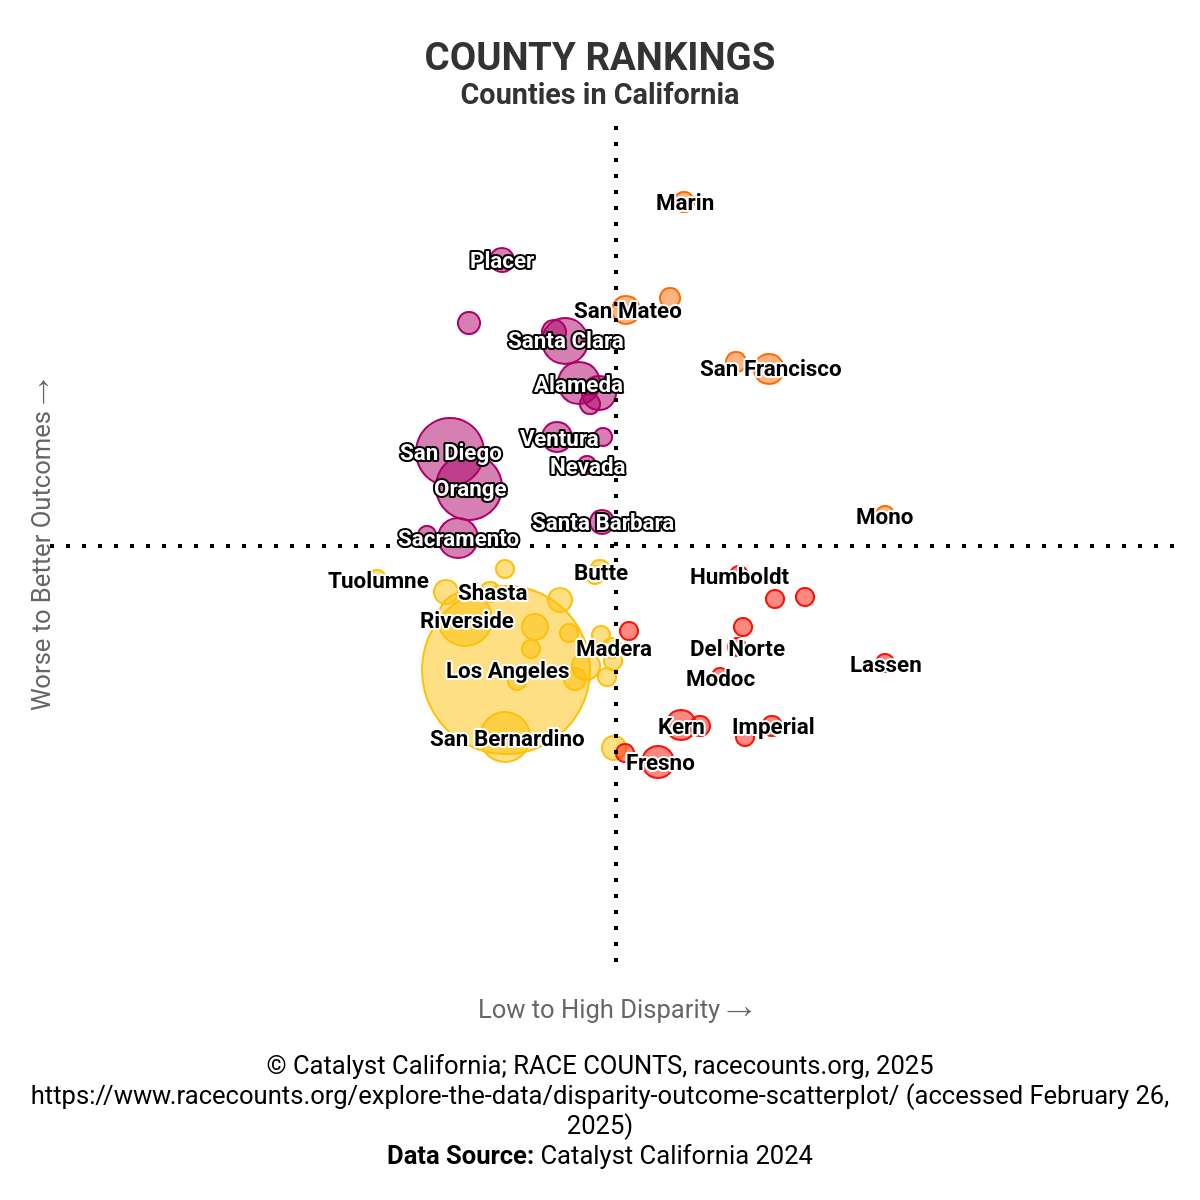
Race Counts
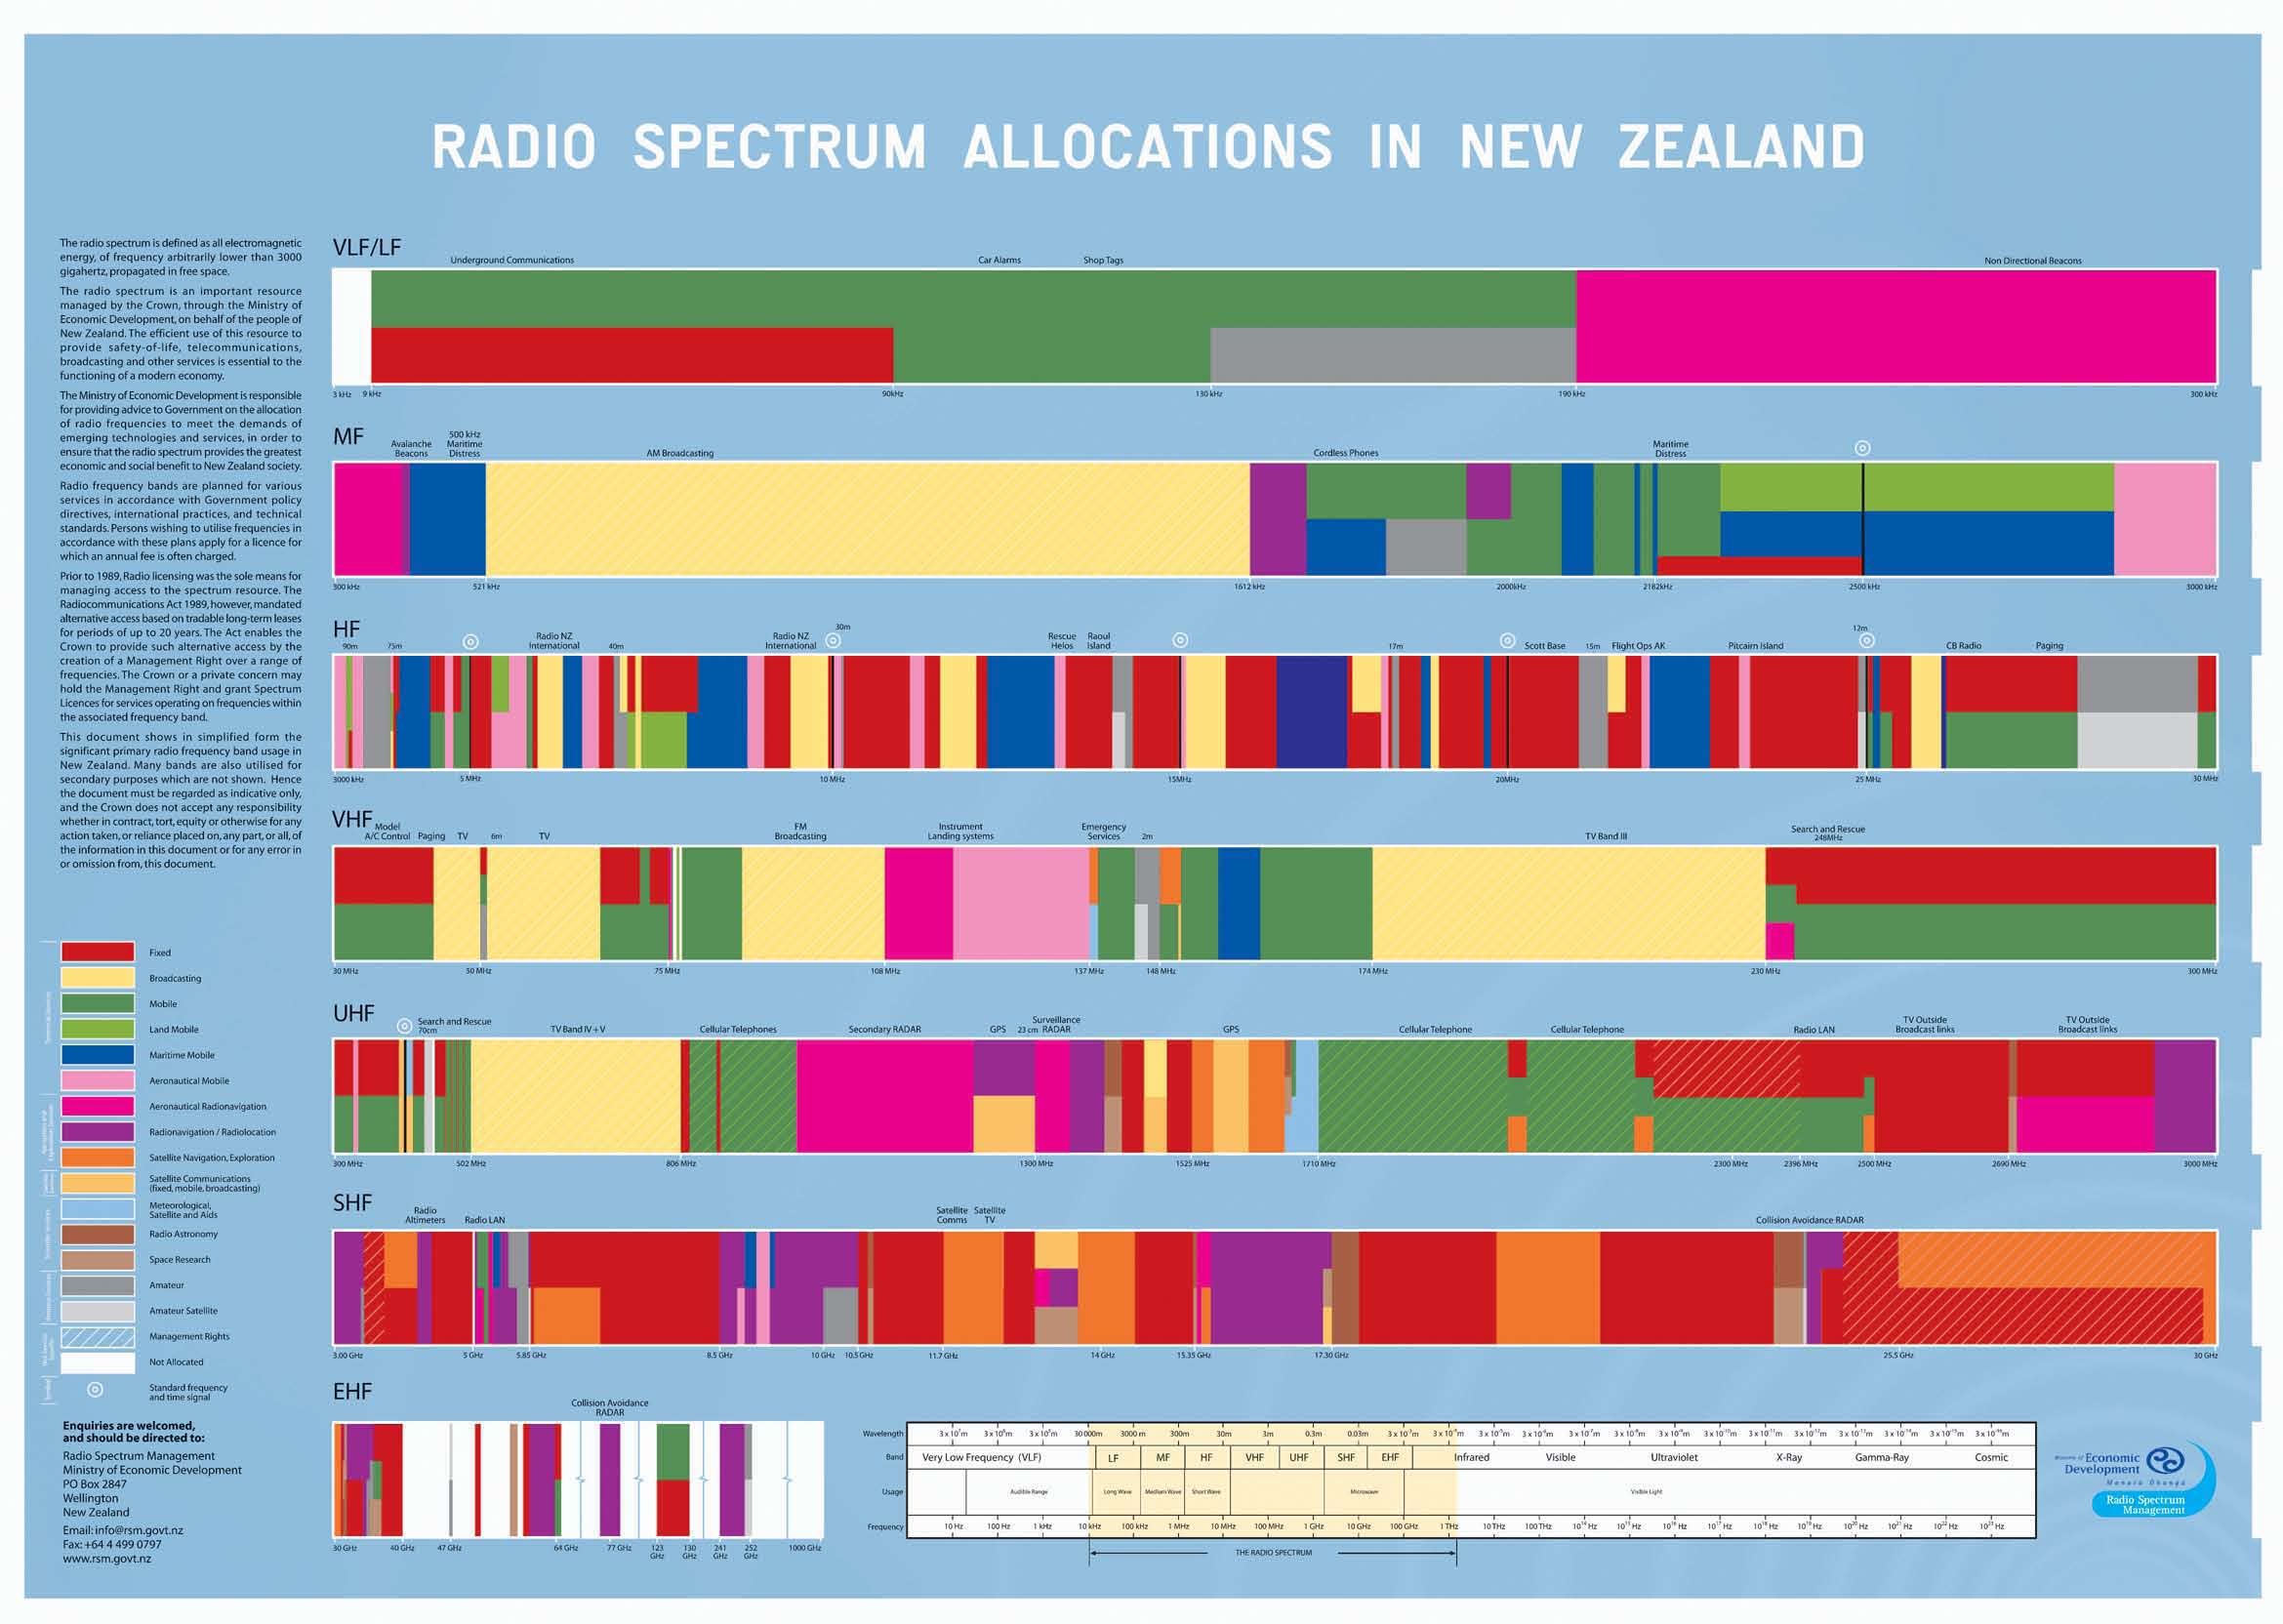
Radio Spectrum Allocations
US Department of Commerce
Rain upon US
visualeyed
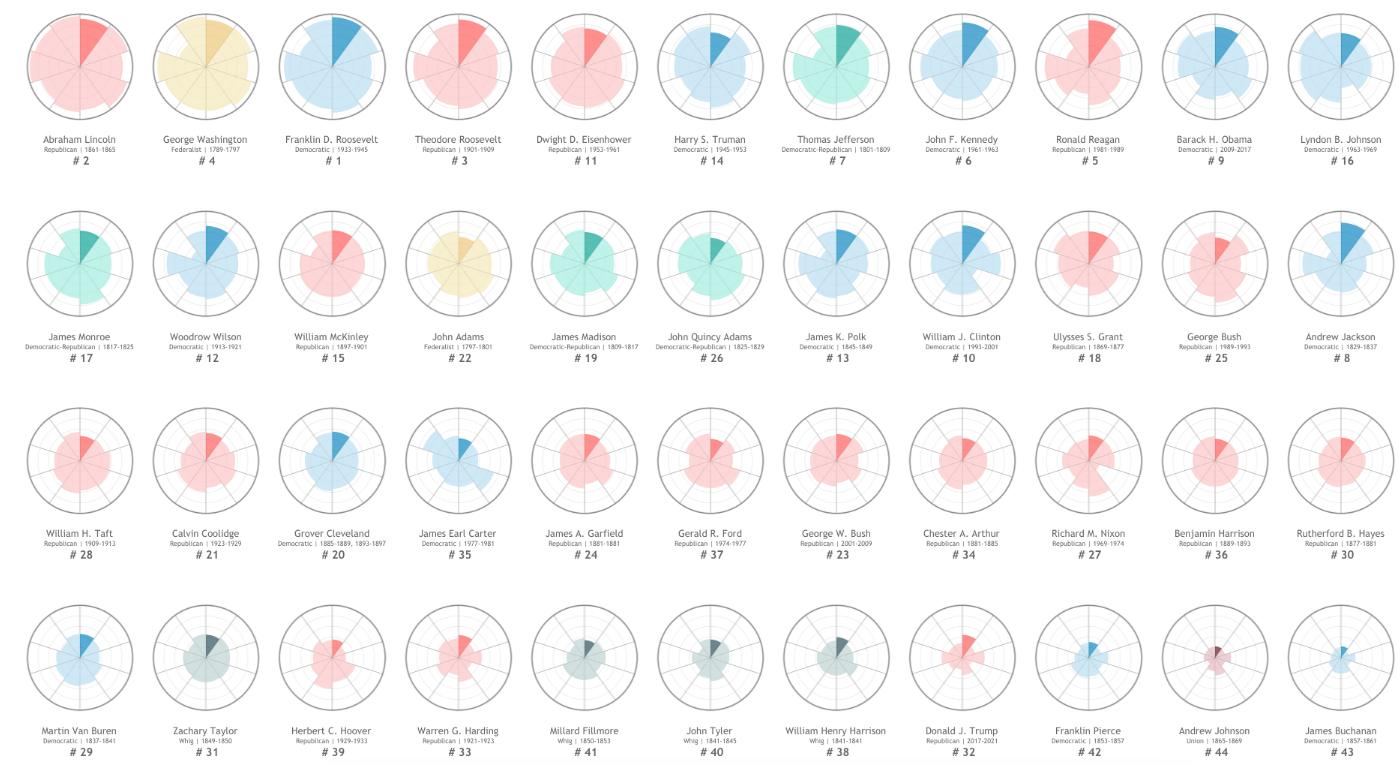
Rating the Presidents
Rebuilding U.S.-china Climate Cooperation
Asia Society

Recidiviz
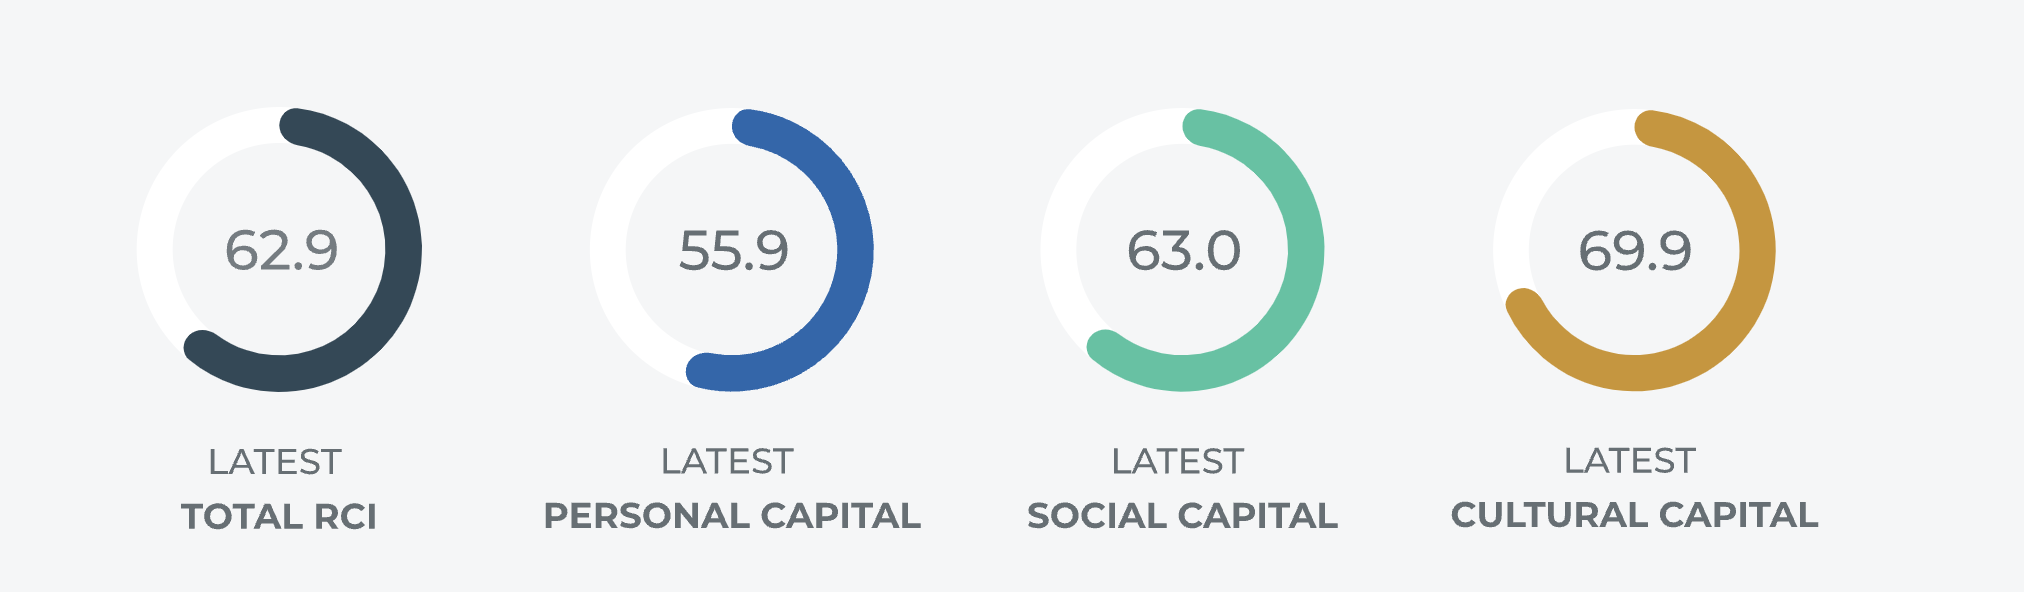
Recovery Capital Index
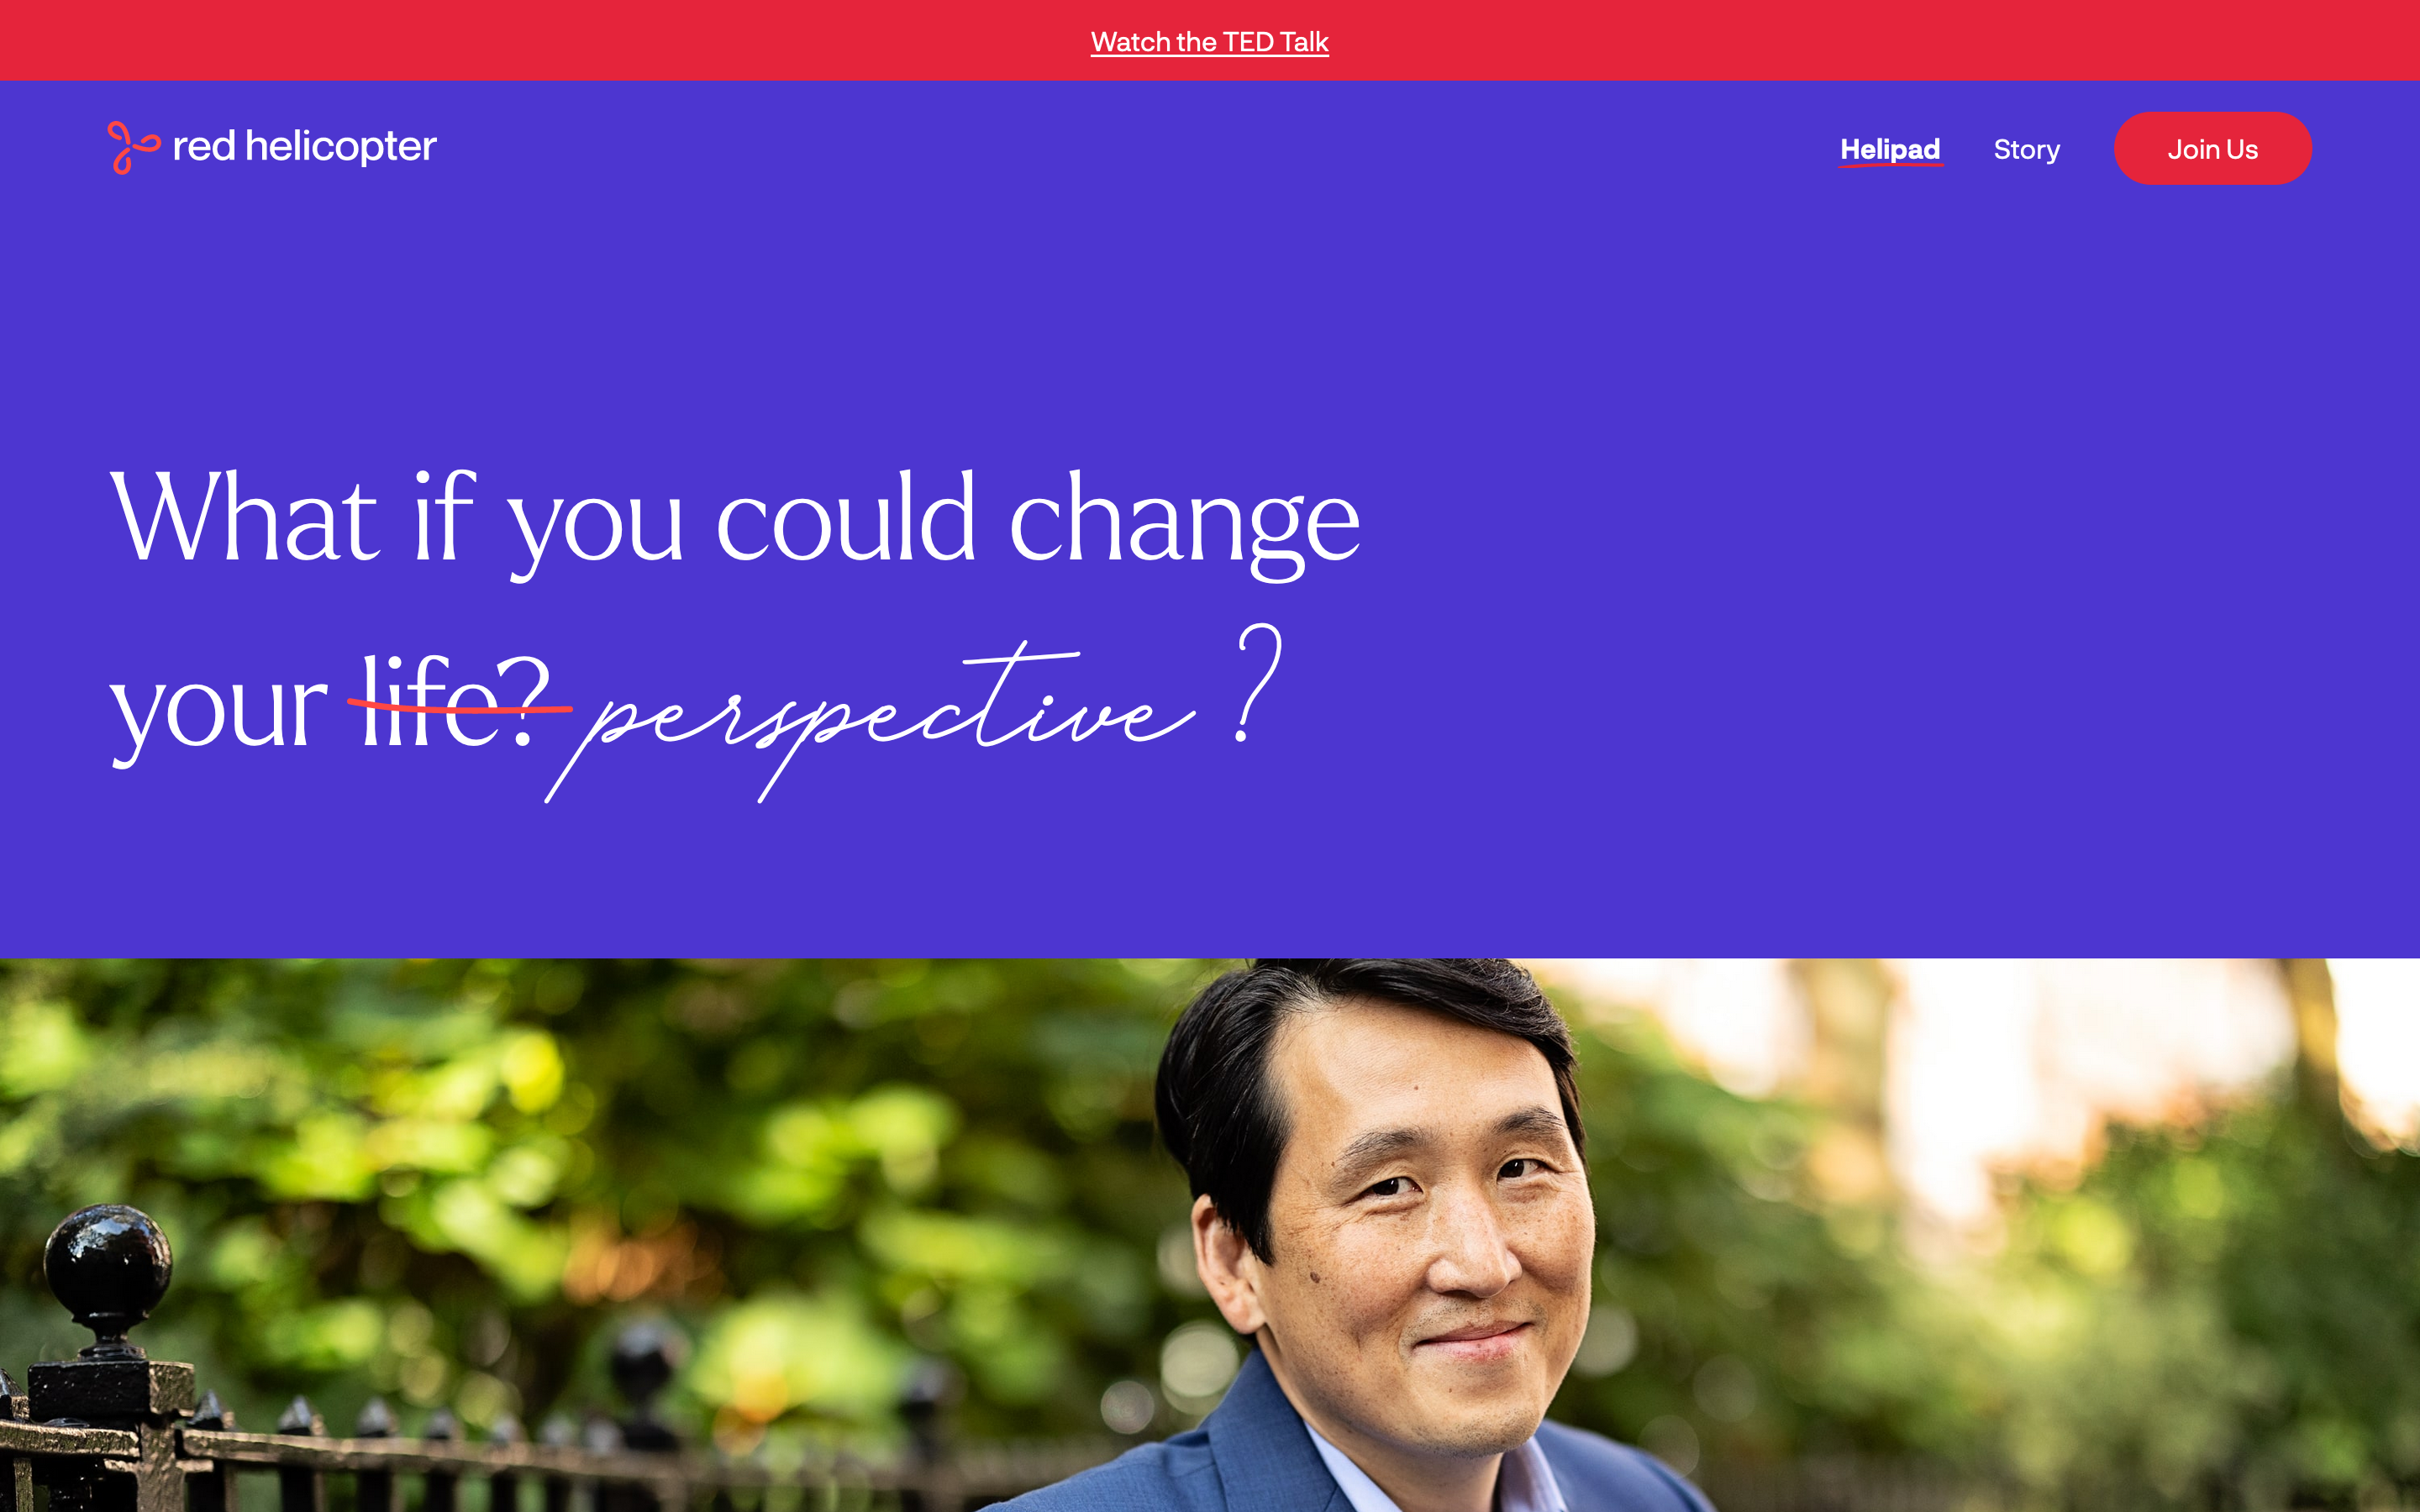
Red Helicopter Website
Schema Design
Refik Anadol
MoMA

Reporter
Feltron / Reporter
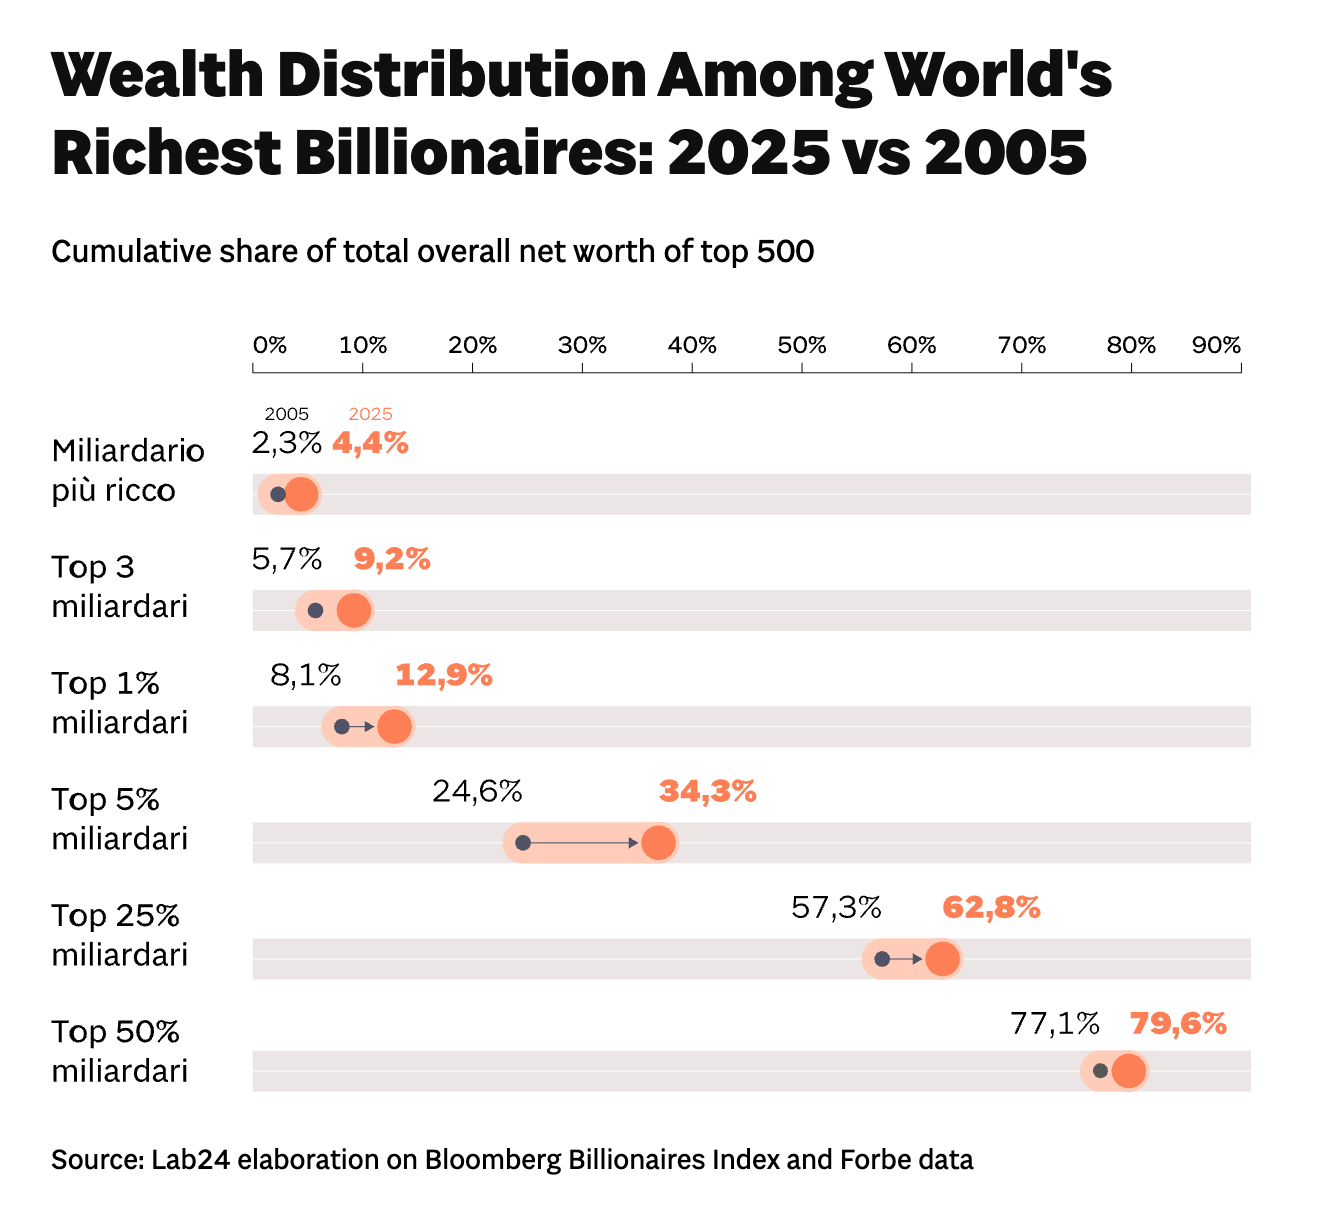
Richest Ever: Musk and Other Billionaires
Rijks Museum Collection Site
Rijksmuseum
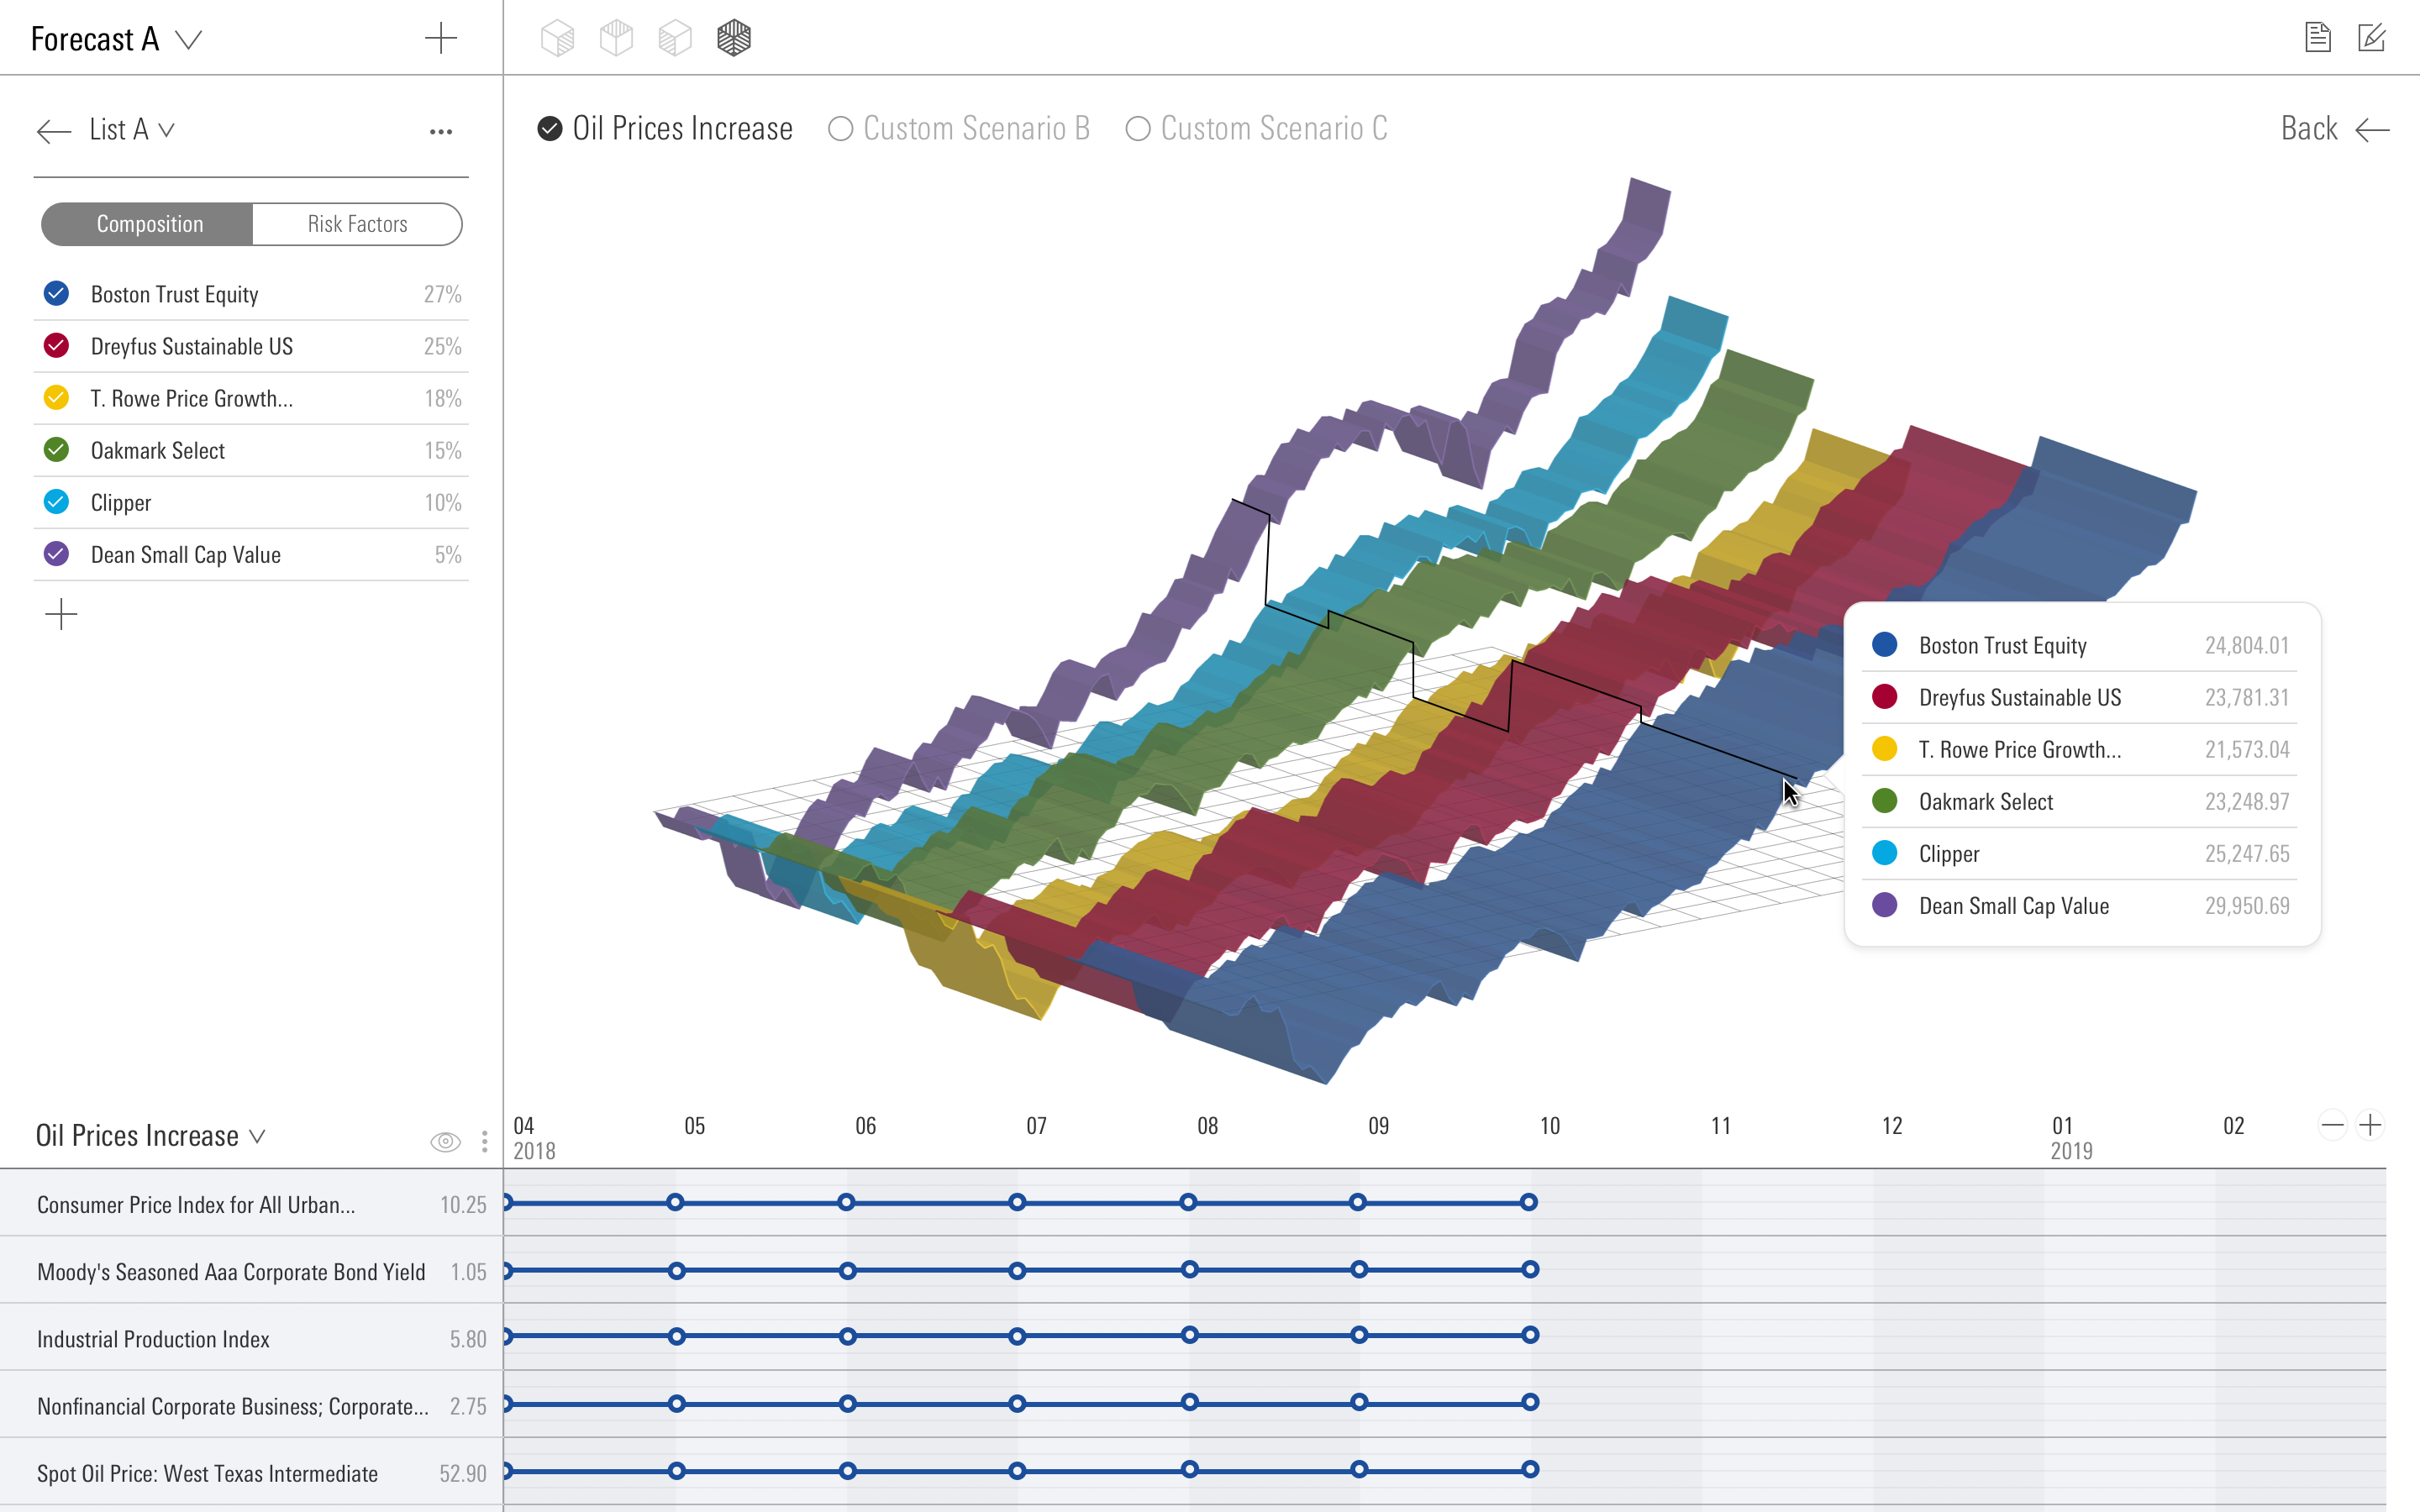
Risk Analysis
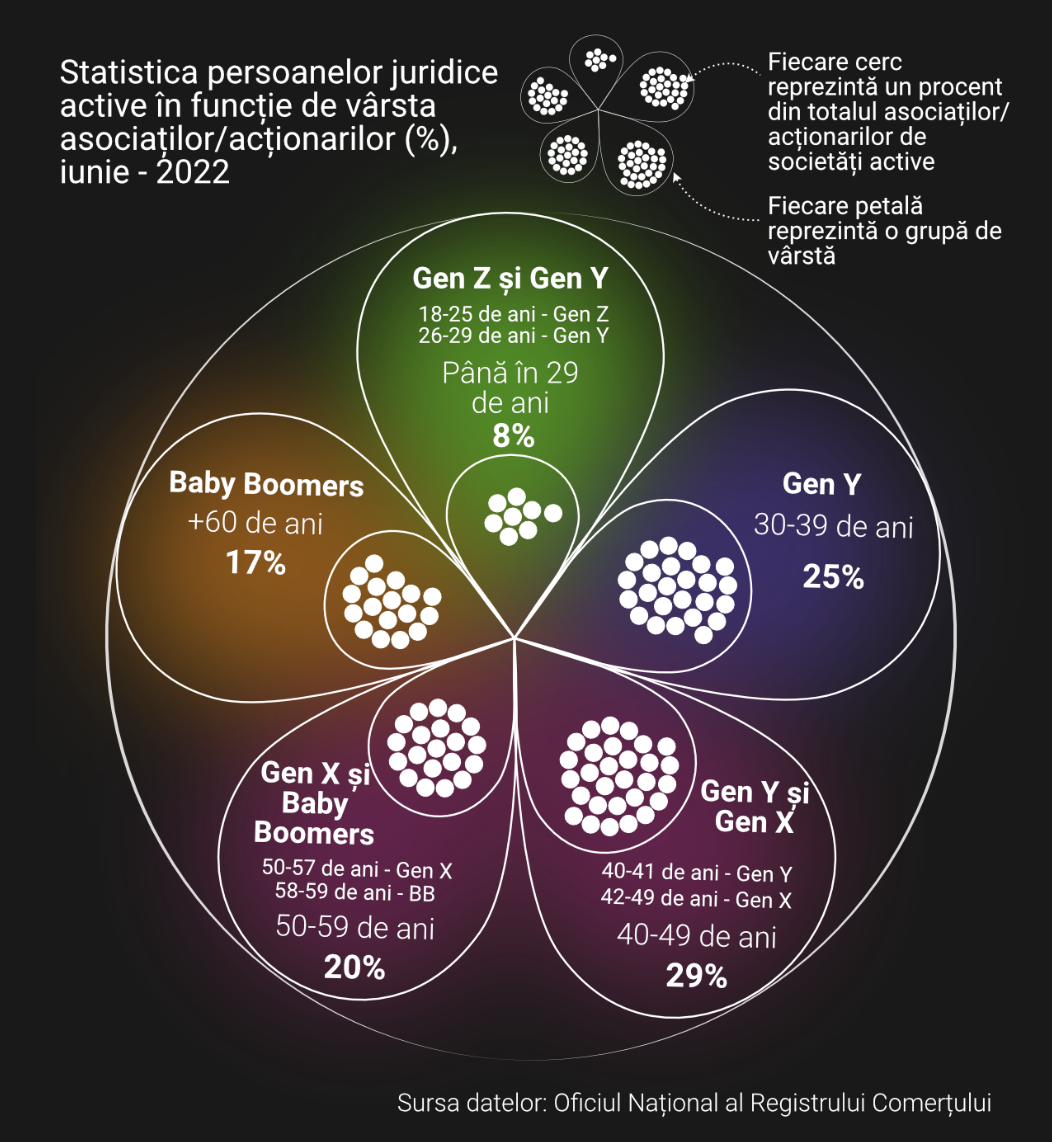
Romania for Generations
Panorama
Ron Carter Universe
Room of Quiet Contemplation
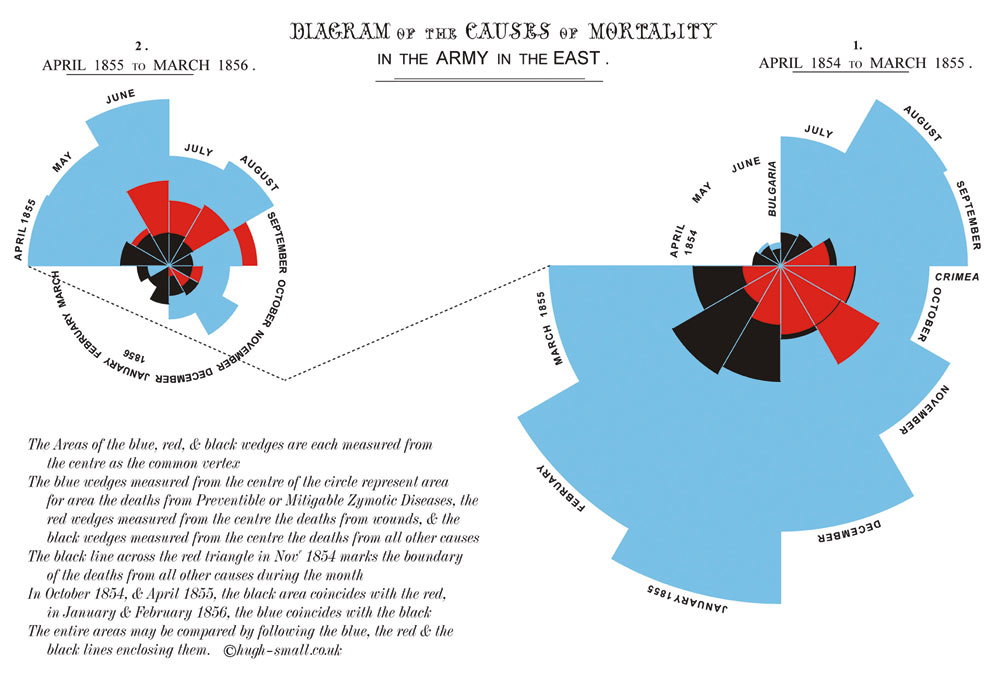
Rose Diagram
Florence Nightingale
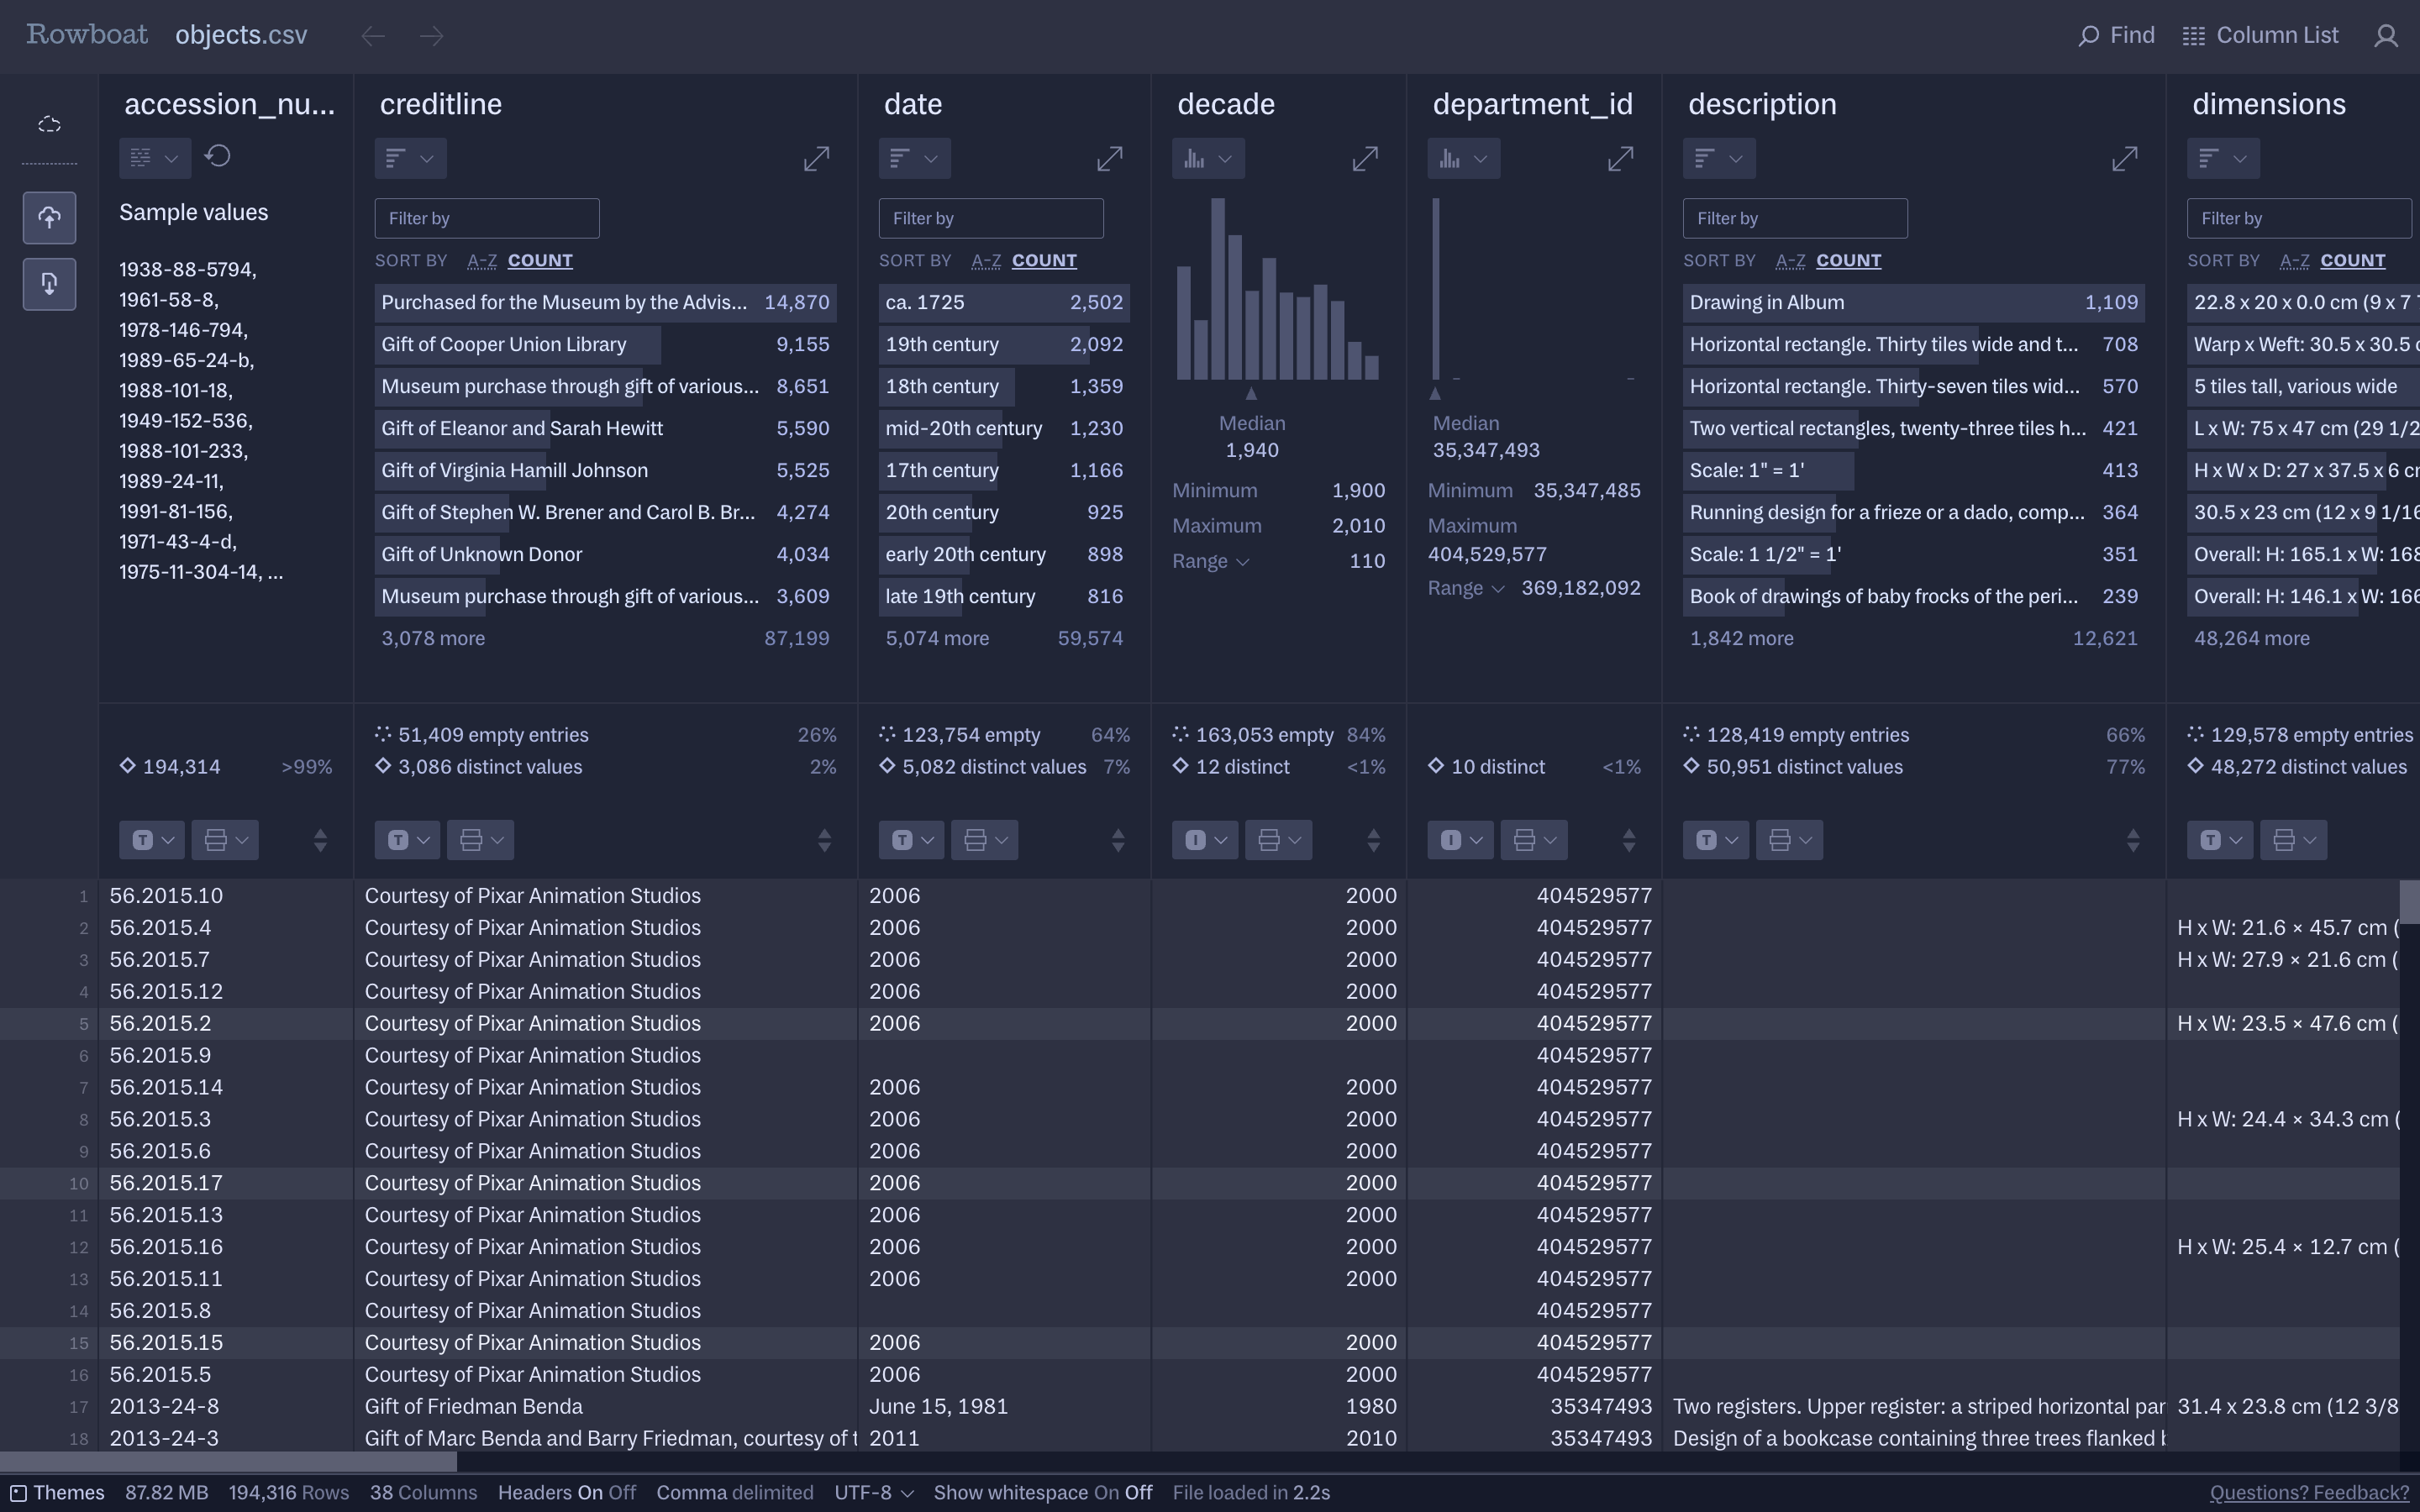
Rowboat Studios
Rowboat Studios

Rubin & Hansen
Ben Rubin & Mark Hansen

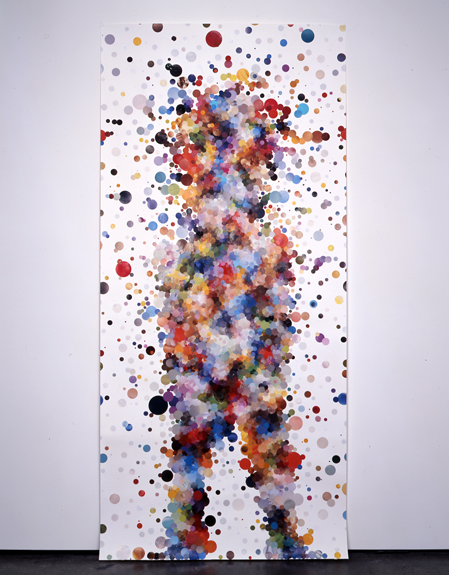
Running the Numbers
Chris Jordan
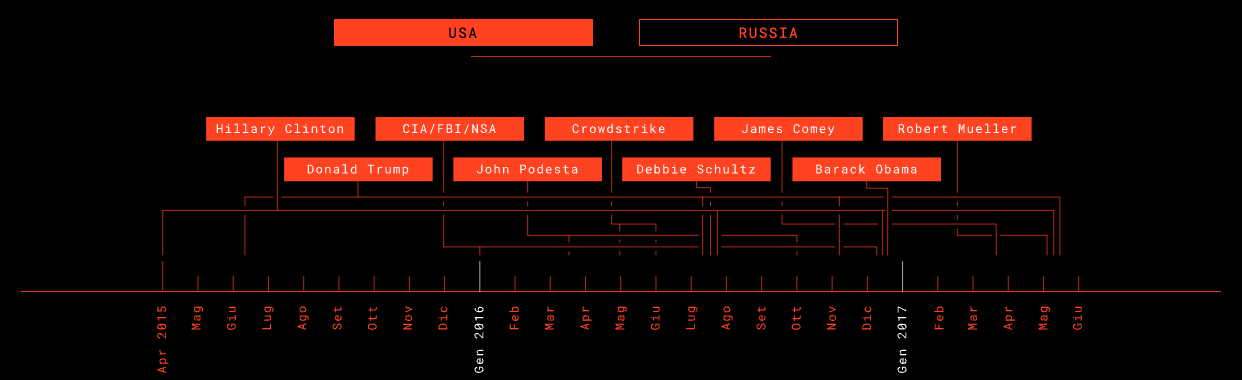
Russiagate
visualeyed
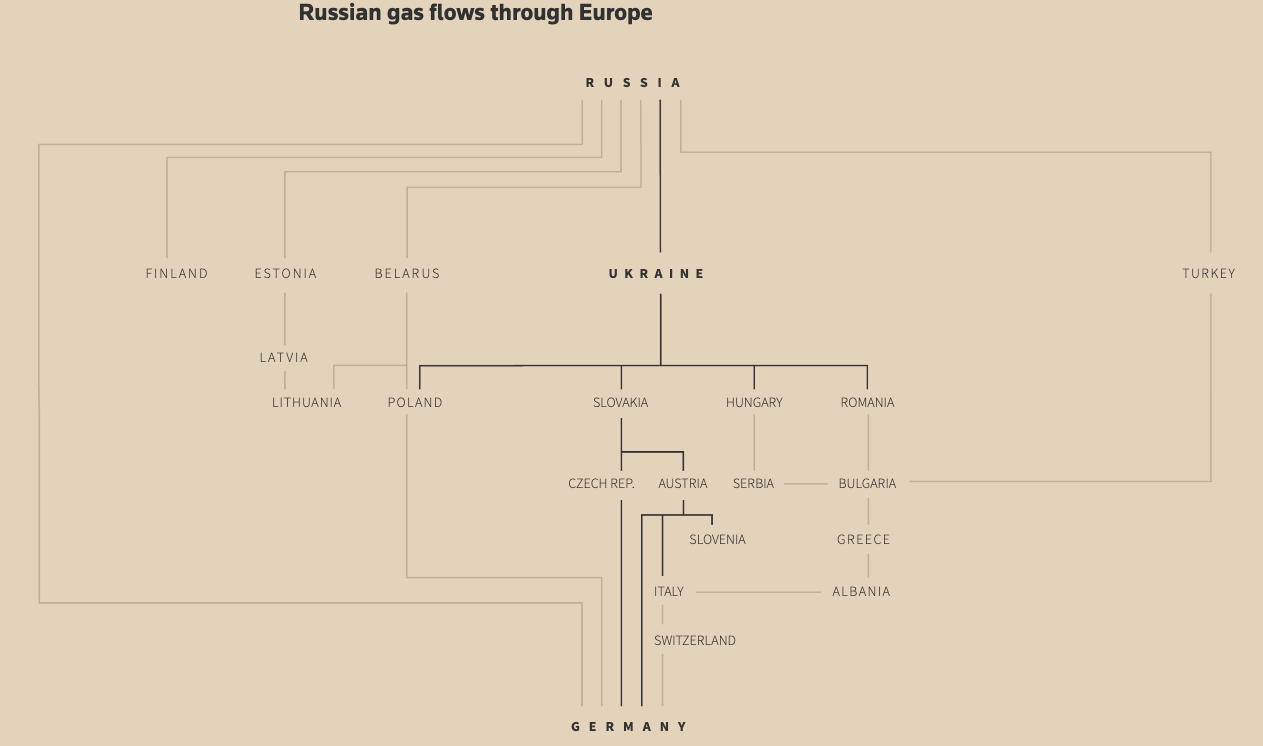
Russian Threat in Europe
Reuters
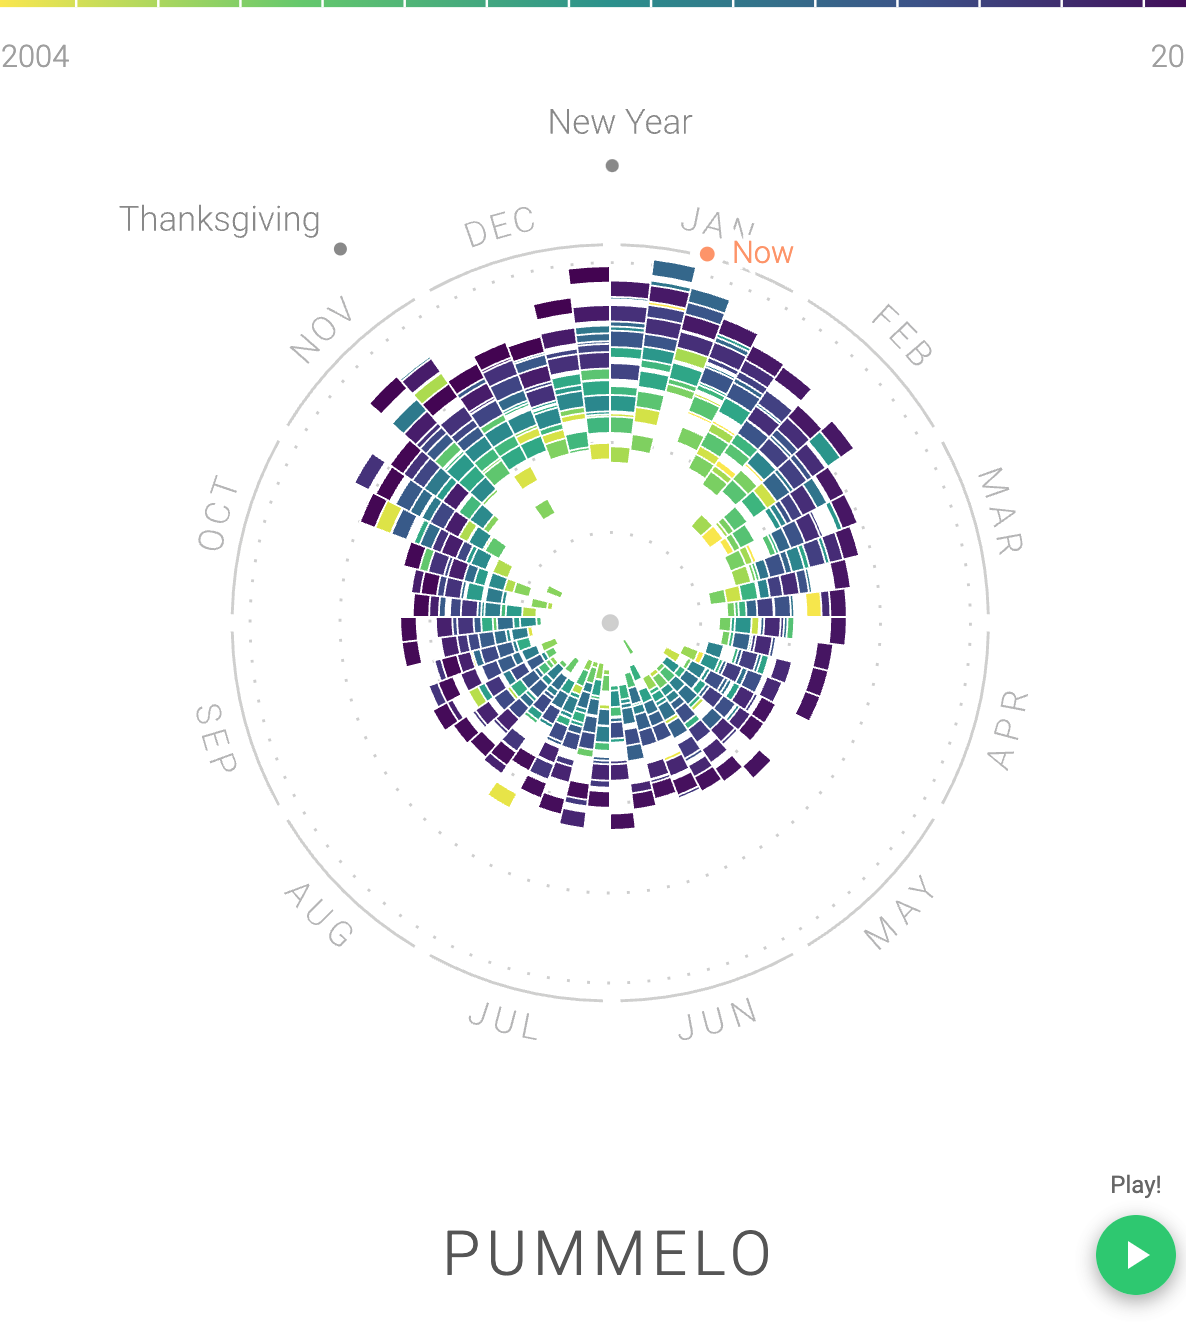
Rythm of Food

Sage Ark
Schema Design
Sage Website Redesign
Schema Design
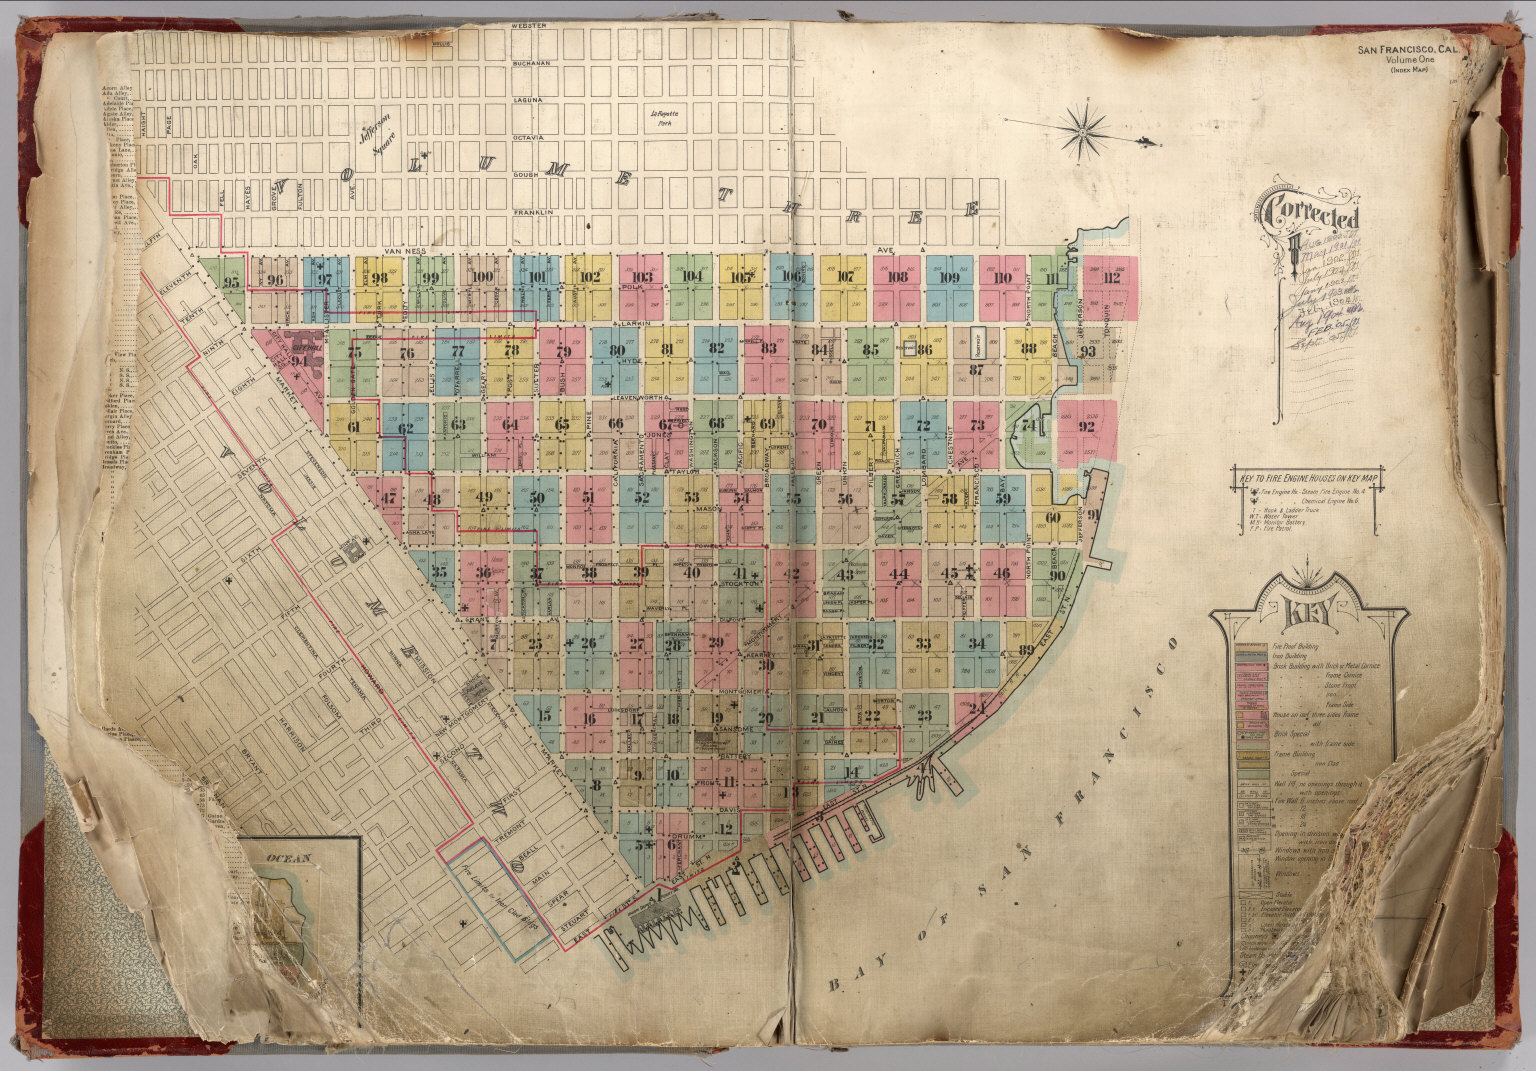
Sanborn Pre Earthquake SF
Sanborn Map Company
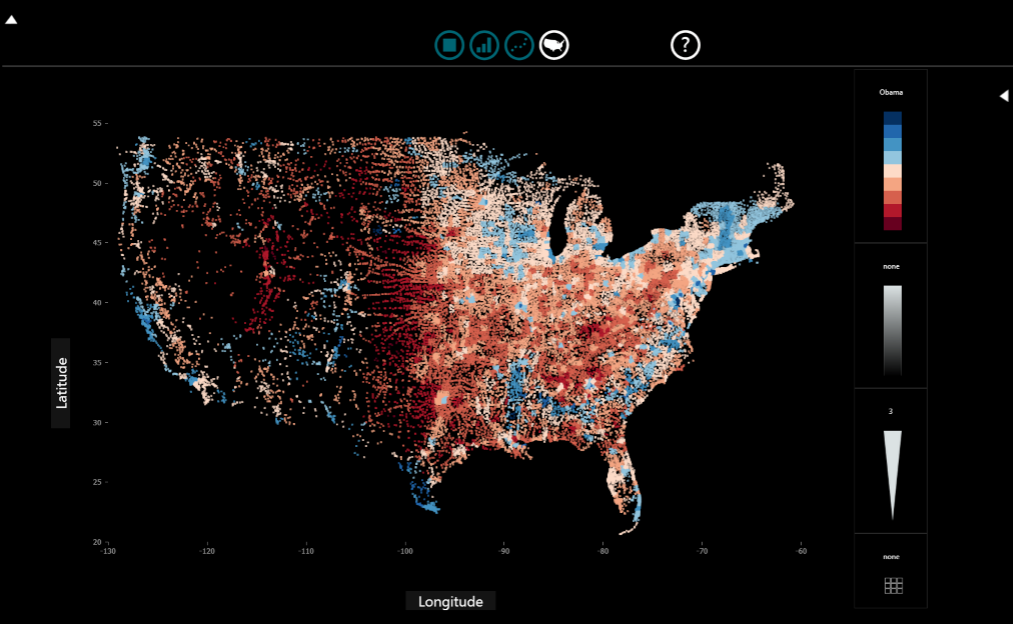
SandDance
Steven Drucker / Microsoft Research
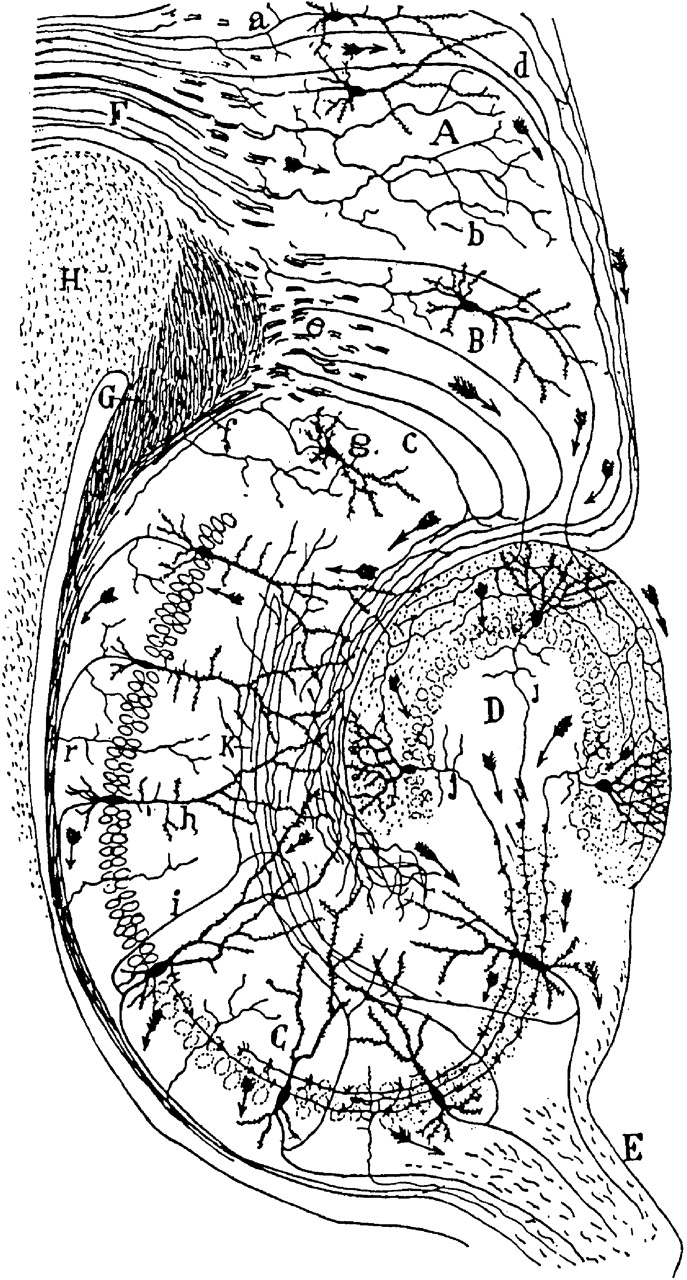
Santiago Ramón y Cajal
Santiago Ramón y Cajal

Satellite Bio
Savills: Discovery & Design System
Schema Design

Scenes from North Korea
The Big Picture / Boston.com
Science Fiction Covers
Bill Buxton
Scientific Collaboration Map
Olivier Beauchesne
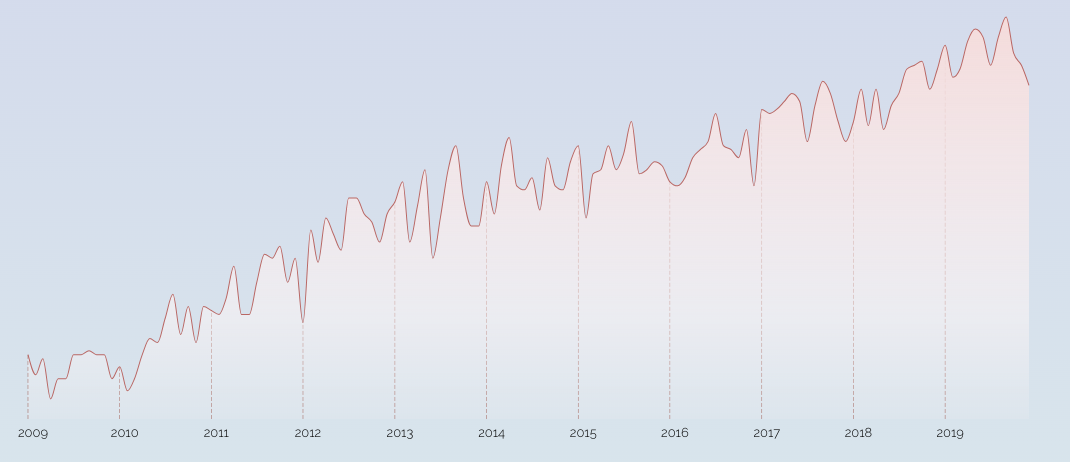
Search Volume Index
Aaron Koblin
Searching COVID-19
Schema Design
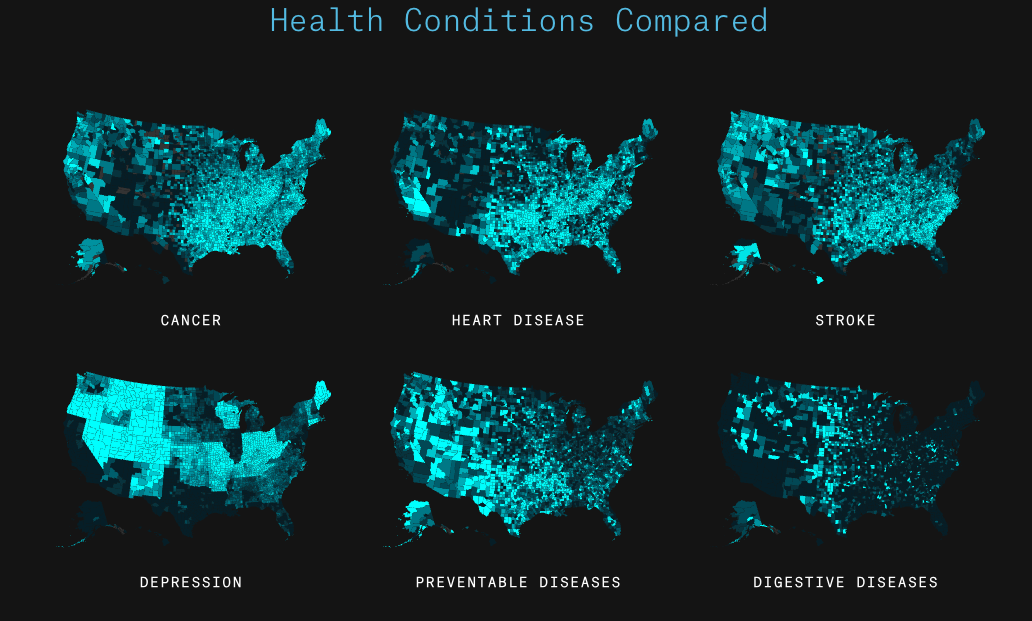
Searching for Health
Schema Design
Searching the World
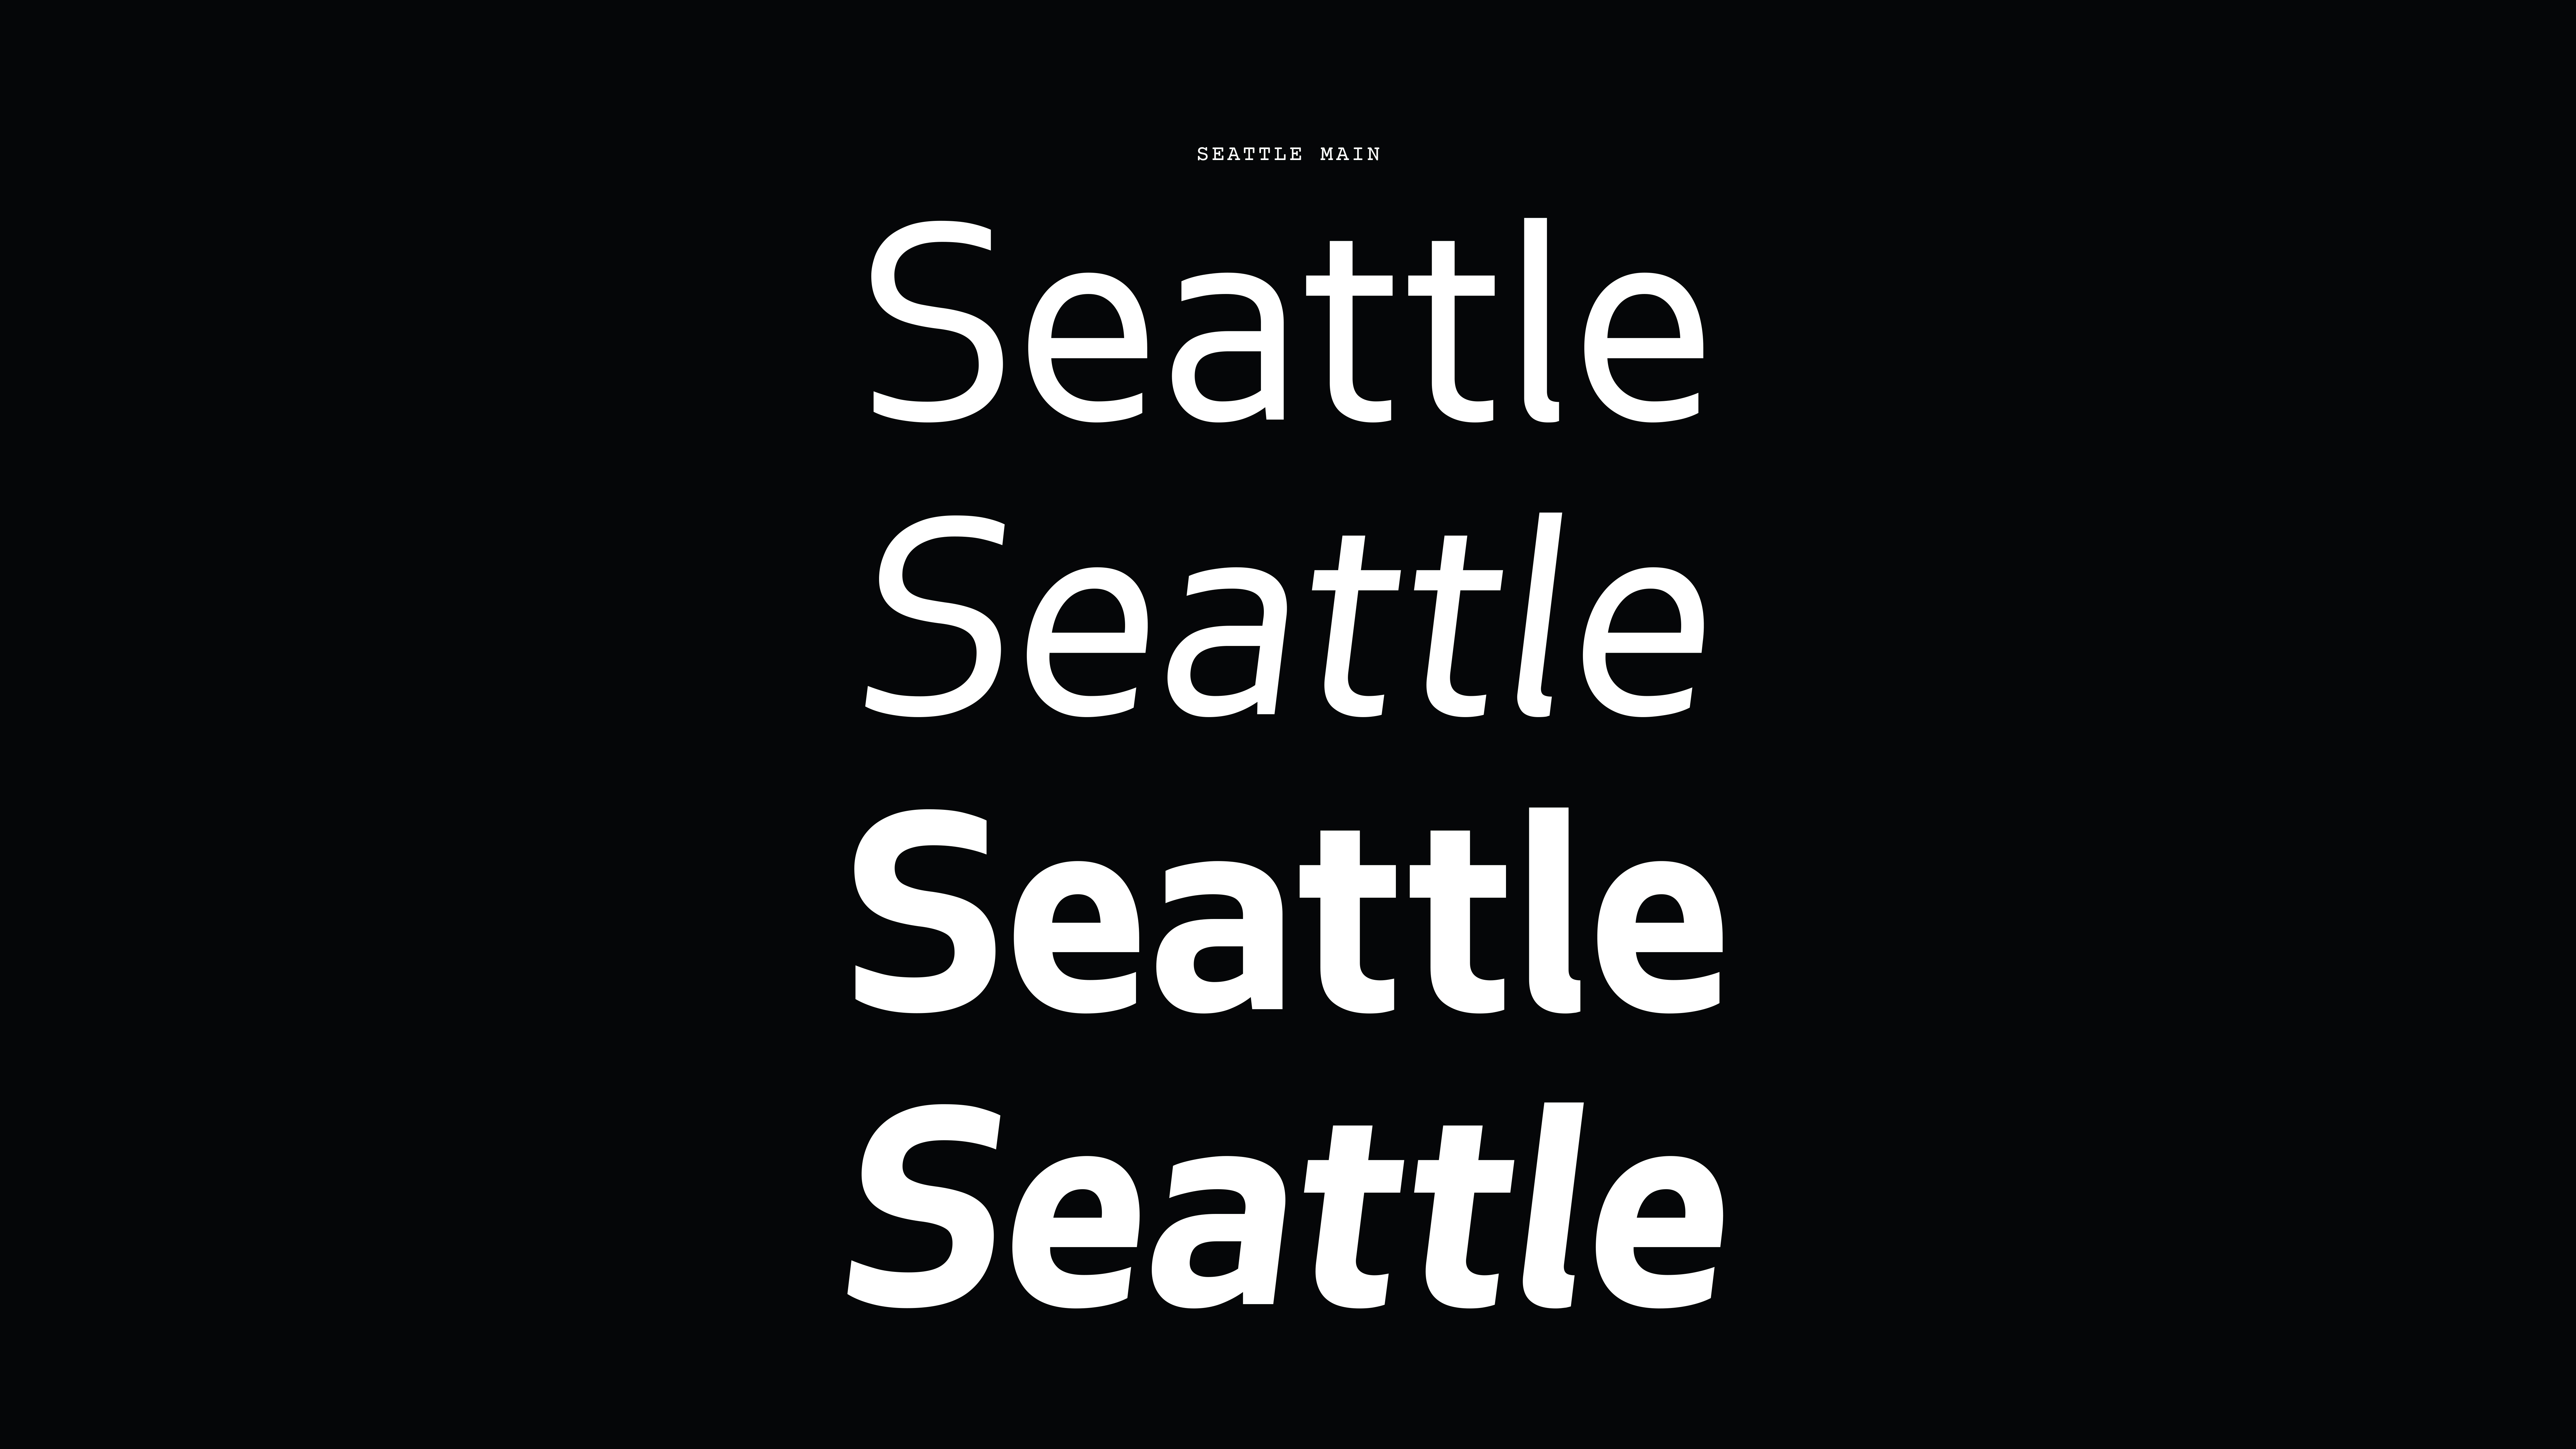
Seattle Font
Schema Design
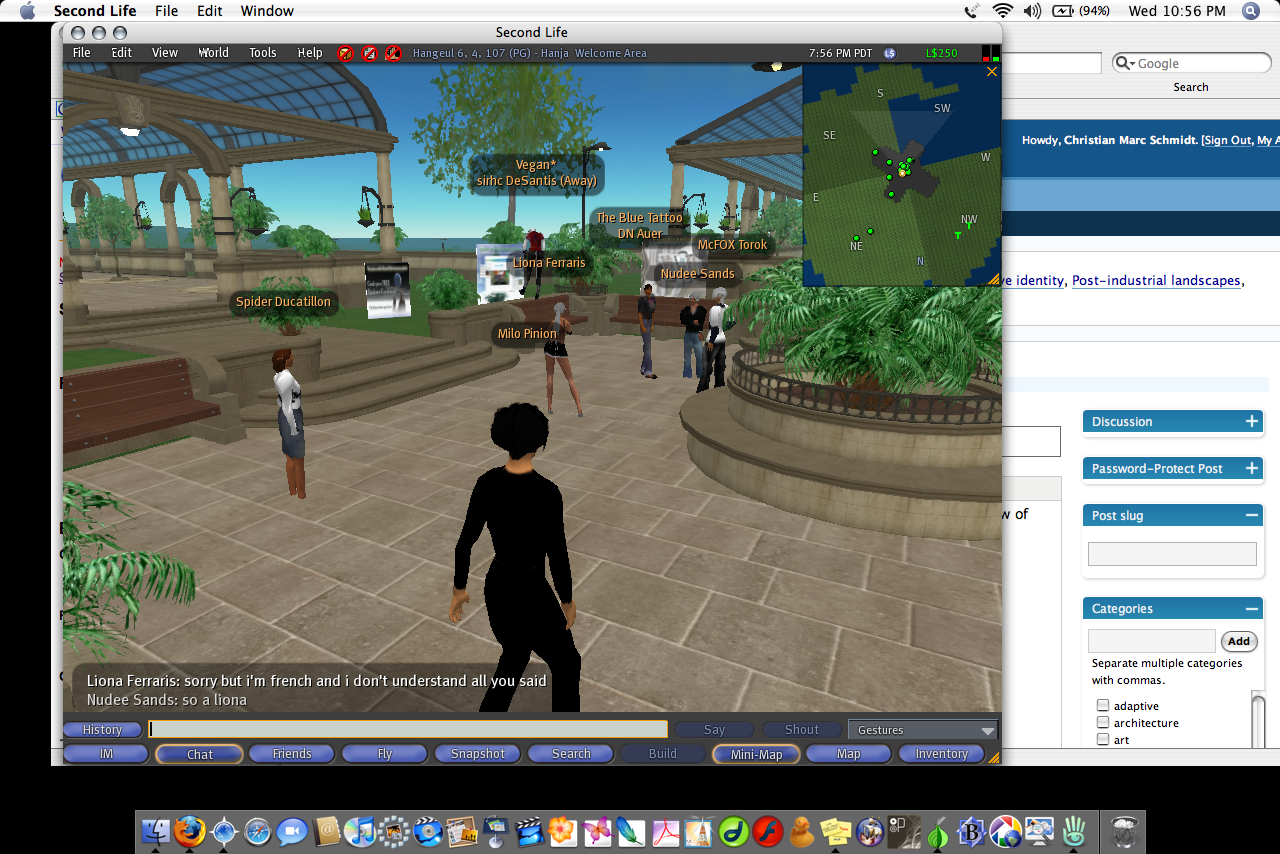
Second Life Map
Linden Lab
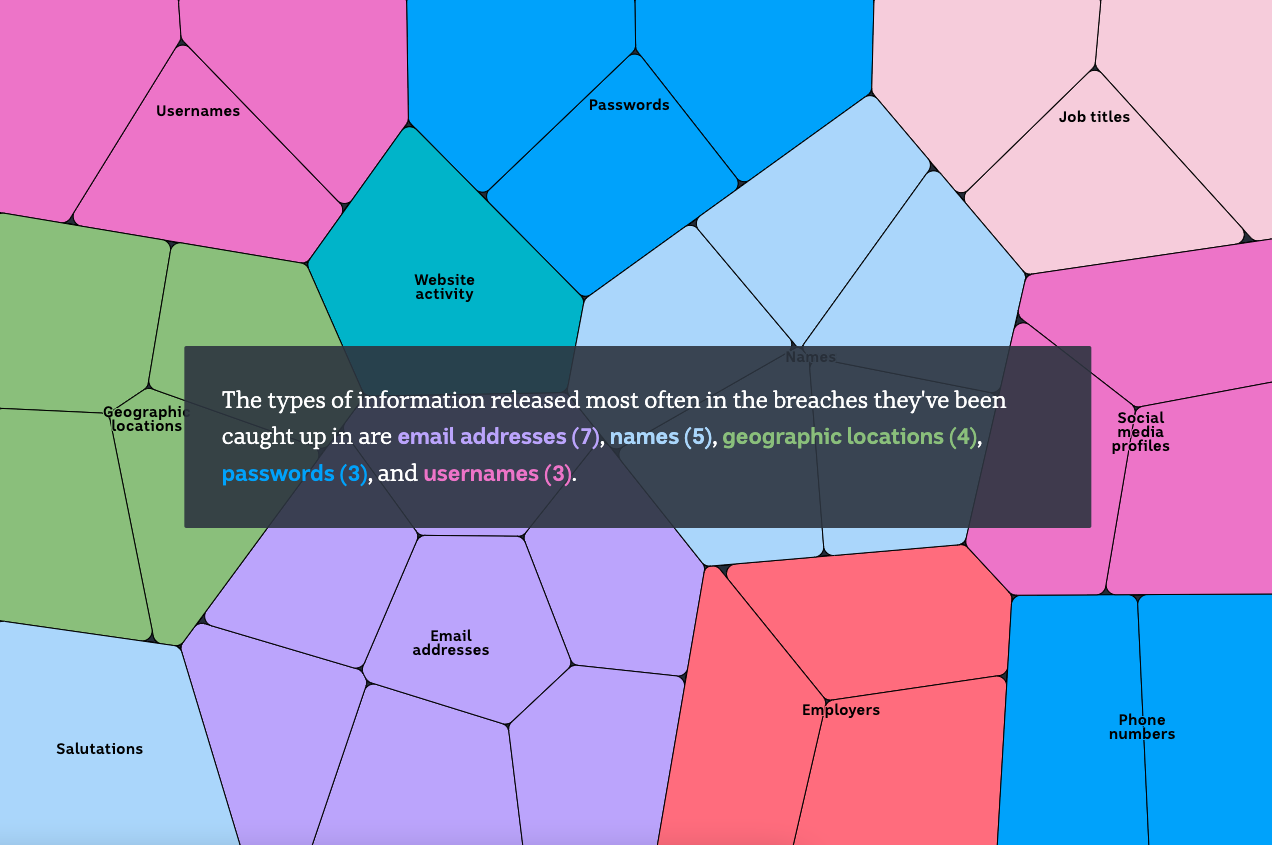
See Your Identity Pieced Together from Stolen Data, Abc News
ABC News
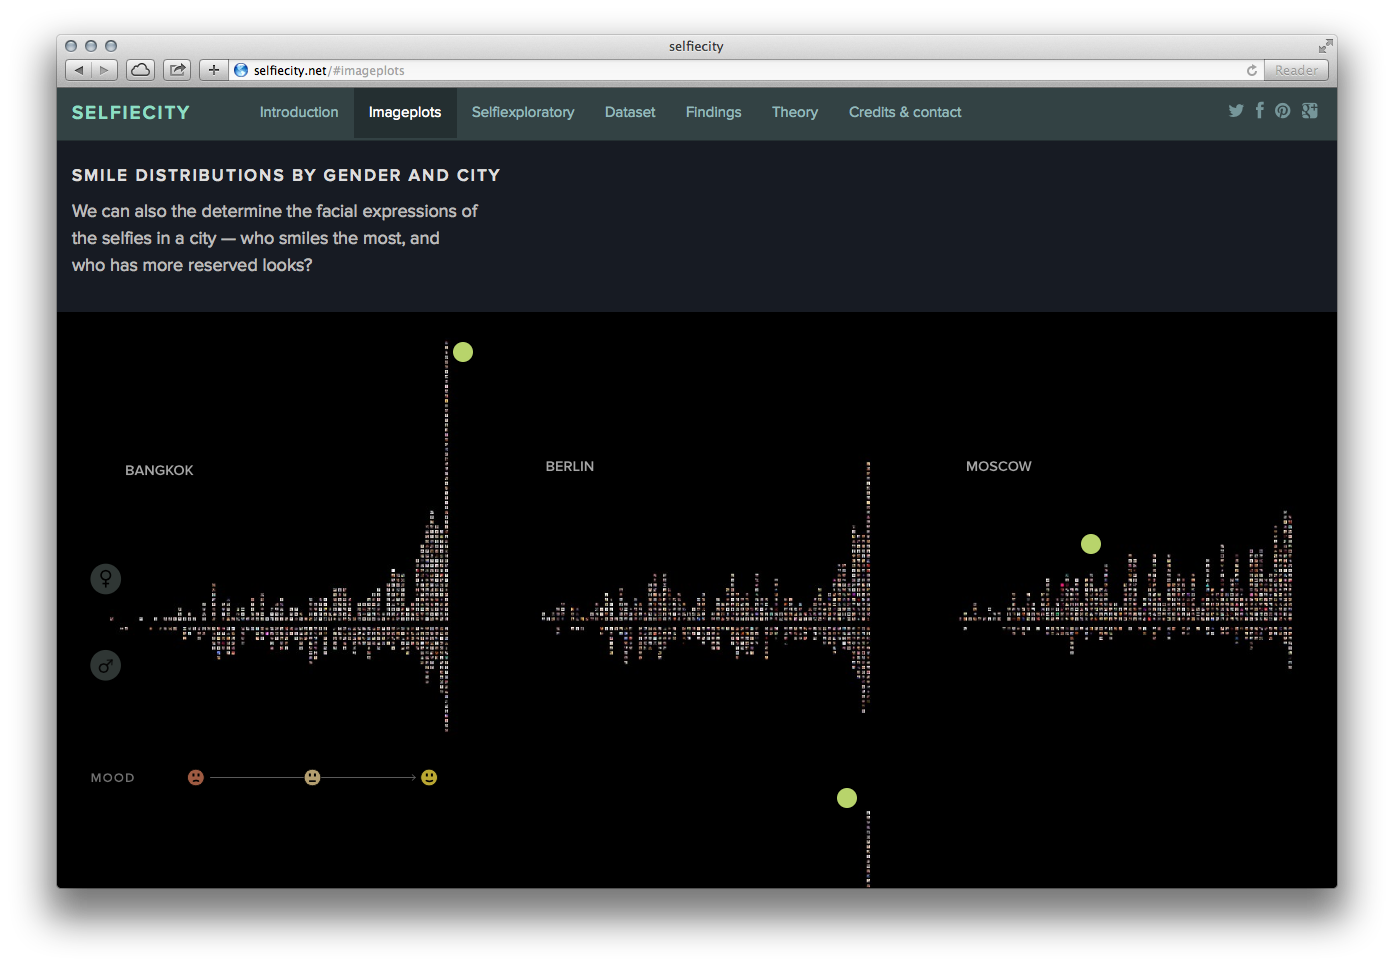
Selfie City
Lev Manovich / Software Studies Initiative
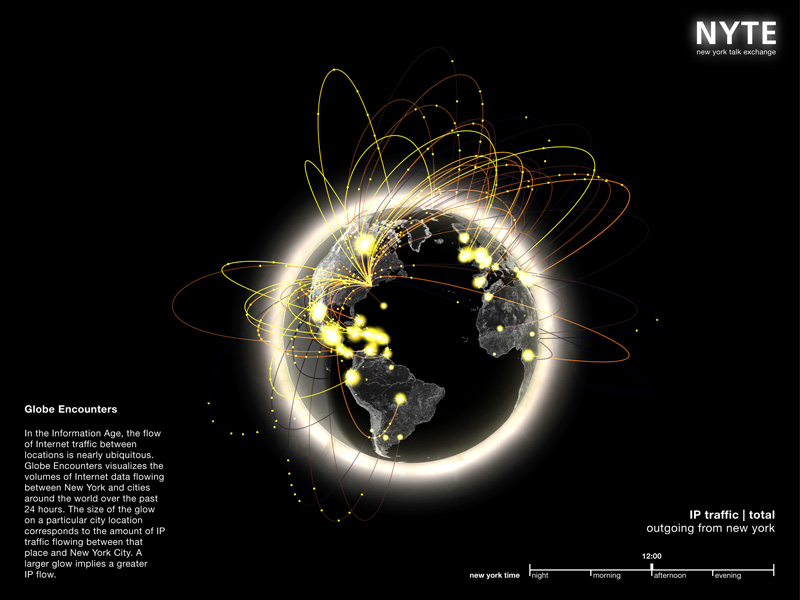
Senseable City Lab New York Talk Exchange
Senseable City Lab (with Aaron Koblin)
Senses Toolkit
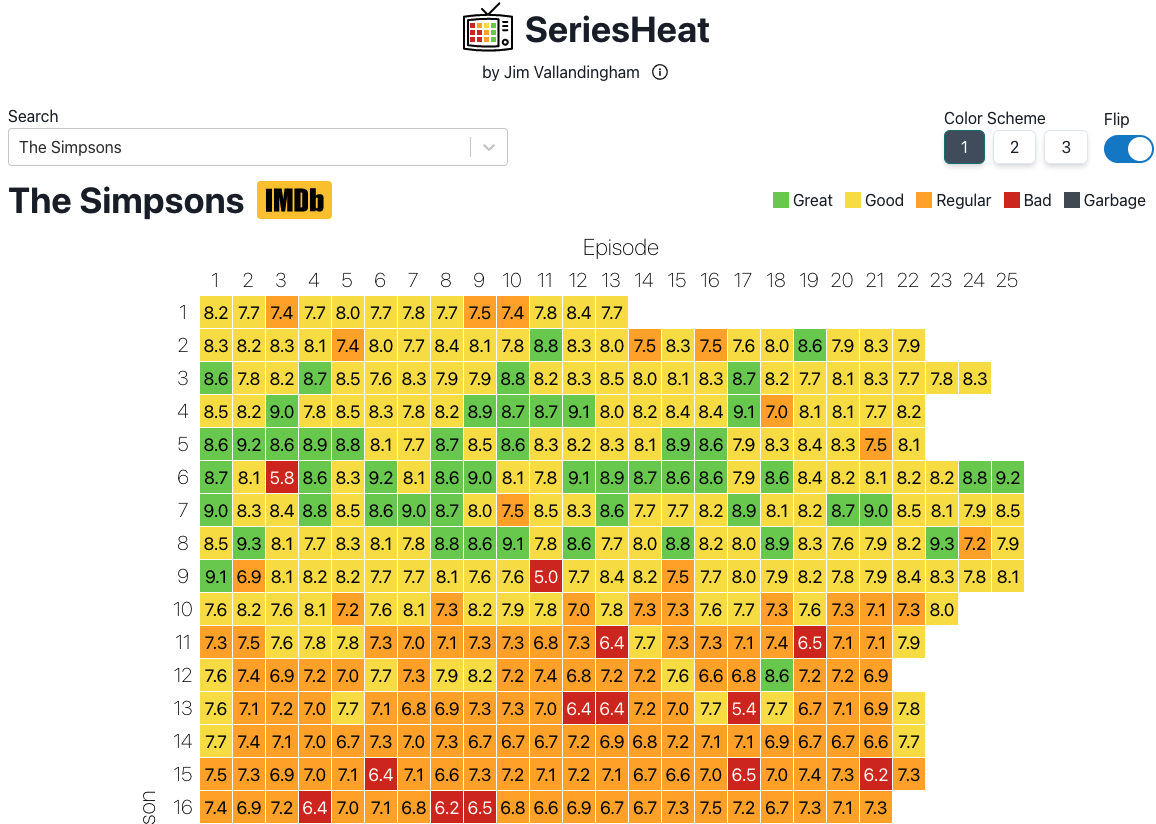
Series Heat

SFMoMA Artscope
Stamen Design
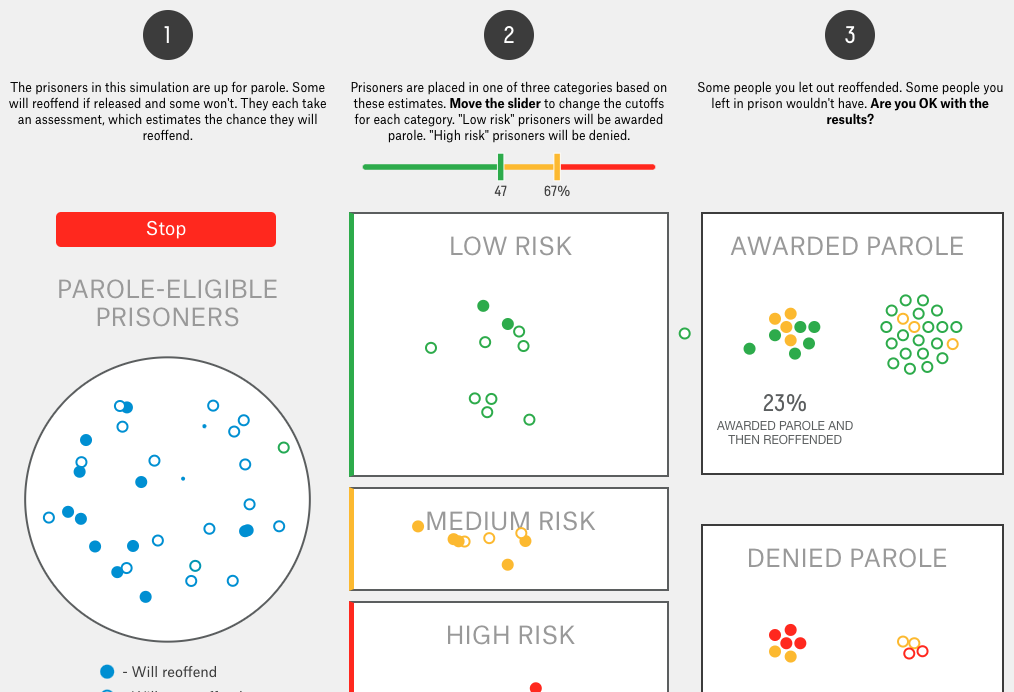
Should Prison Sentences Be Based on Crimes That Haven’t Been Committed yet?
538
Singapore Calling
MIT
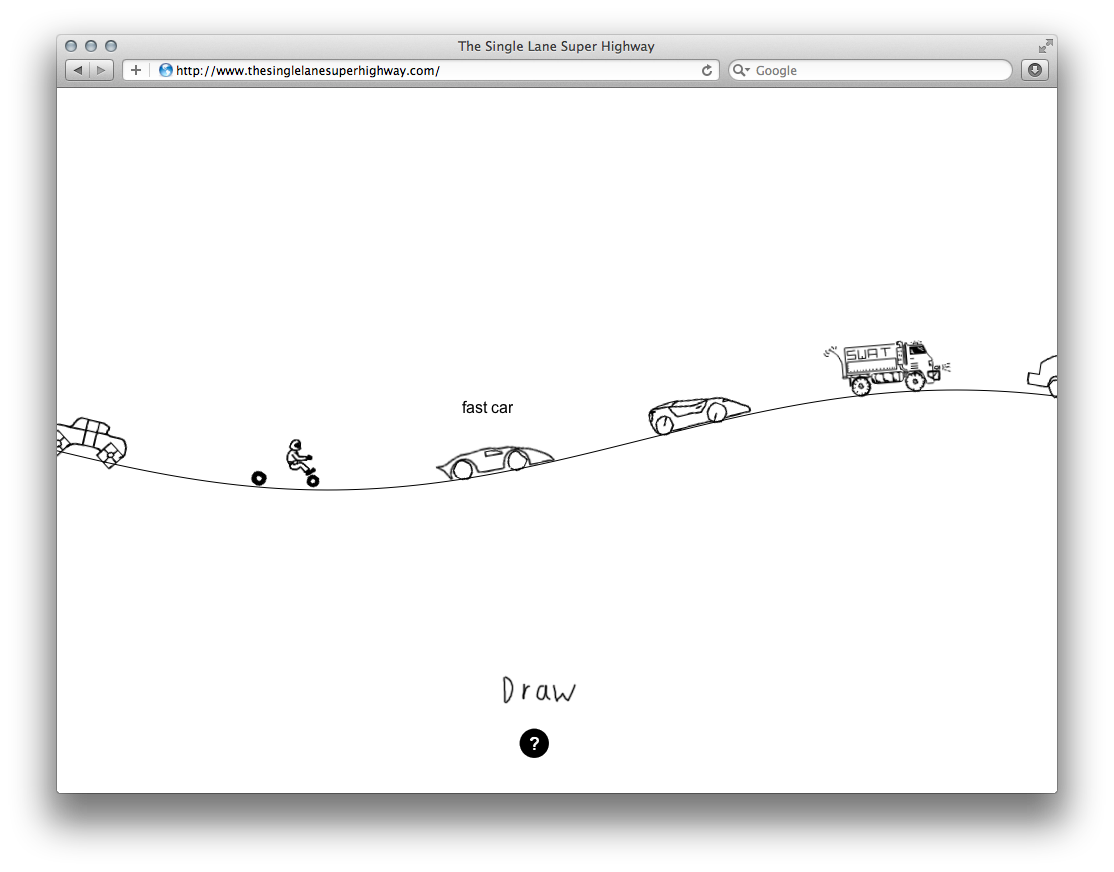
Single Lane Superhighway
Aaron Koblin
Sitters Standers
Pudding

Skycatcher
Unknown

Smallest Effective Difference
Edward Tufte
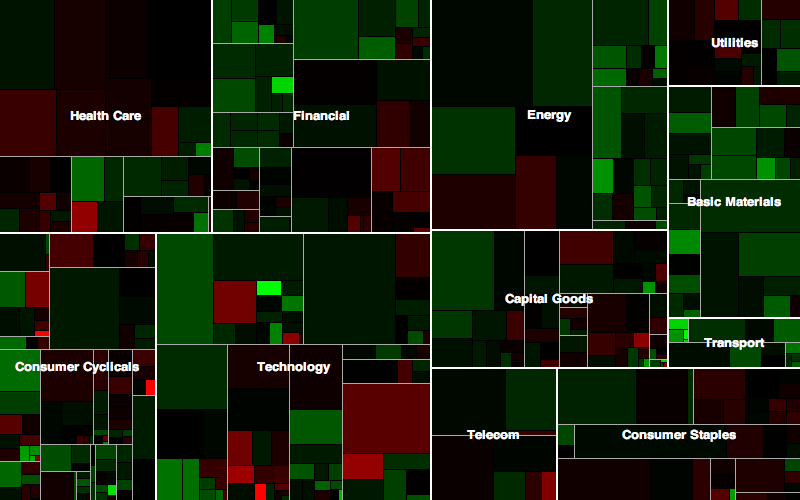
Smart Money Market Map
Martin Wattenberg
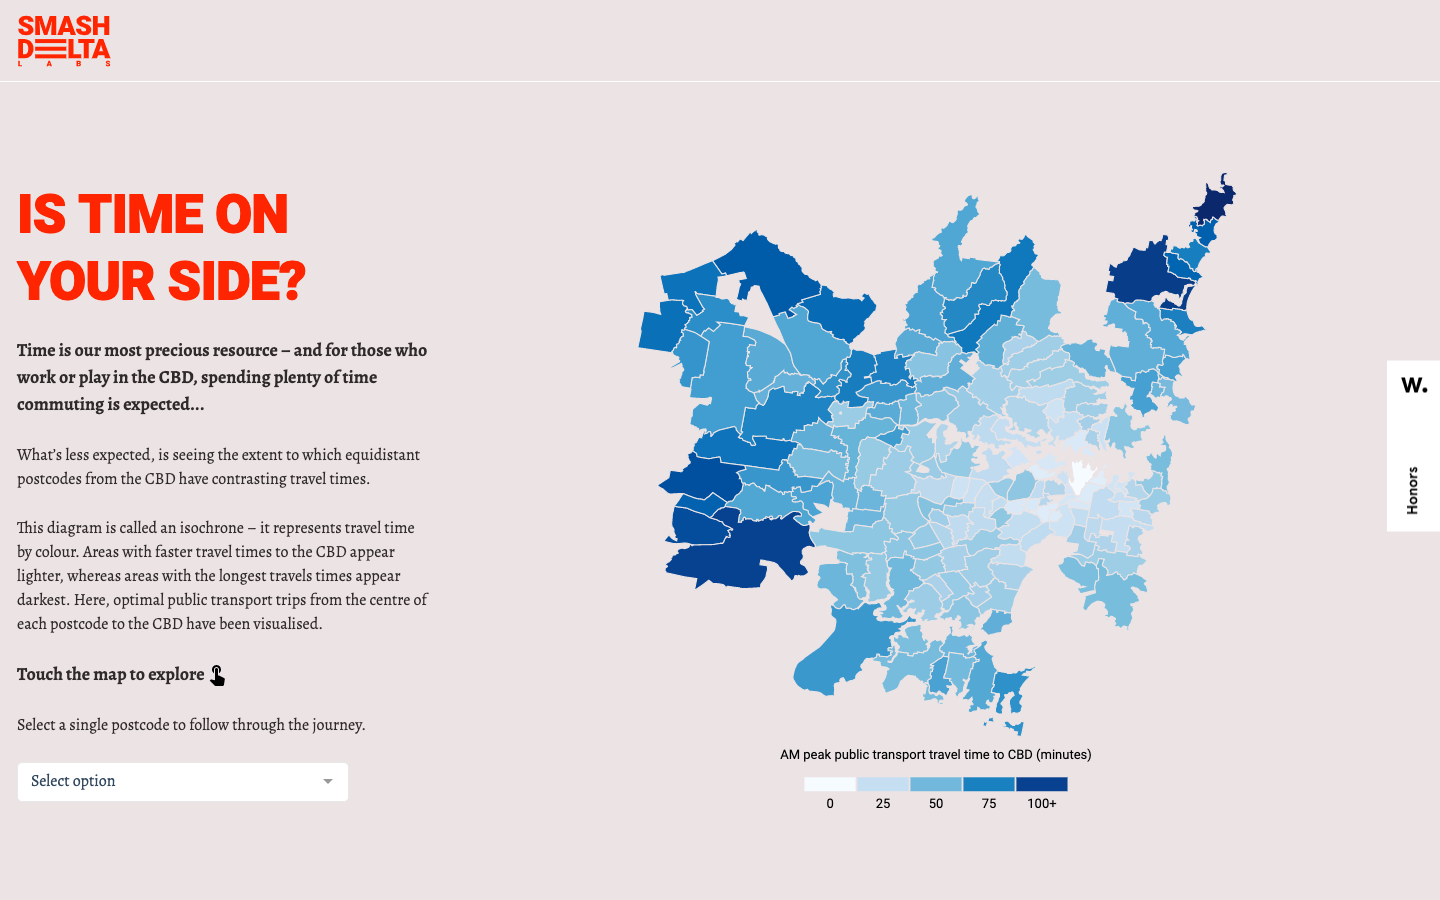
Smash Smart Cities
Snow Cholera Map (Tufte)
Edward Tufte / John Snow

So Voted Switzerland
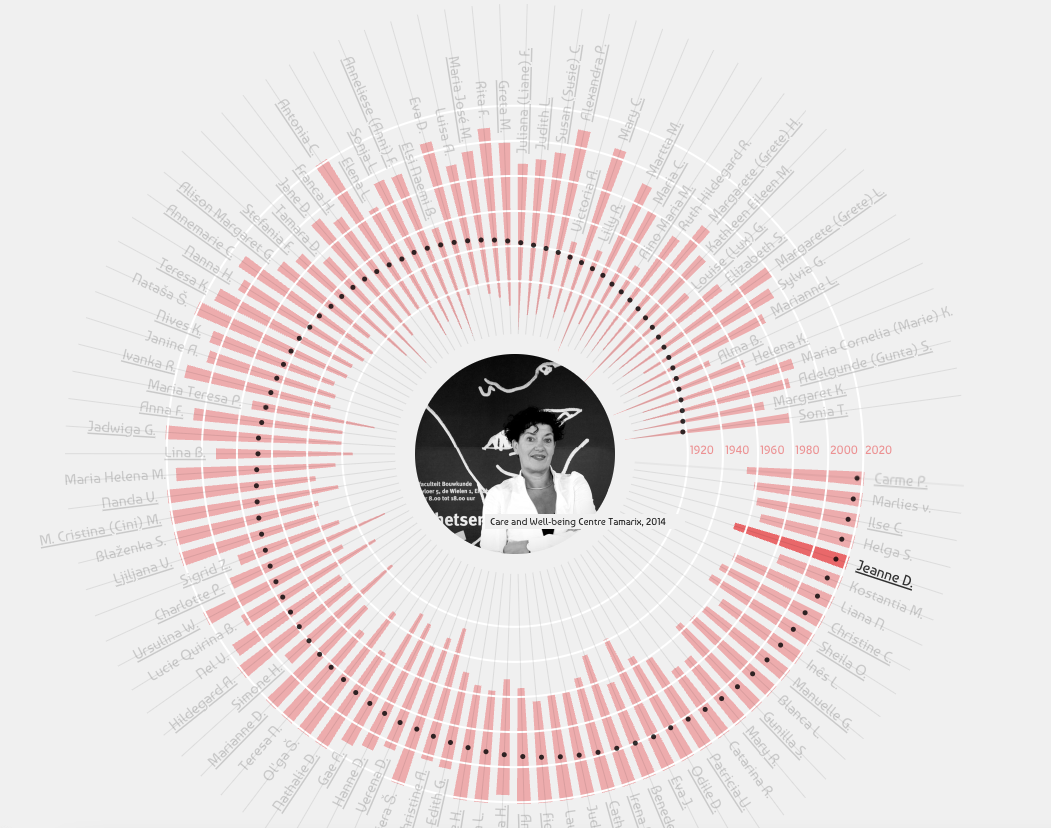
Some of the Women Architects & Designers I Didn't Hear About at University
Observable
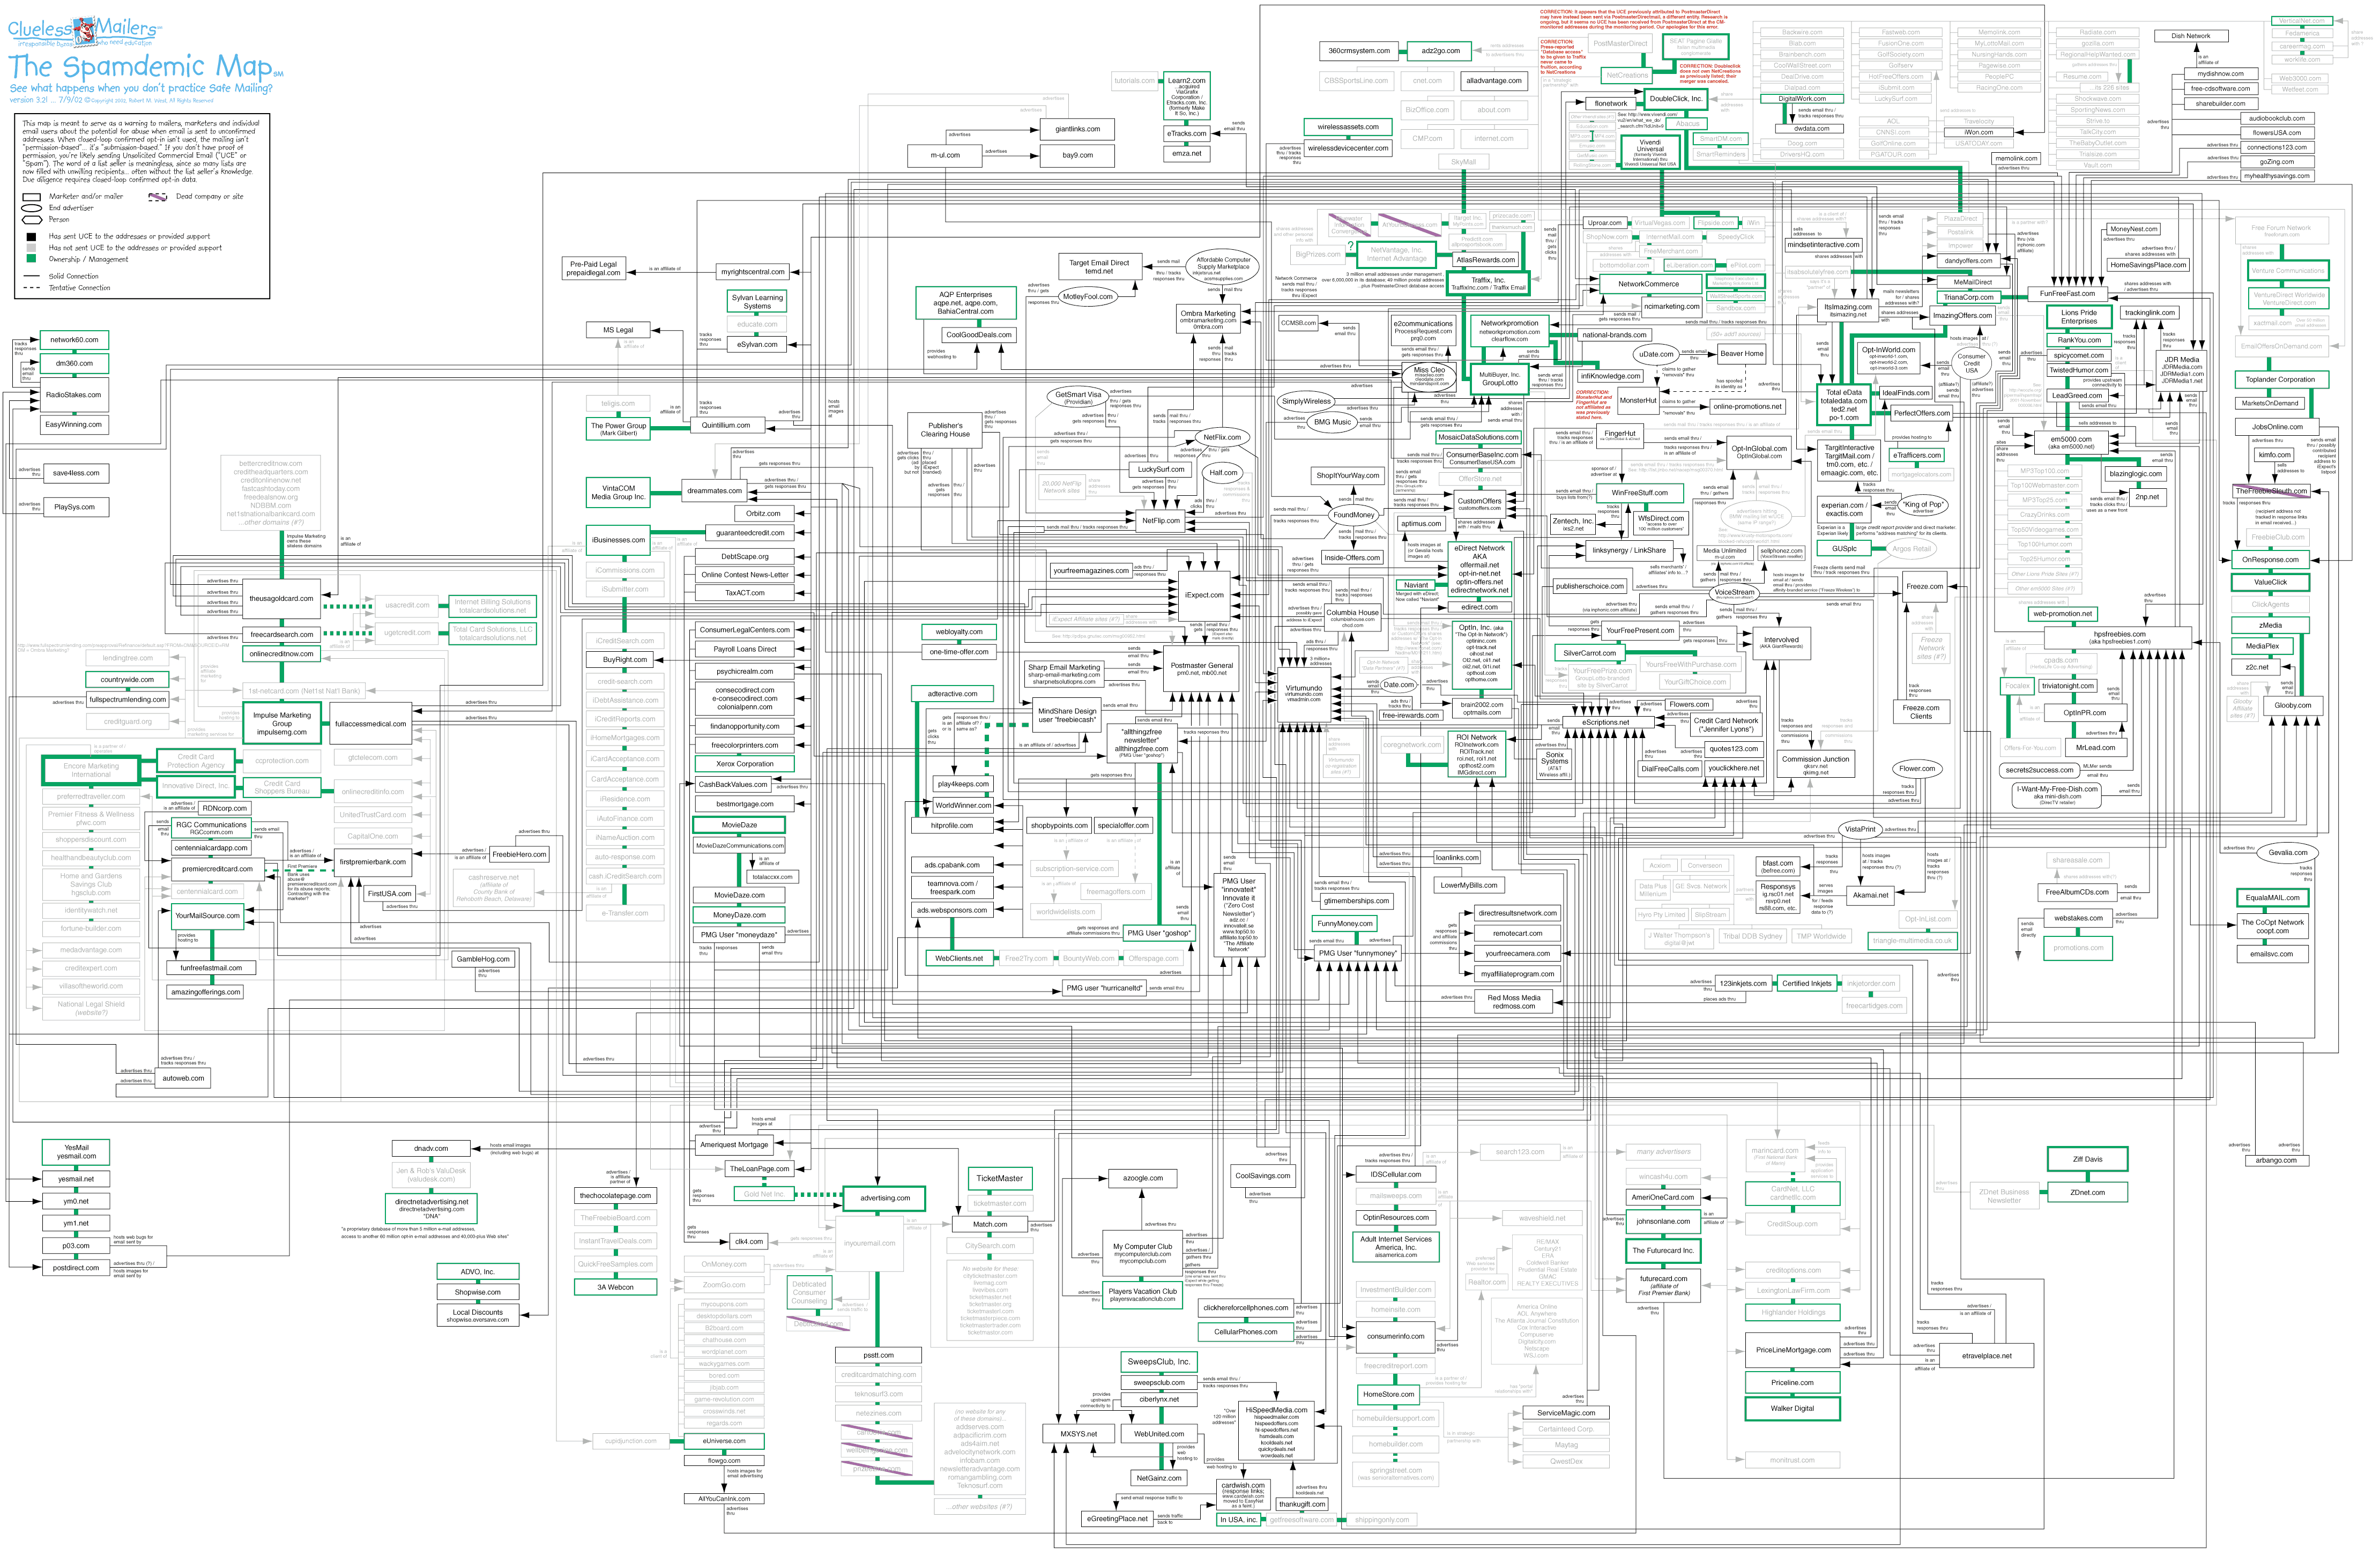
Spamdemic Map
Clueless Mailers
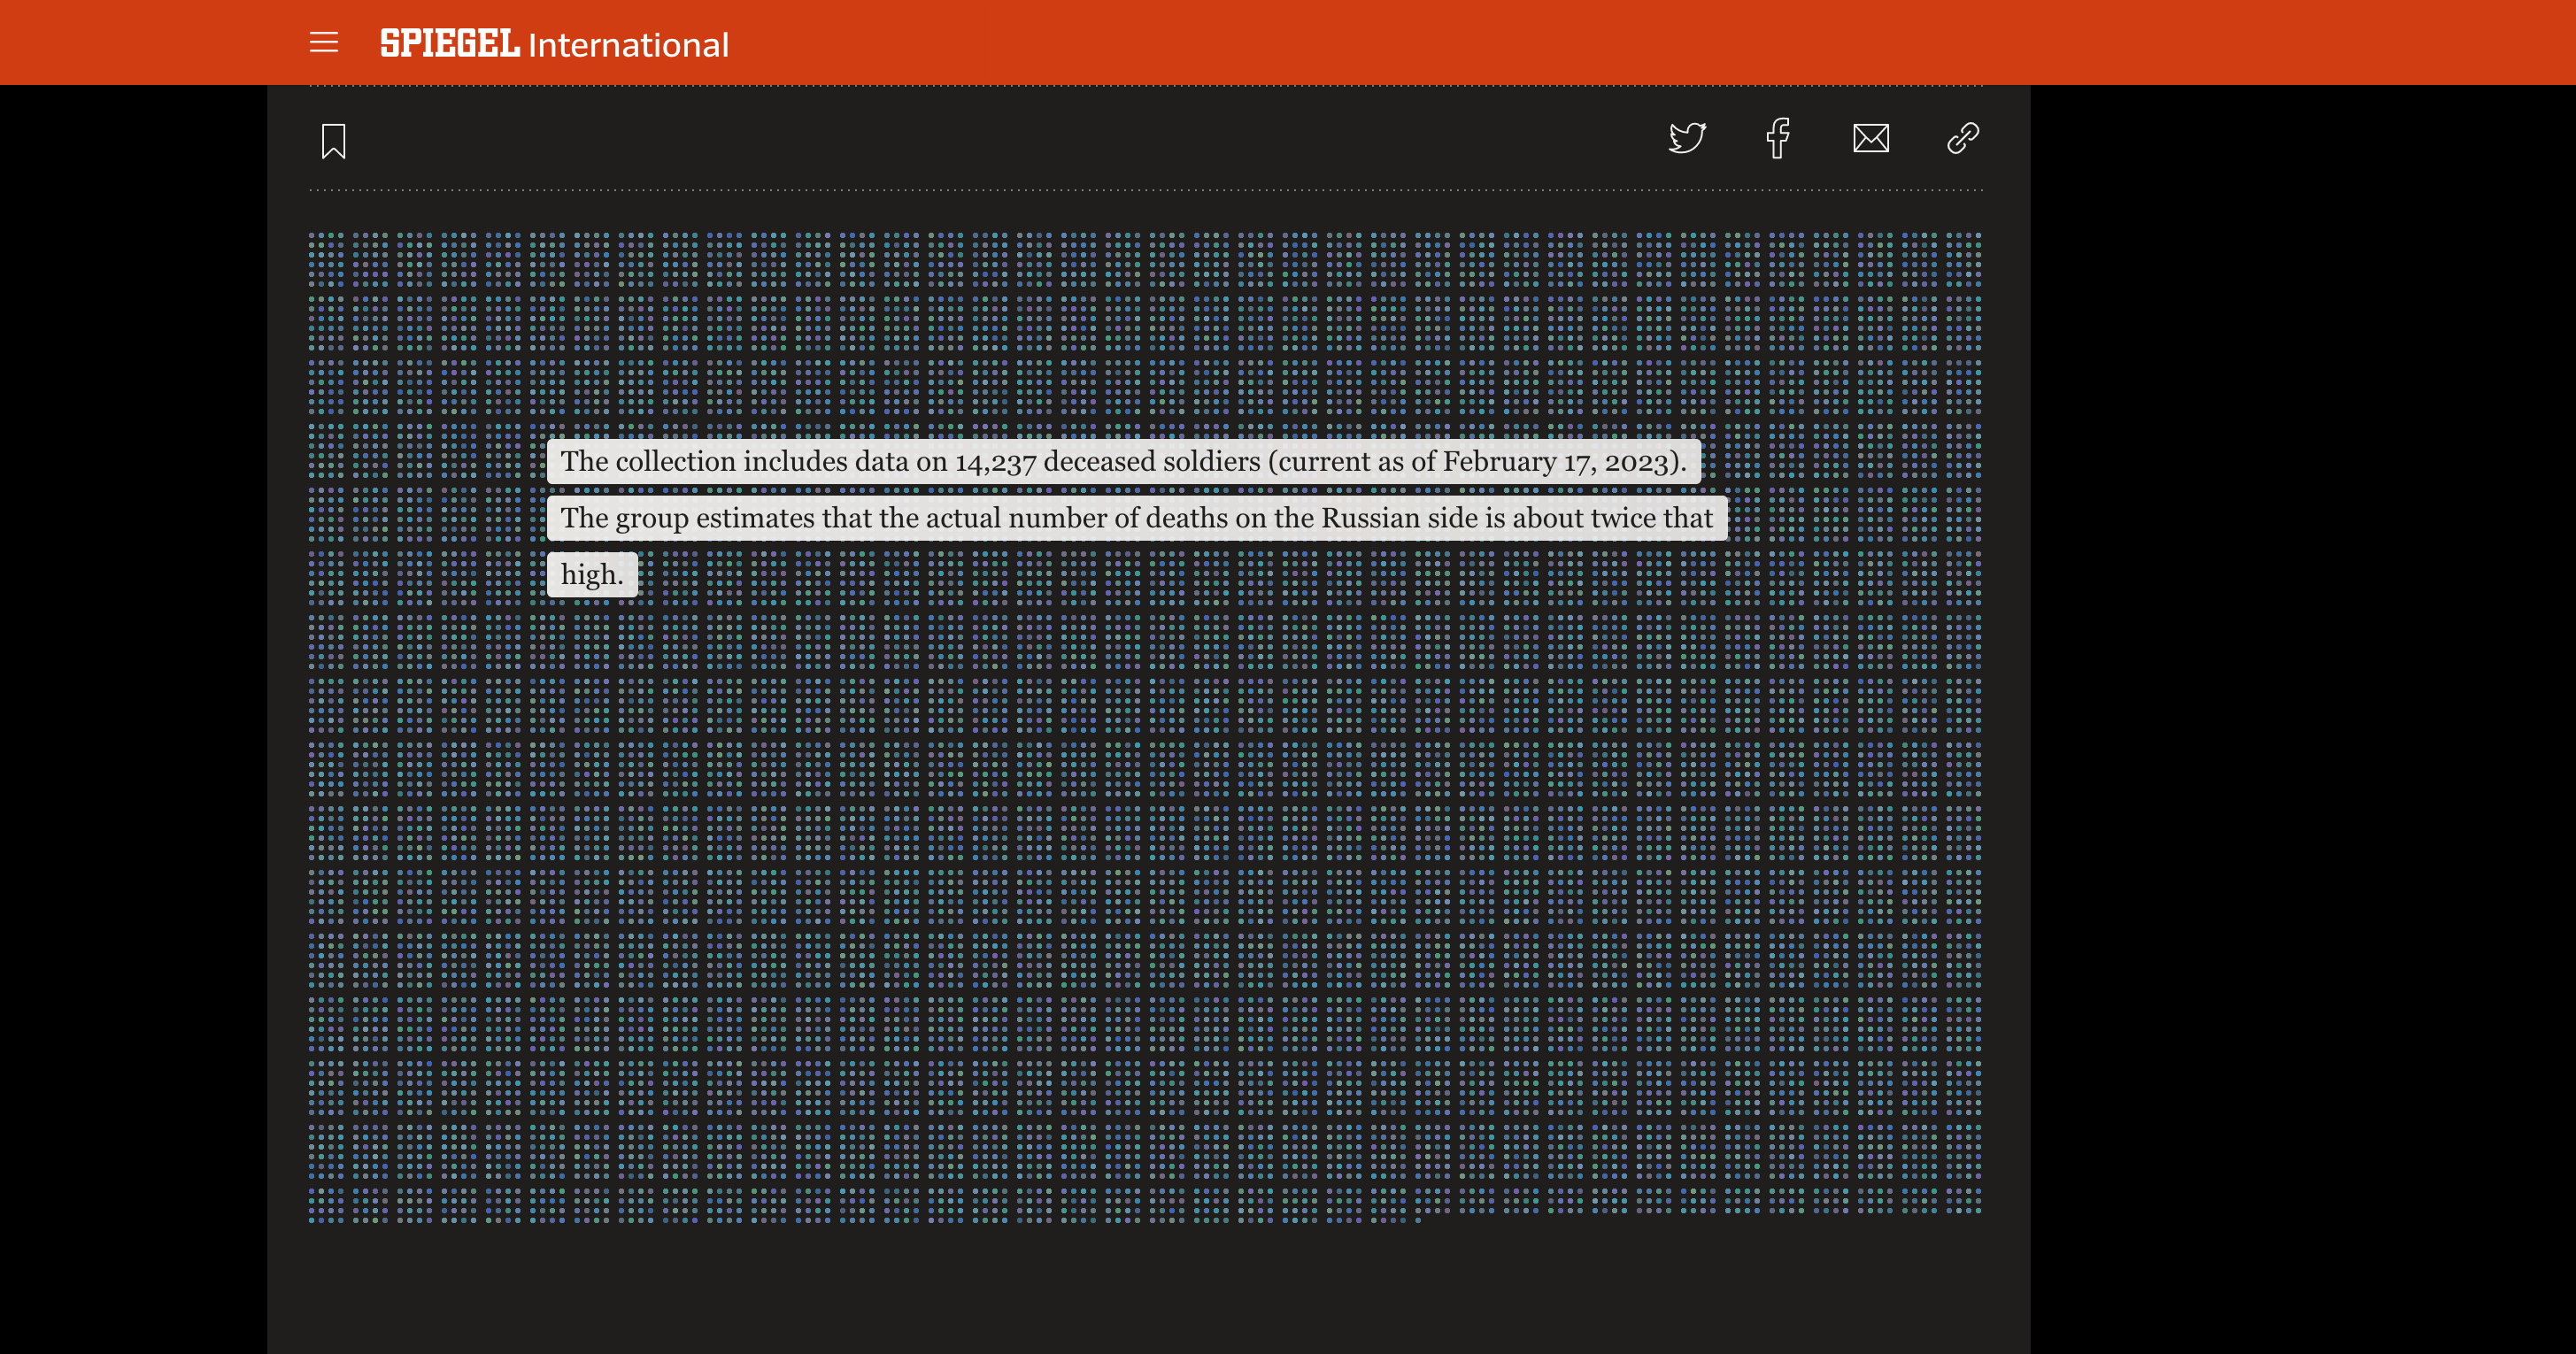
Spiegel International / the Deaths Putin is Seeking to Keep Quiet
Der Spiegel
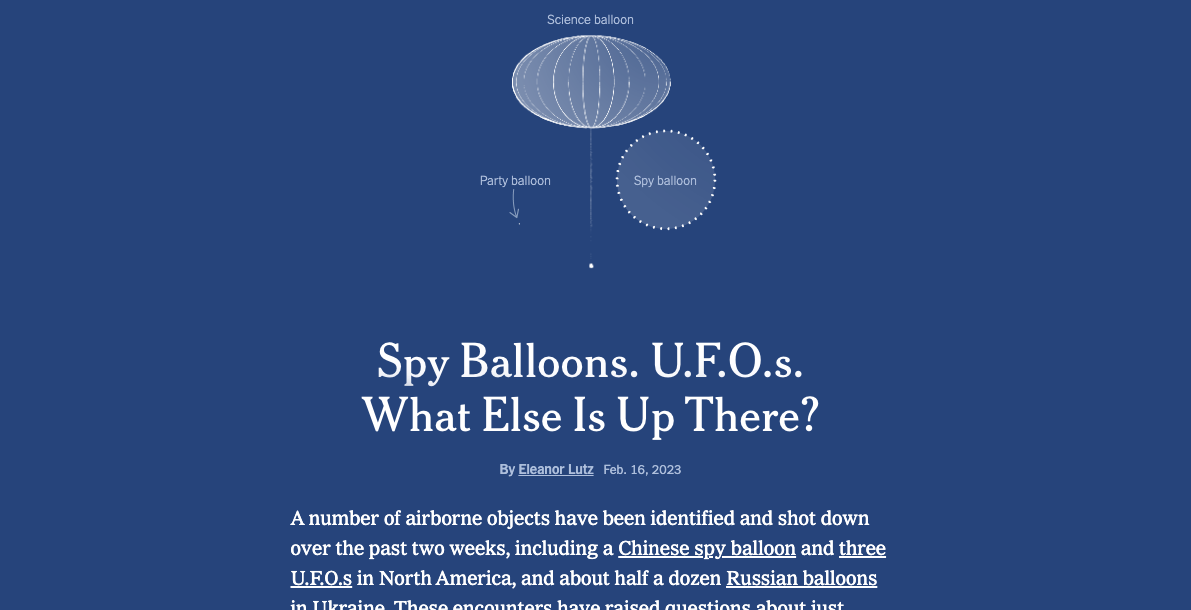
Spy Balloons. UFOs. What Else is Up There?
The New York Times
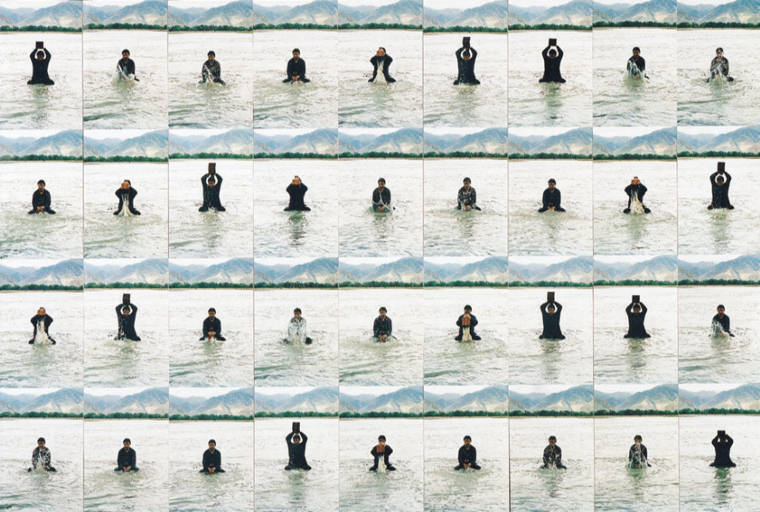
Stamping The Water
Song Dong
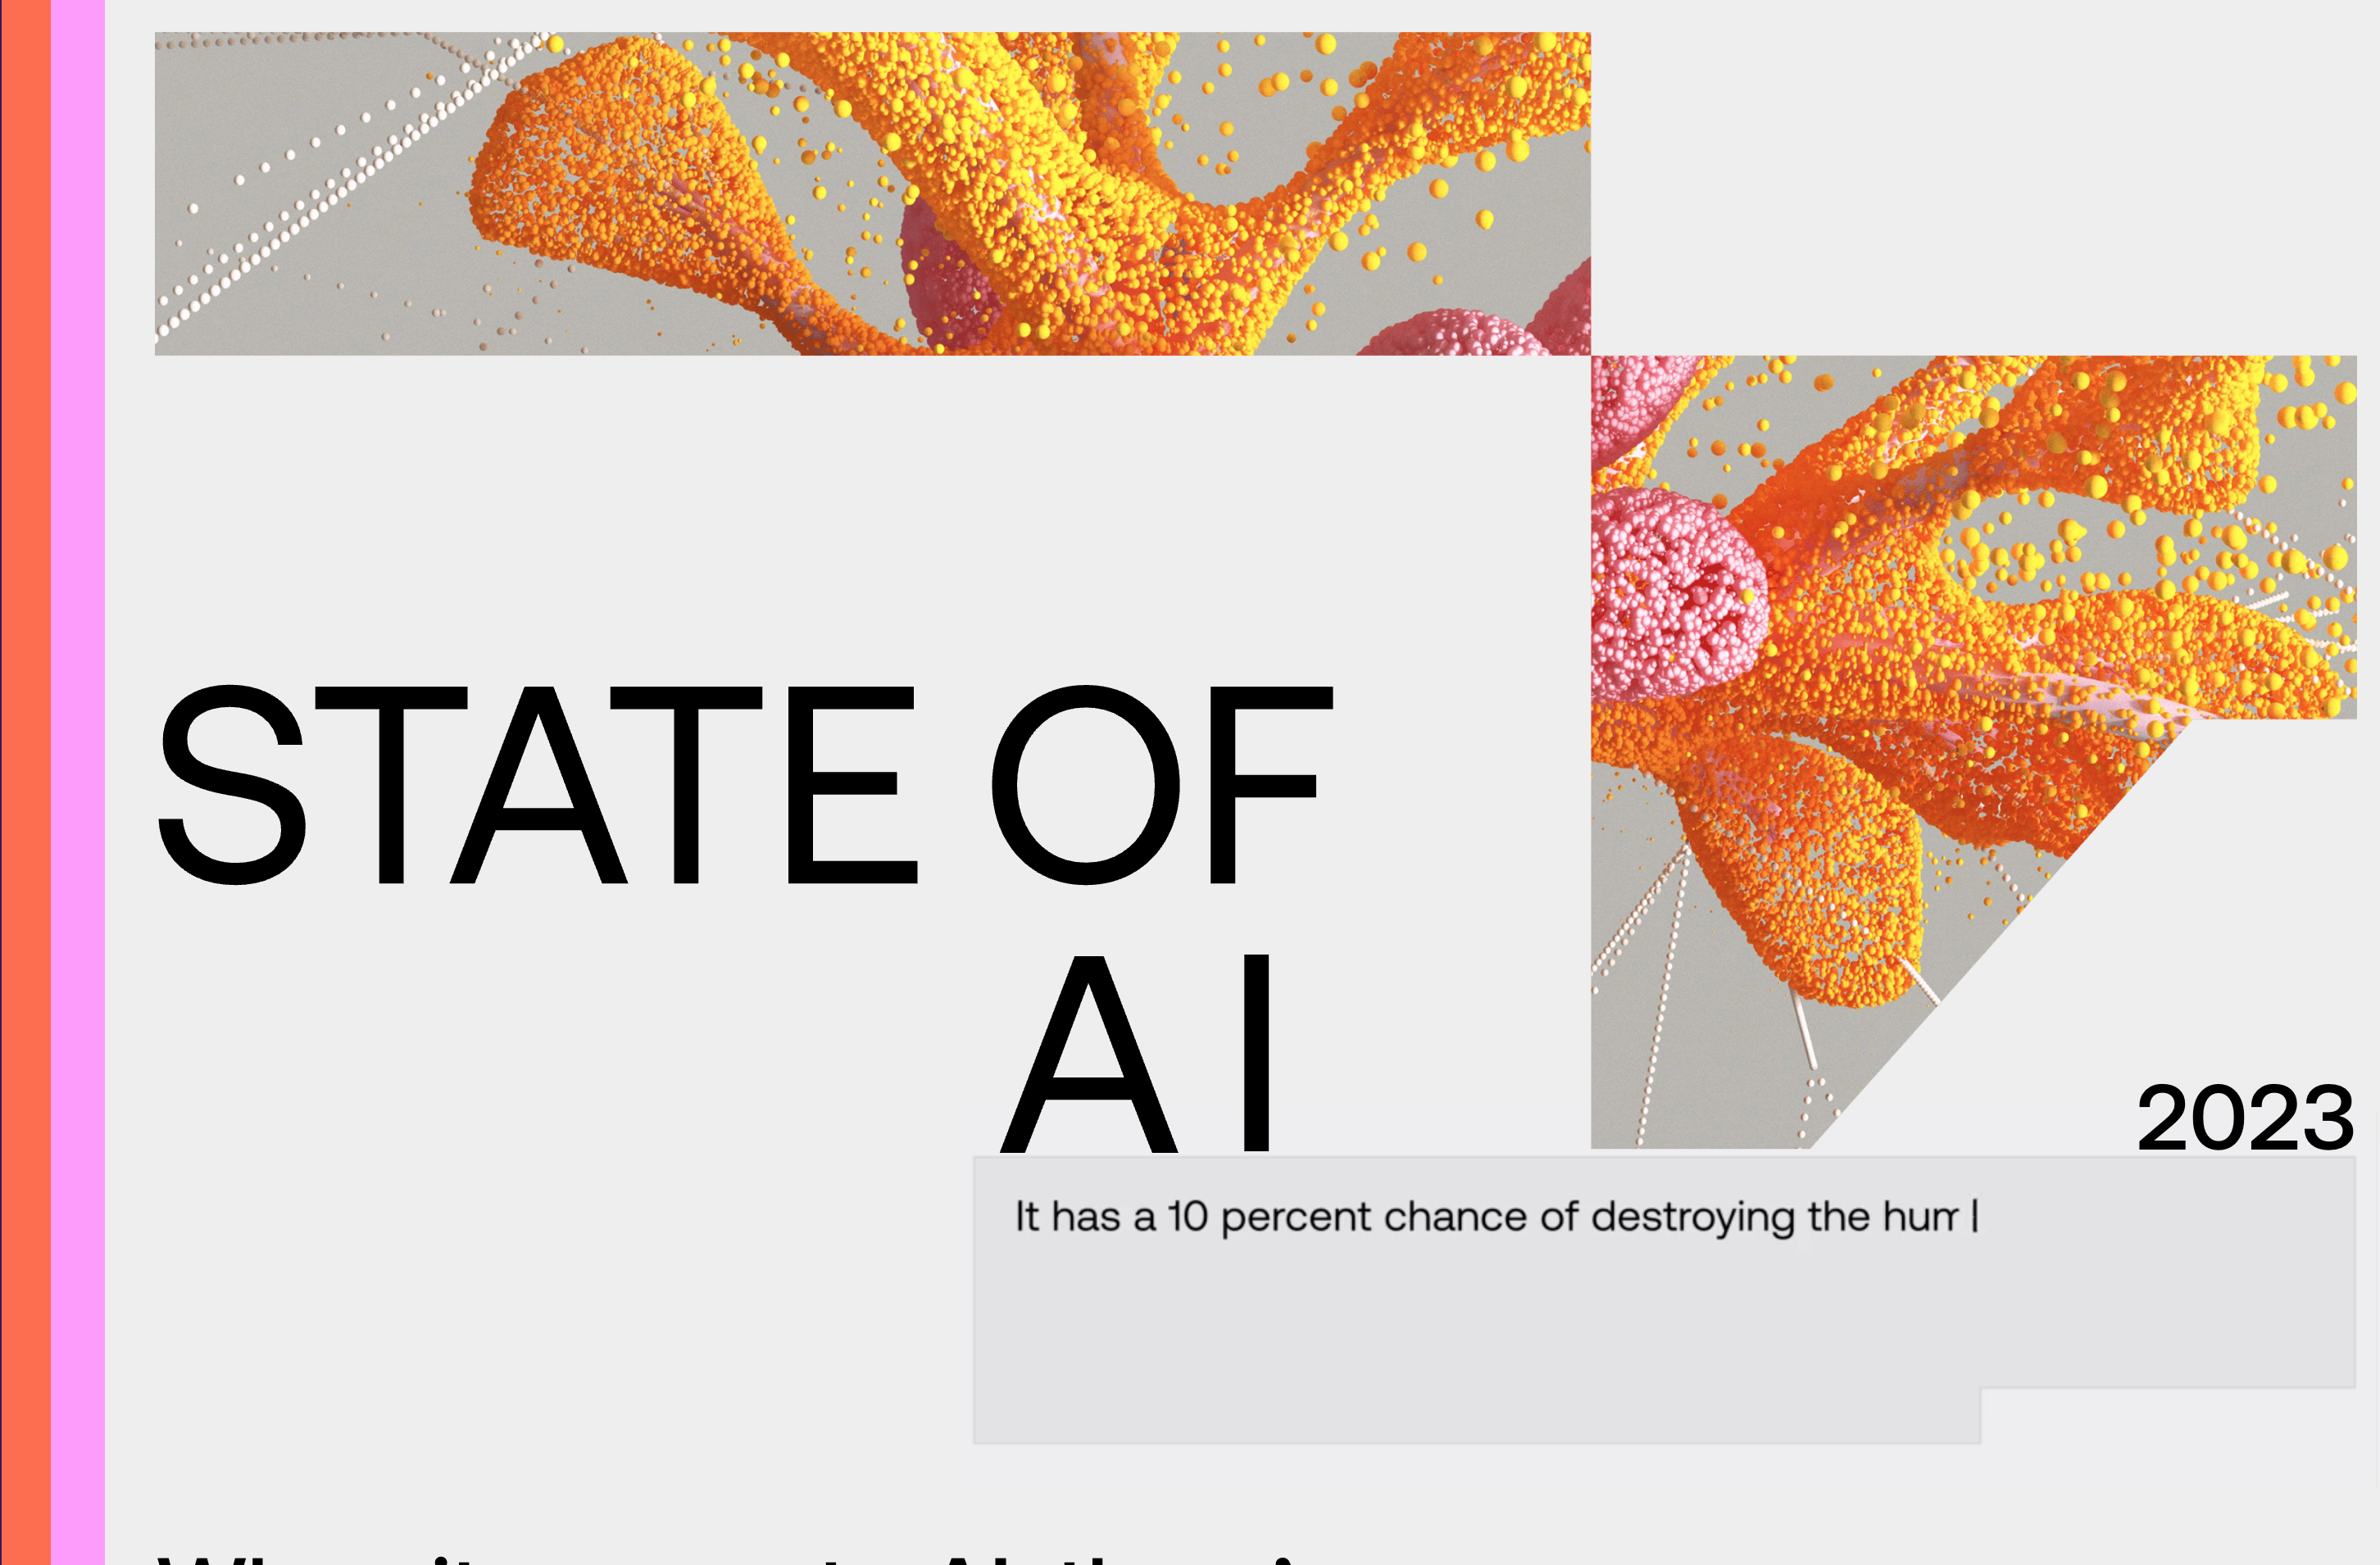
State of AI, 2023
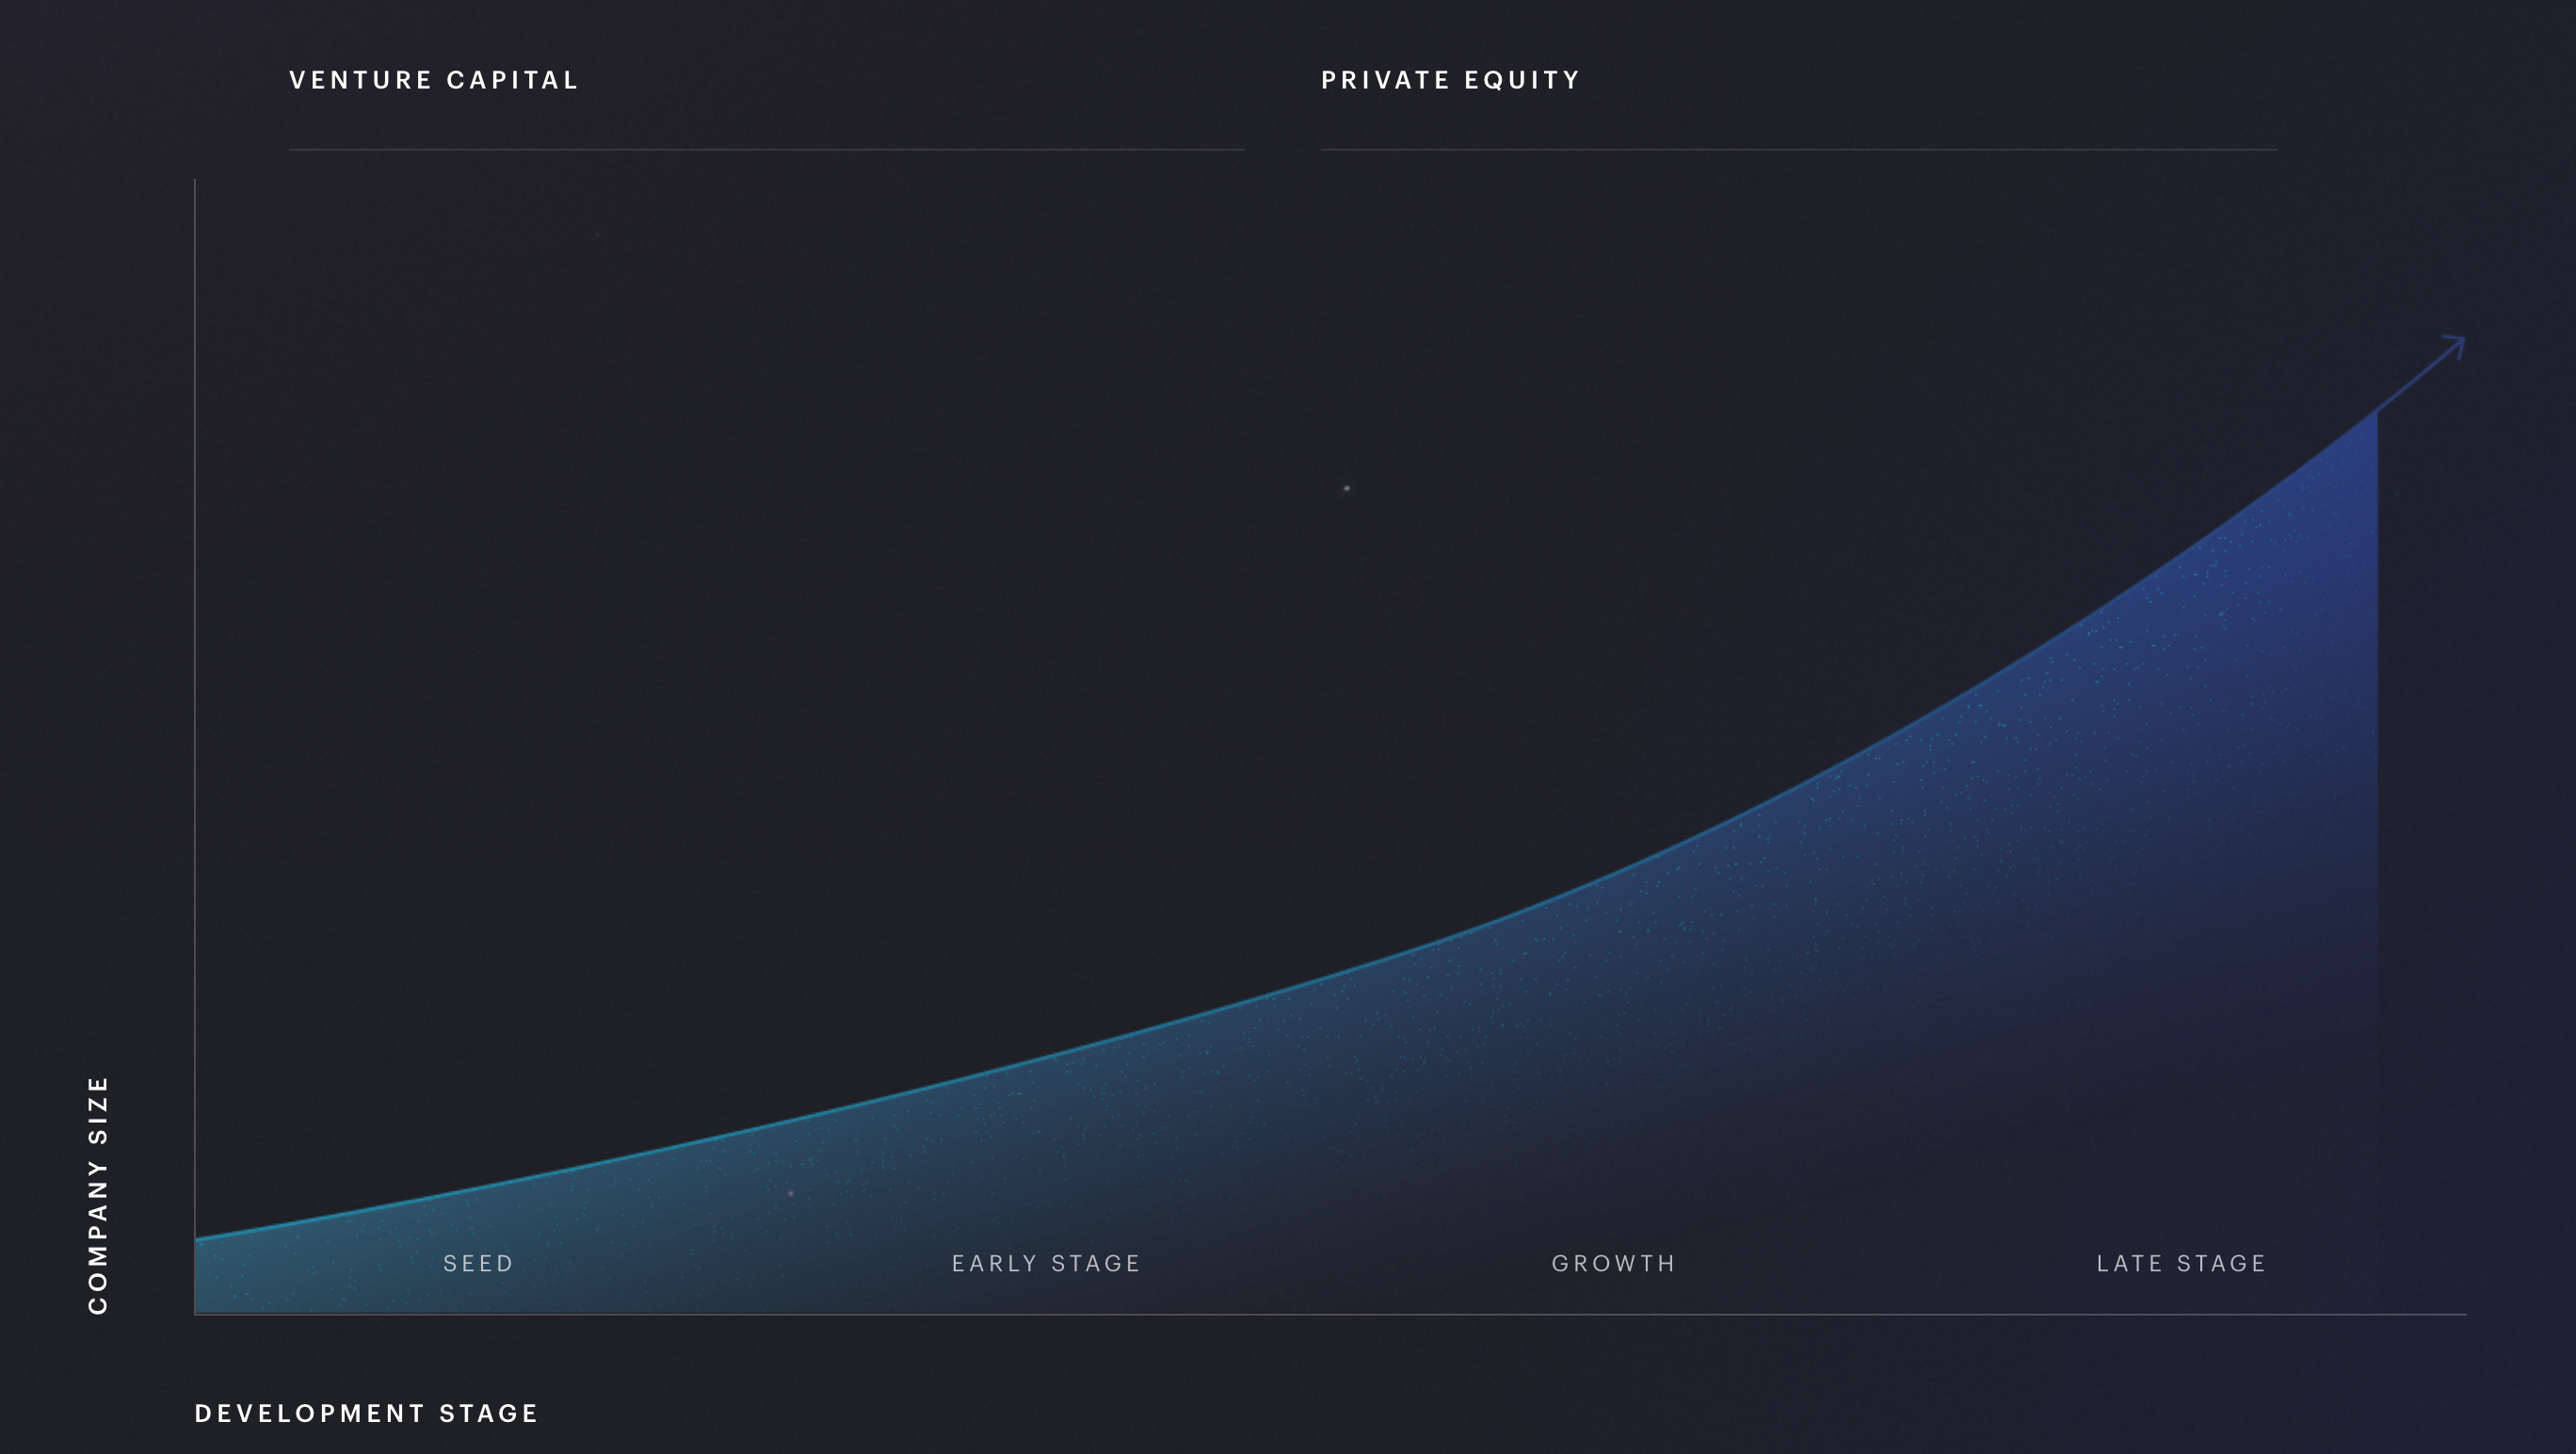
State of the Market
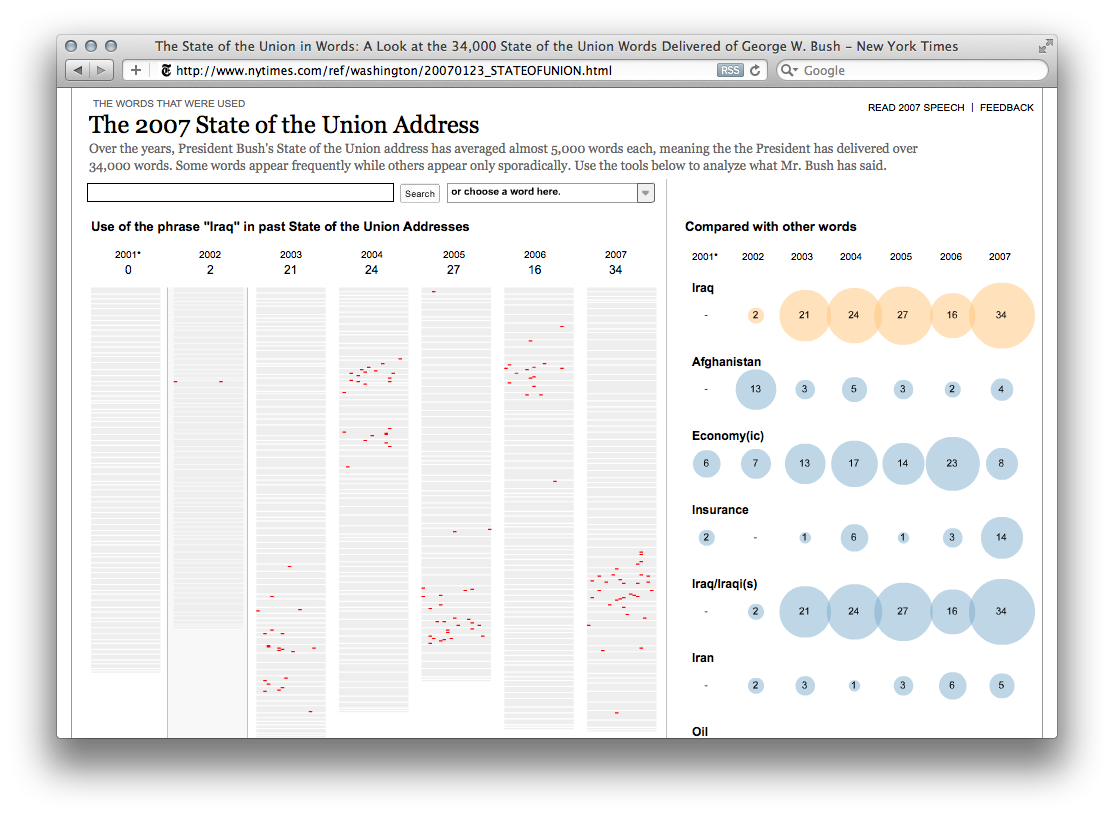
State of the Union Address
New York Times Graphics
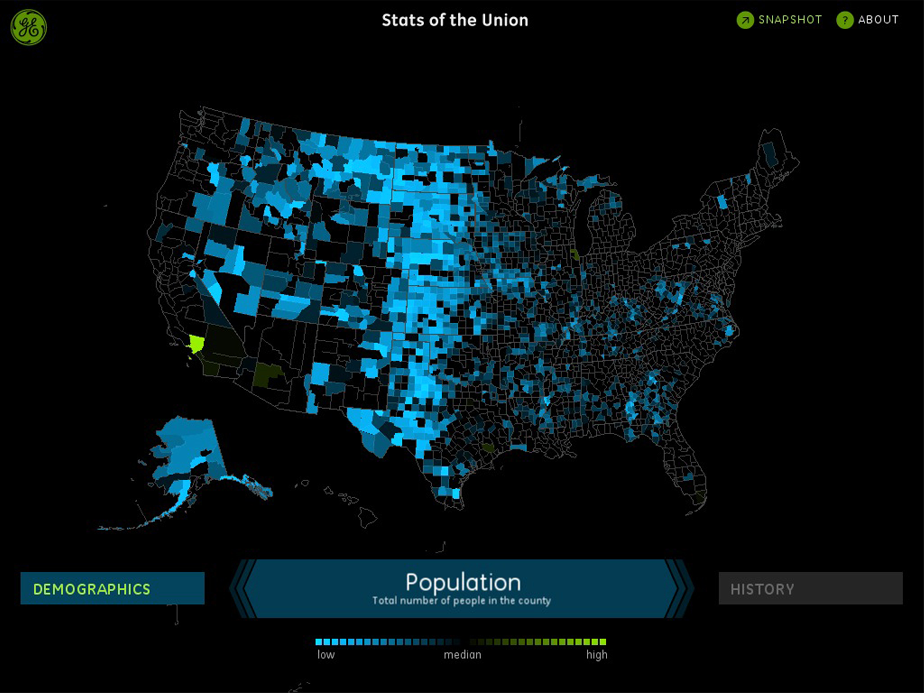
Stats of the Union
Fathom Information Design
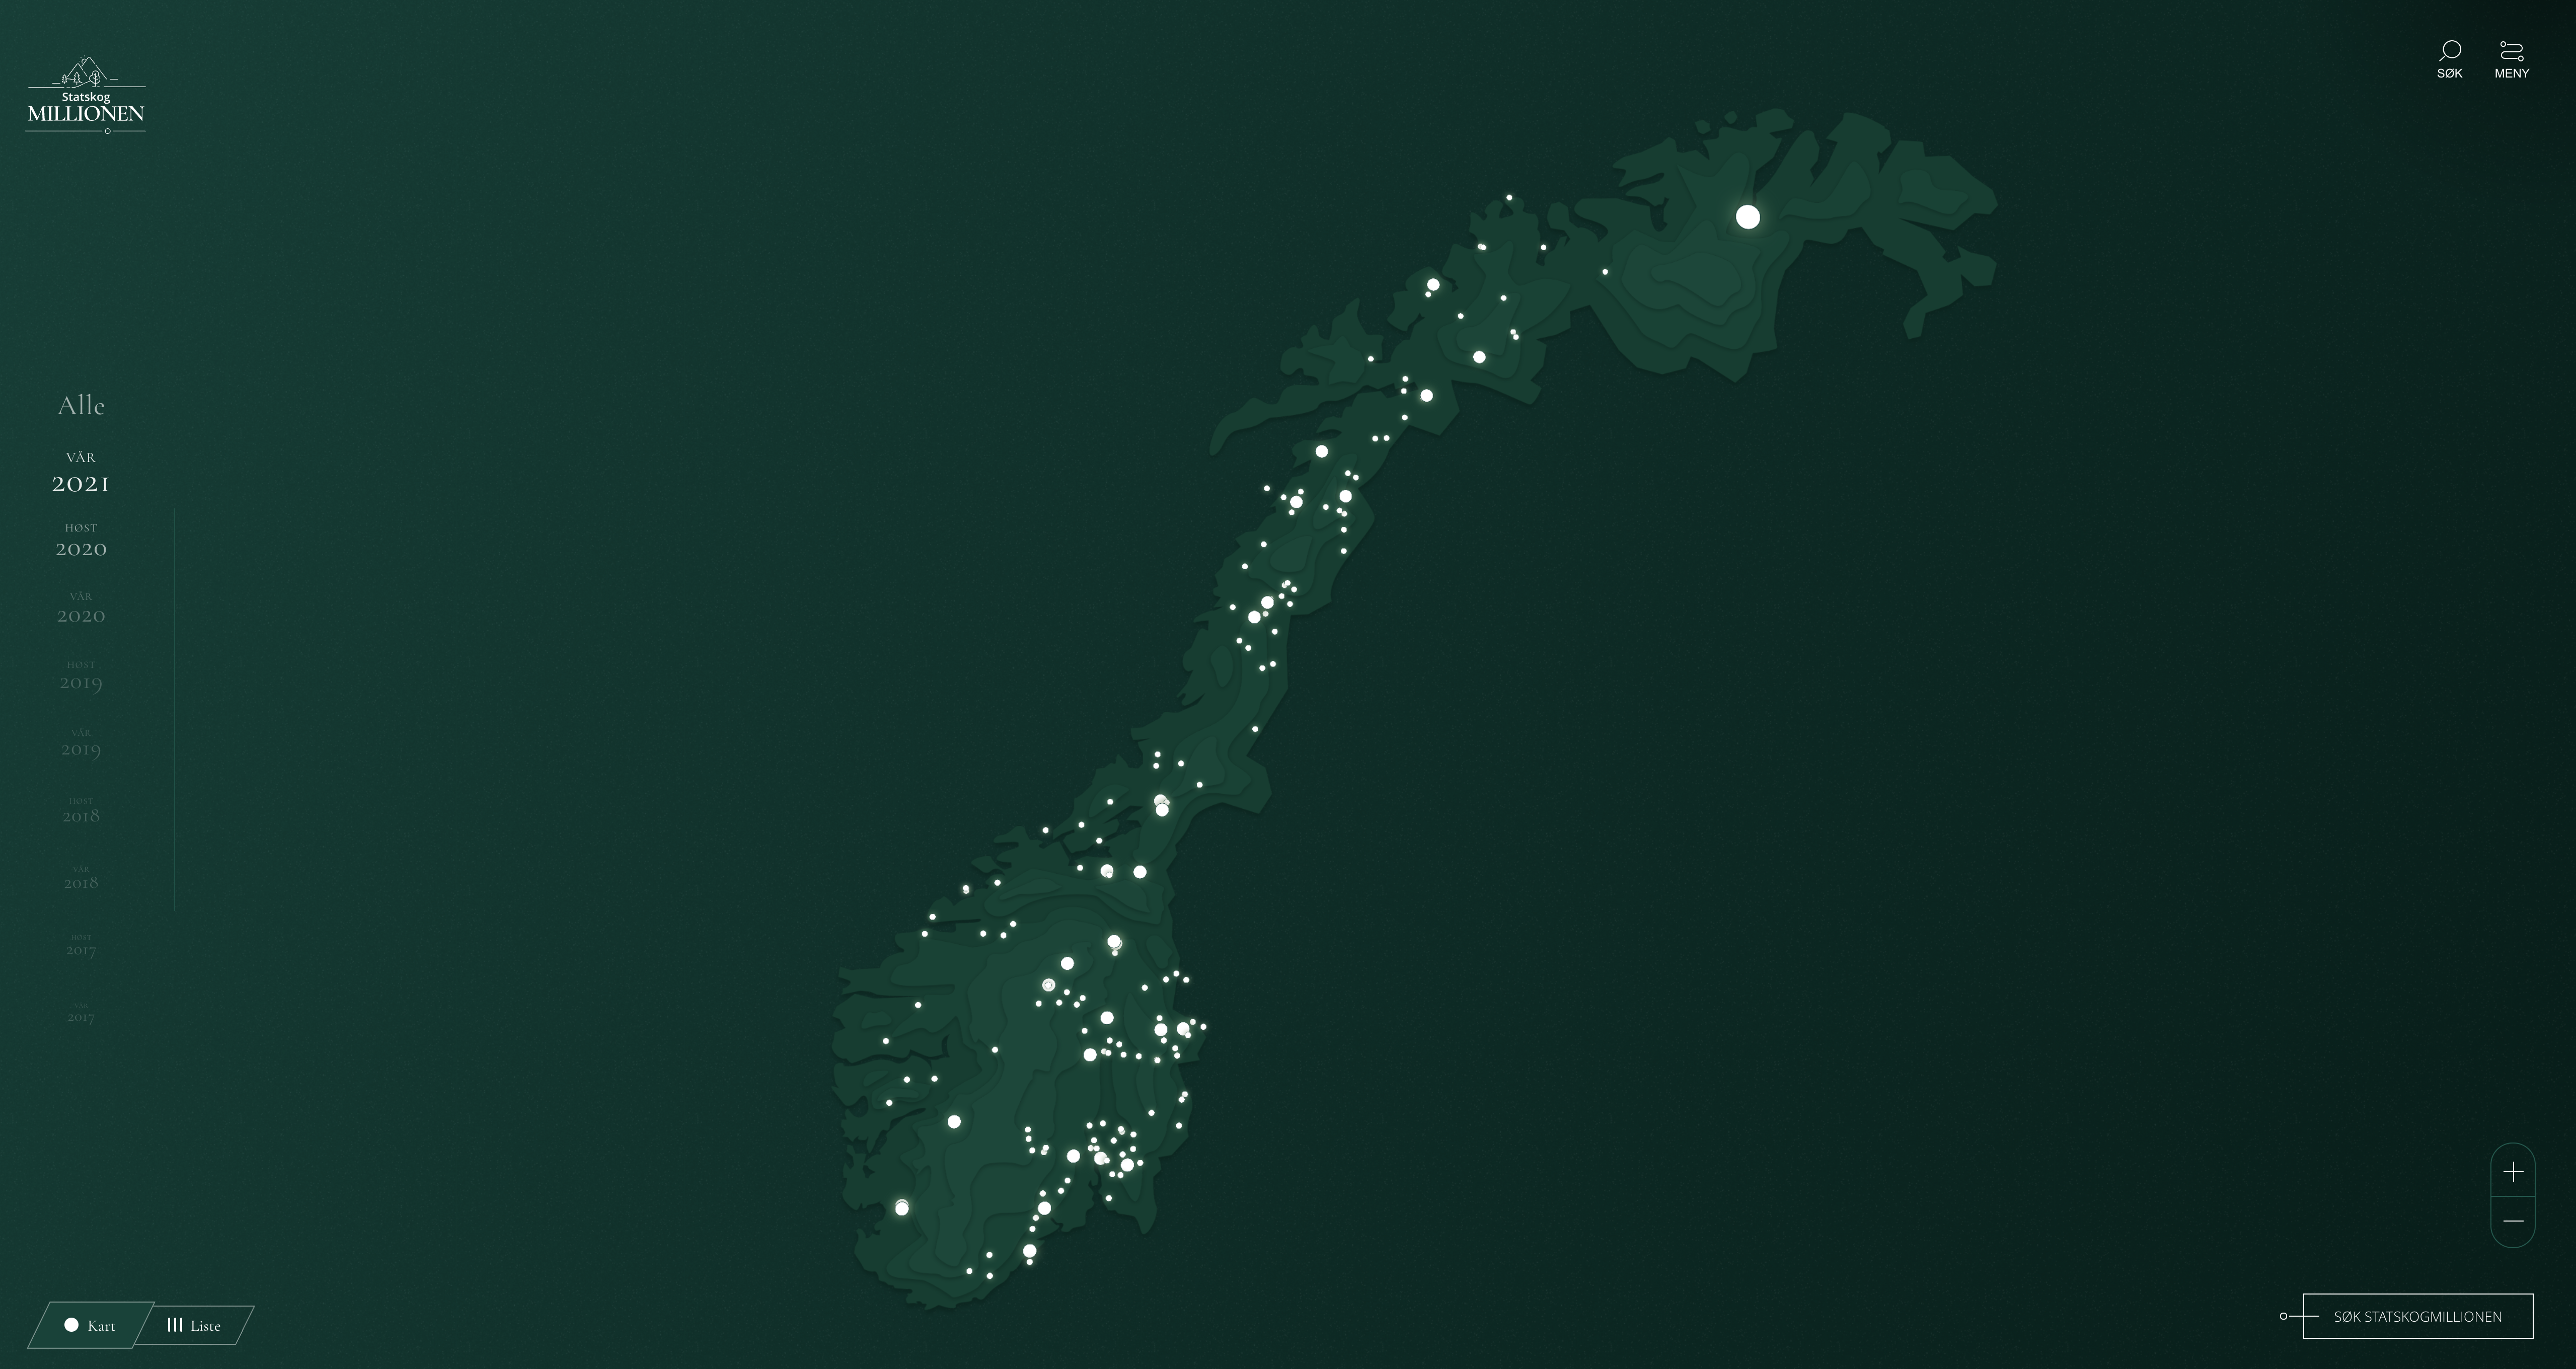
Statskog
Storm Visualization
Edward Tufte
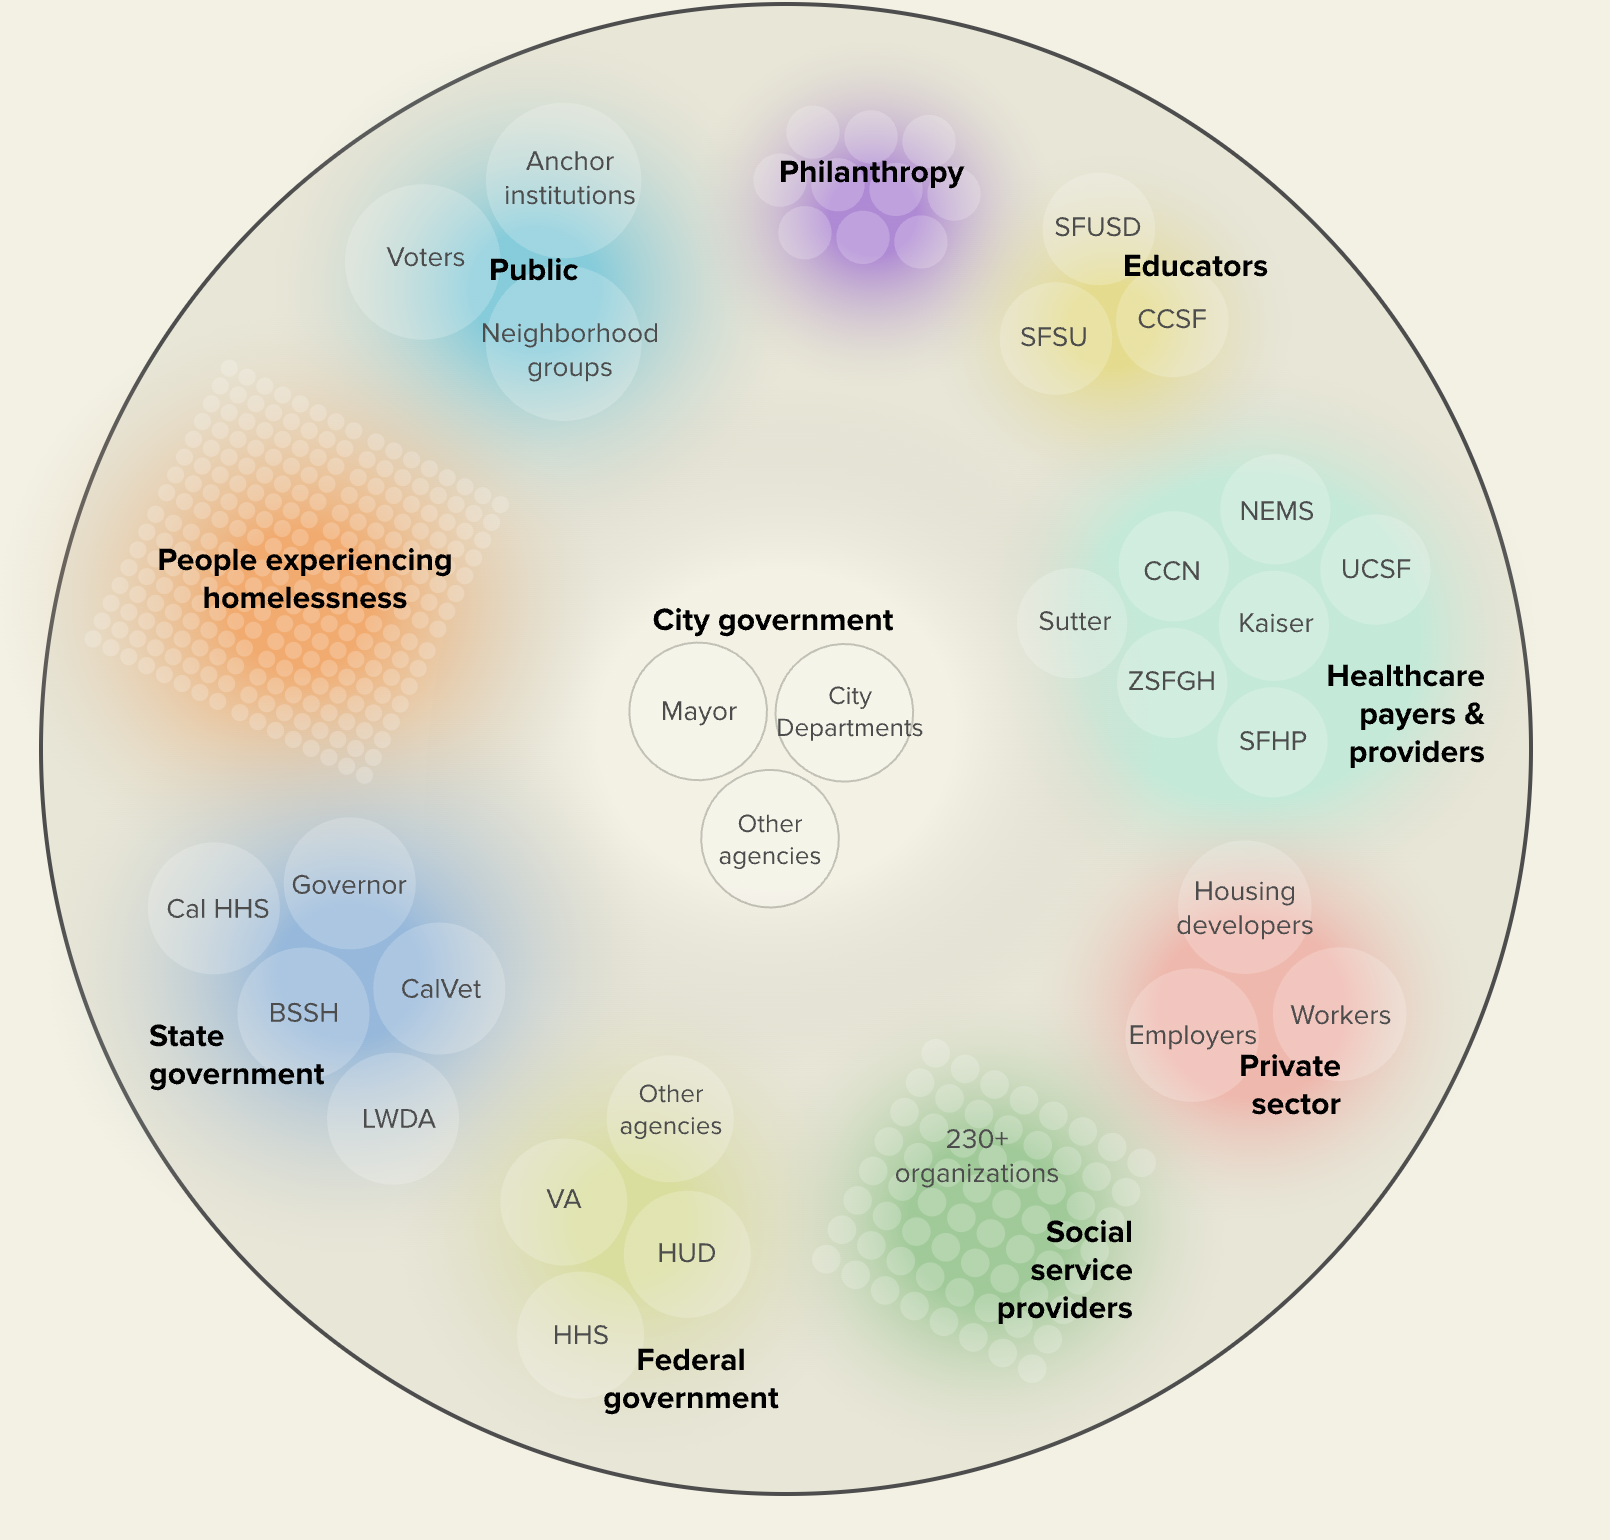
Streets to Stability
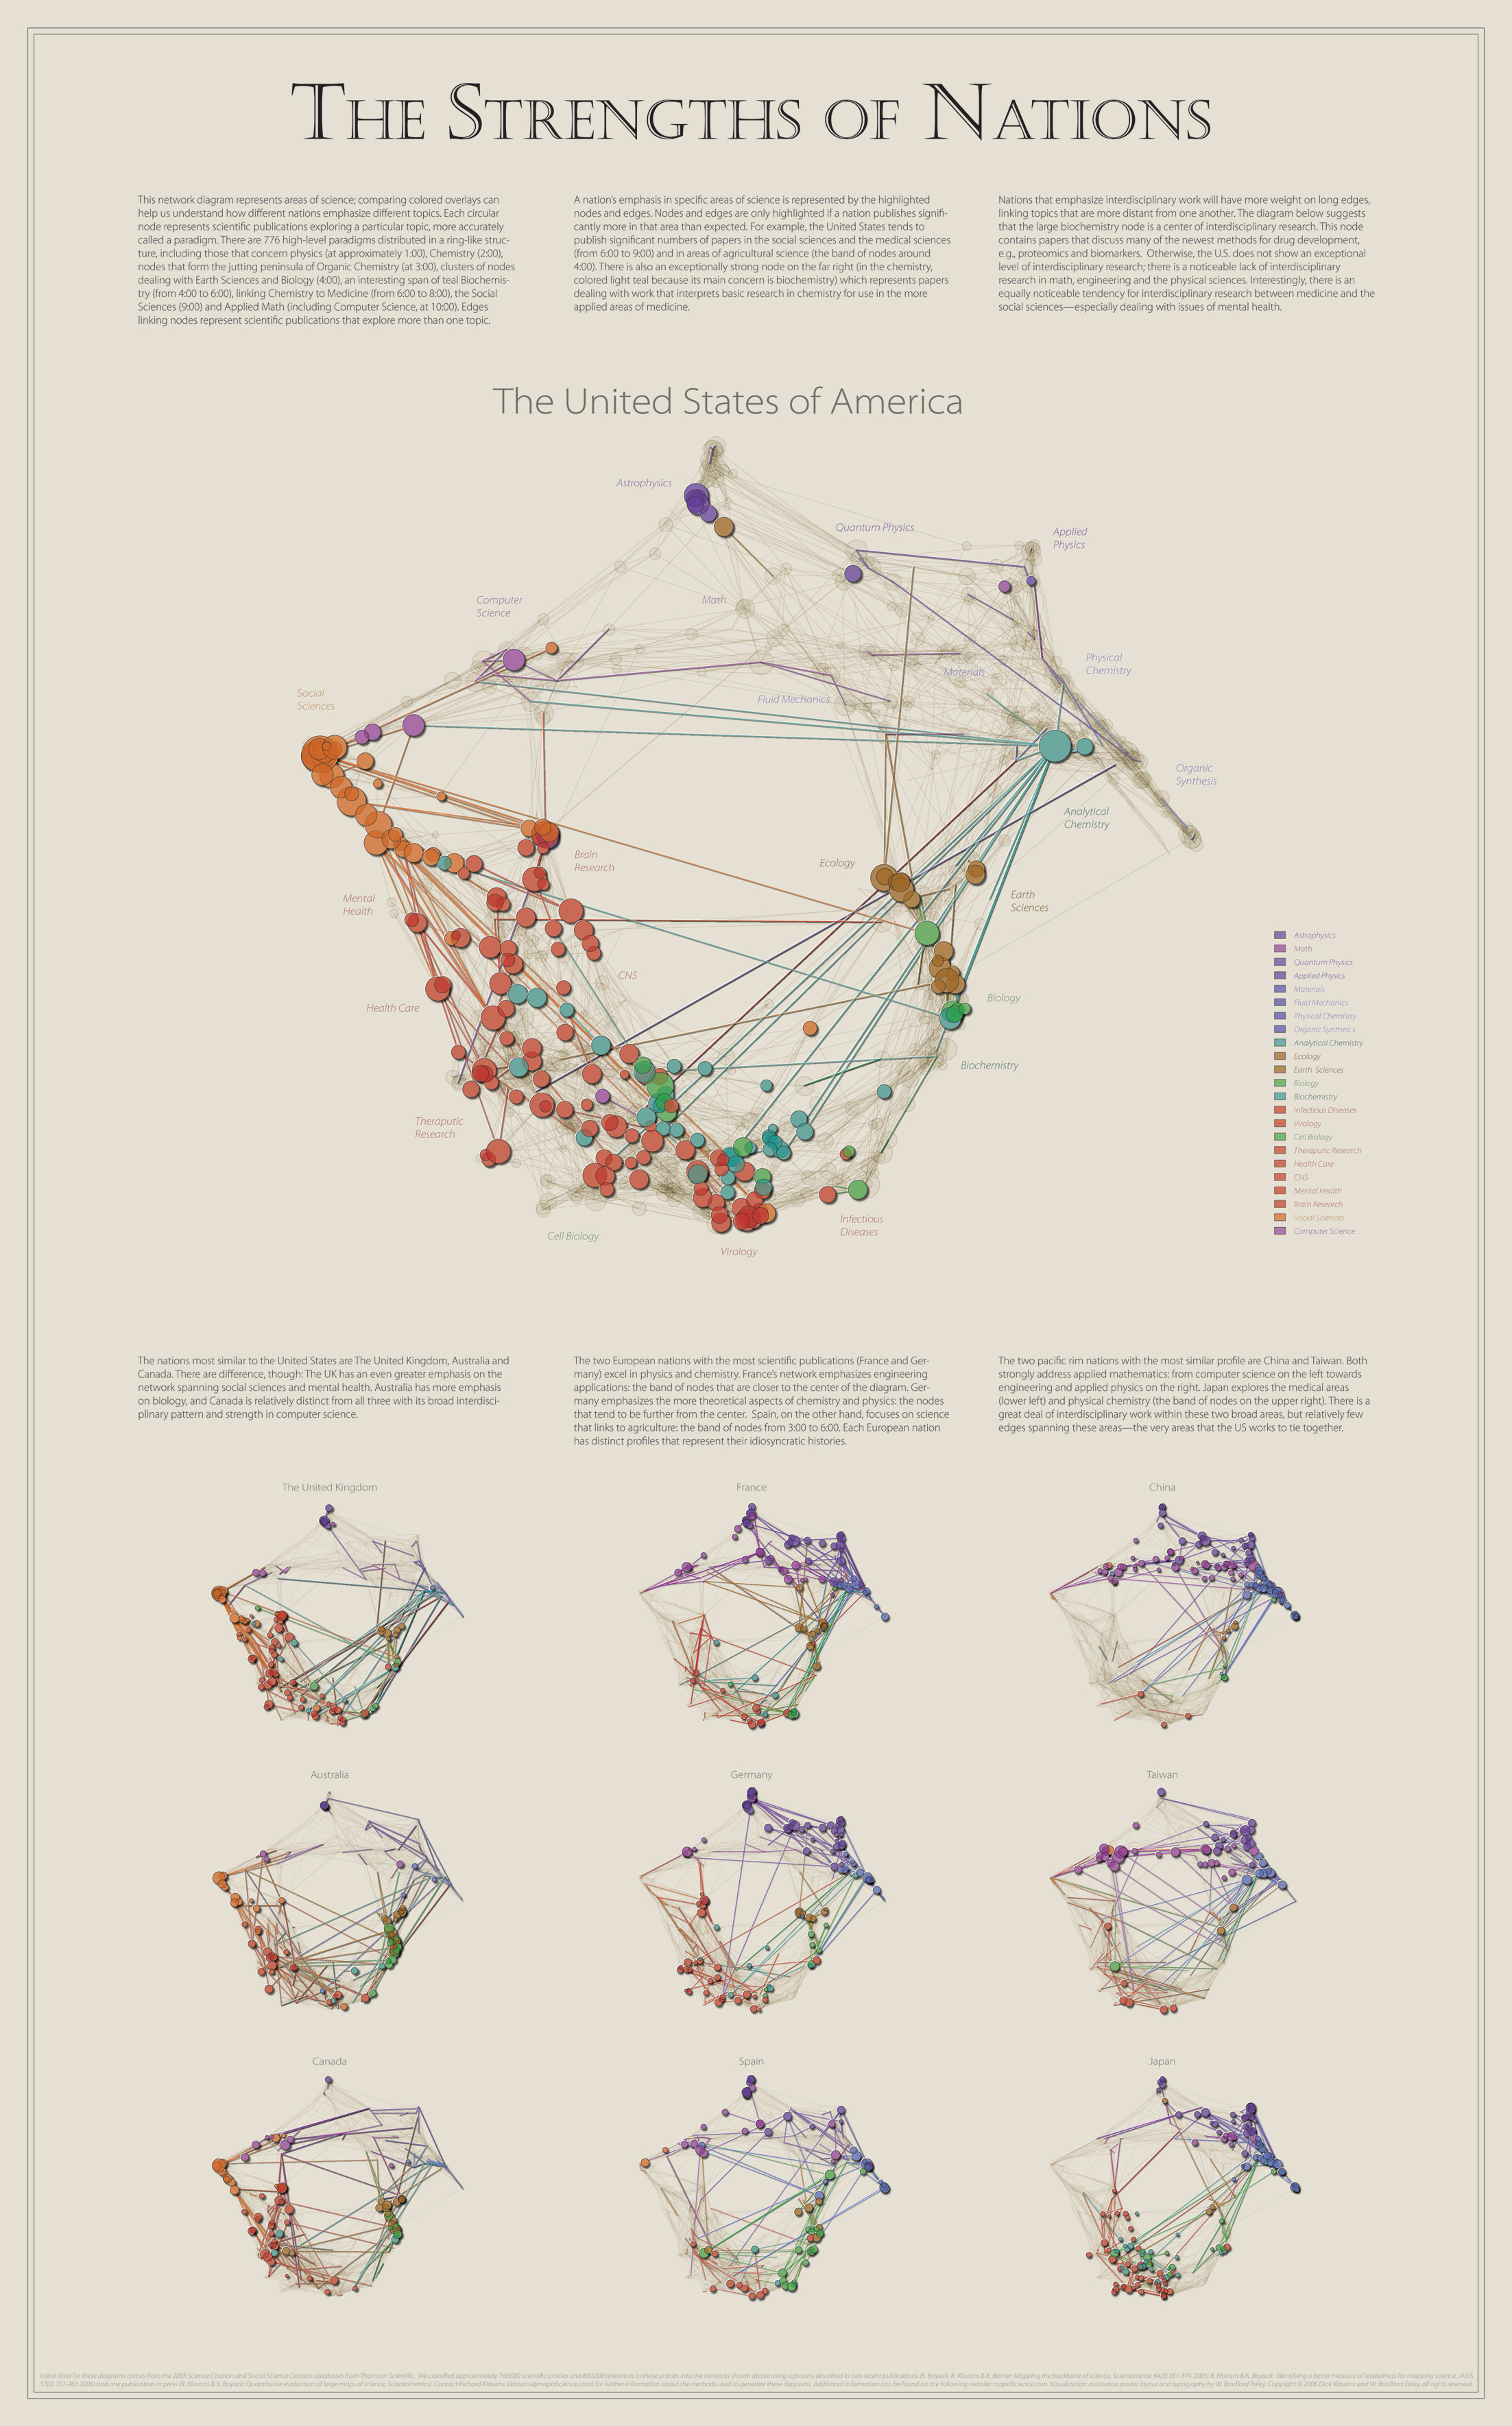
Strength of Nations
W. Bradford Paley
Subway History
Unknown
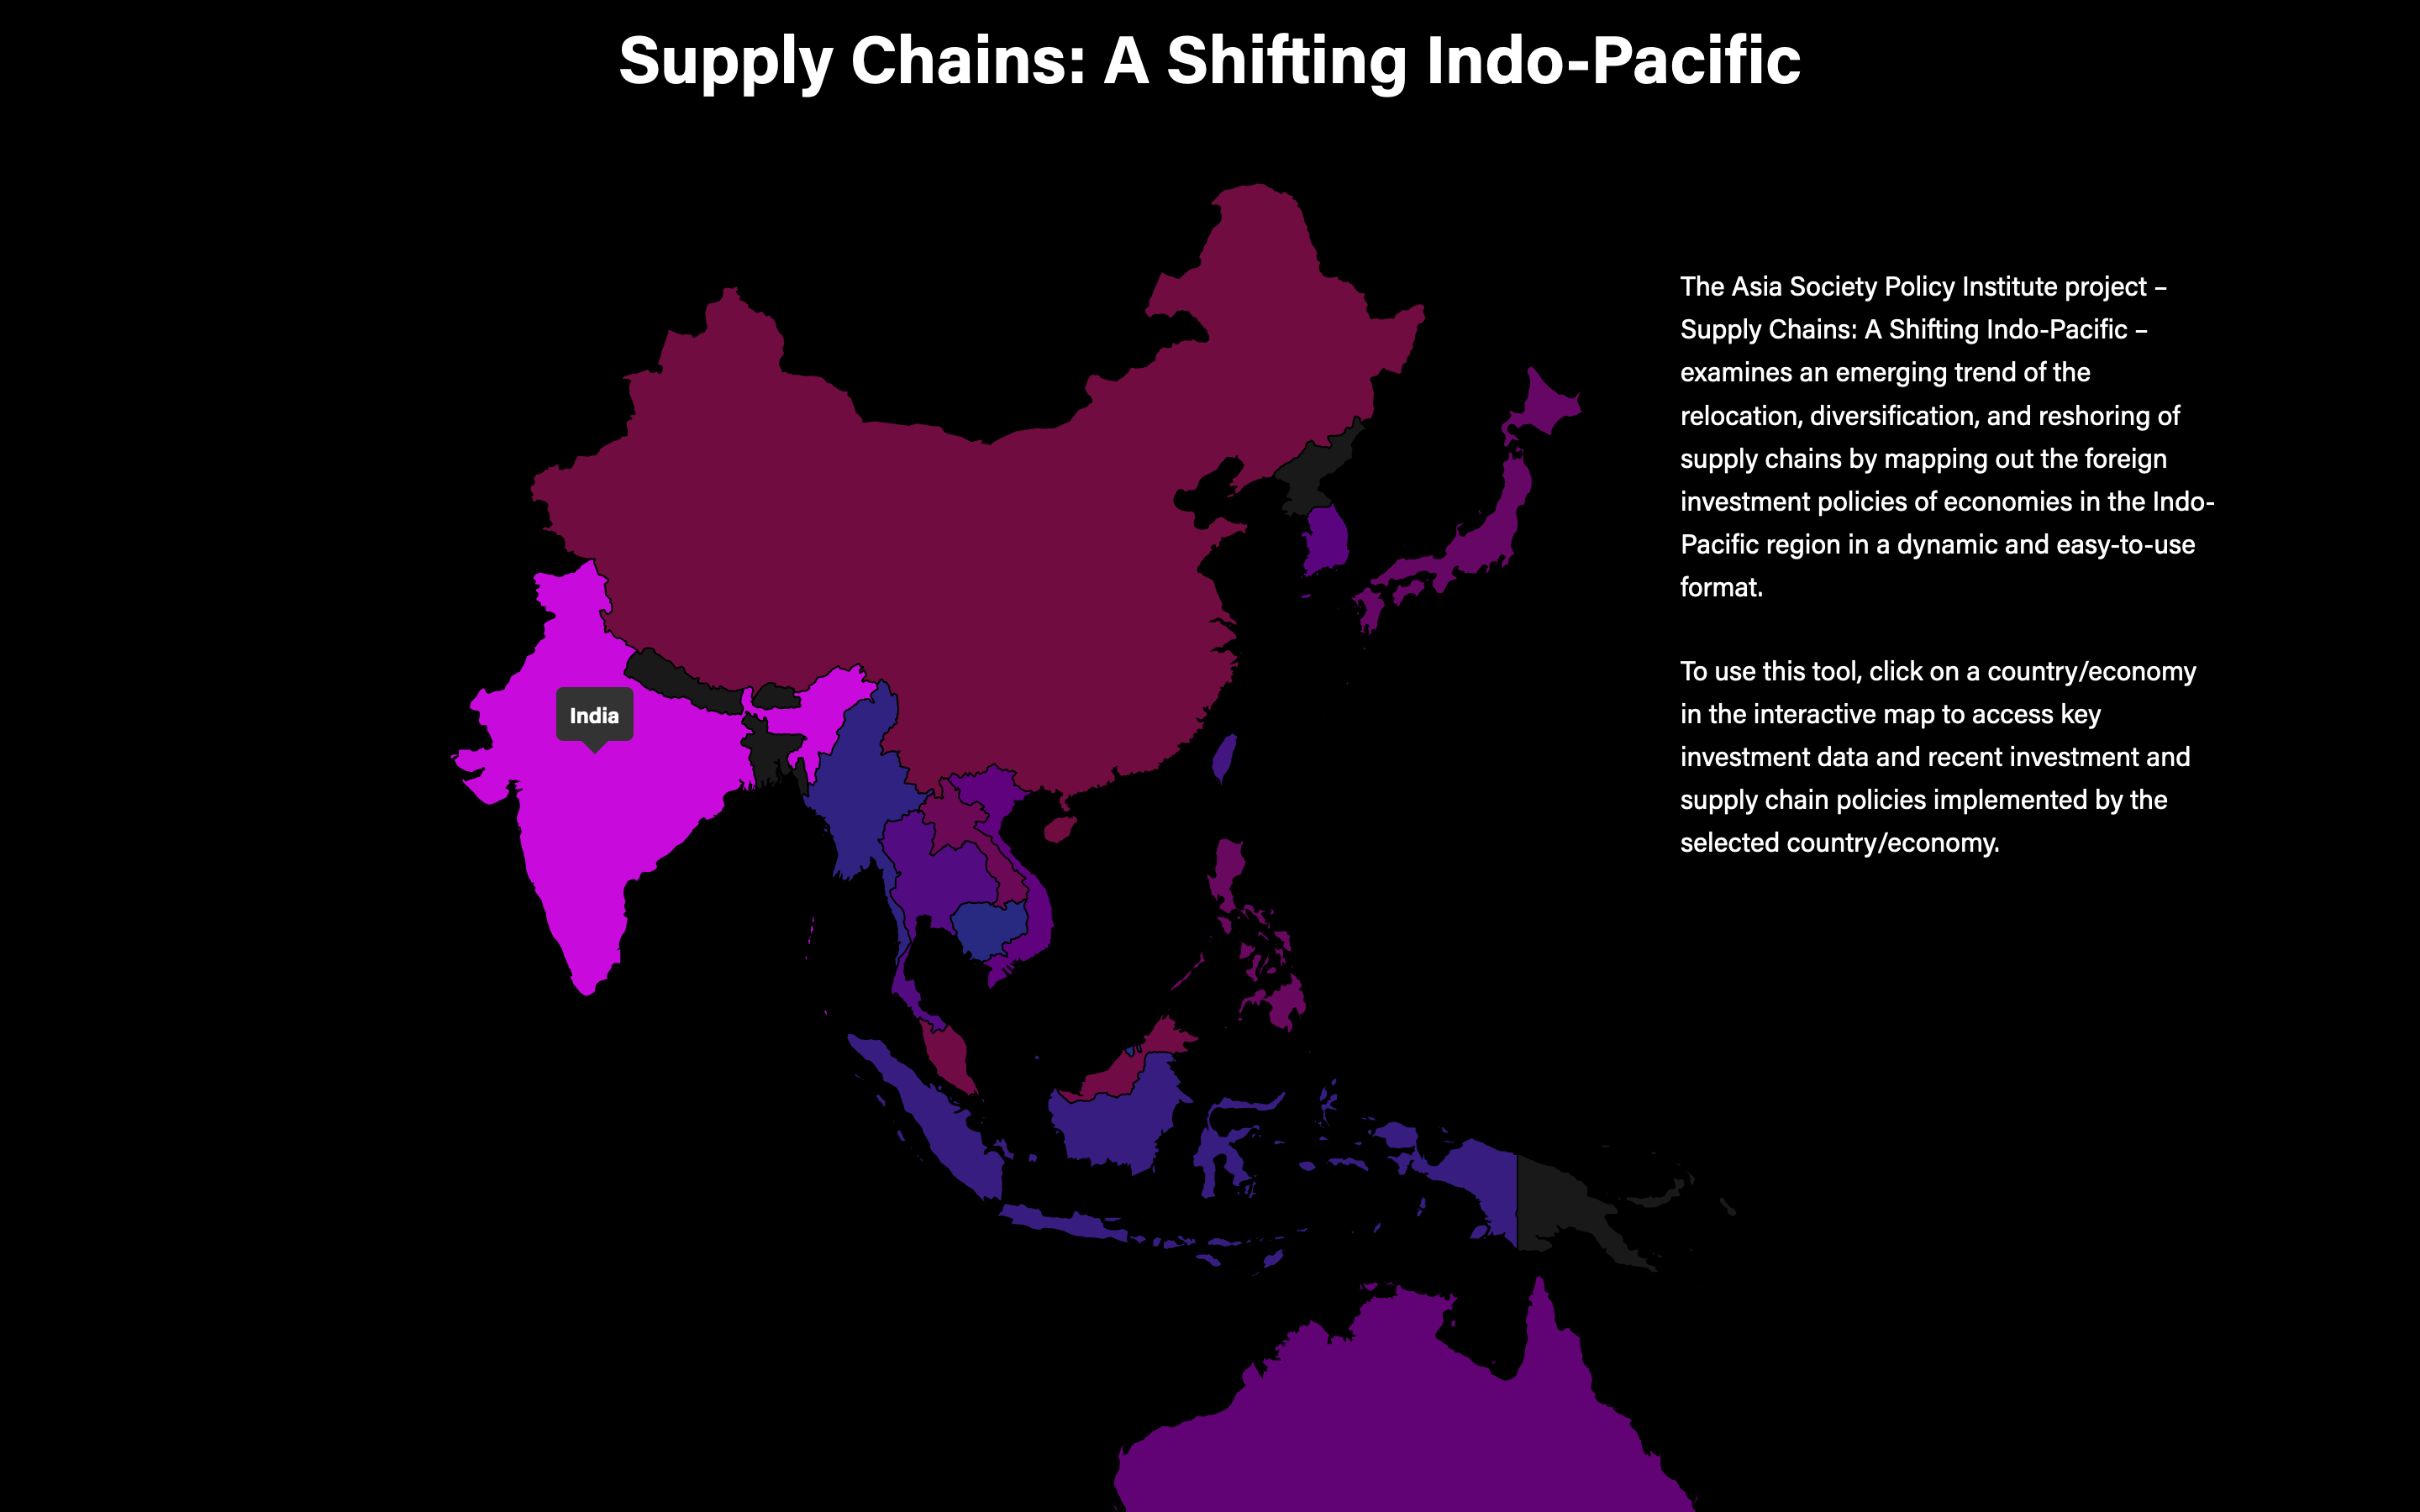
Supply Chains: a Shifting Indo-Pacific
Asia Society
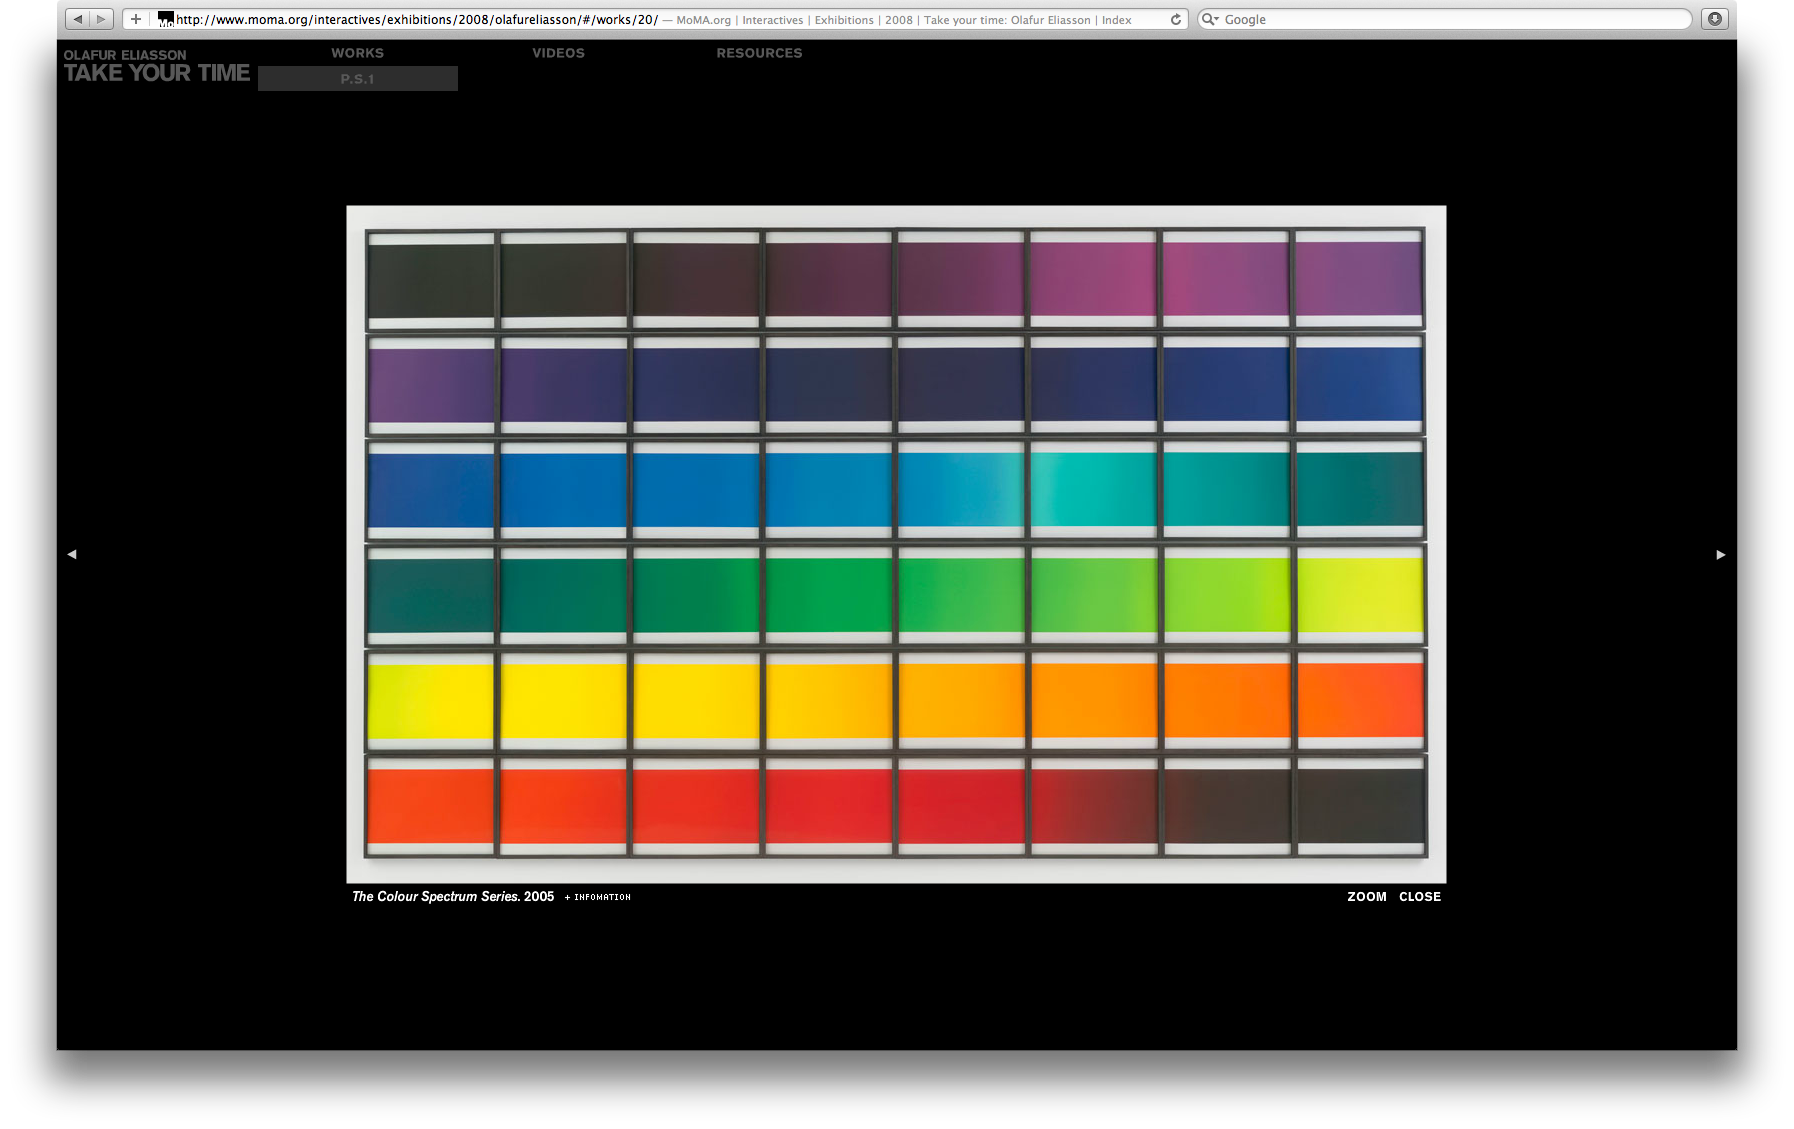
Take Your Time
Olafur Eliasson

Tarotbot

Tate Thames Dig
Mark Dion
Teamlab
Ted
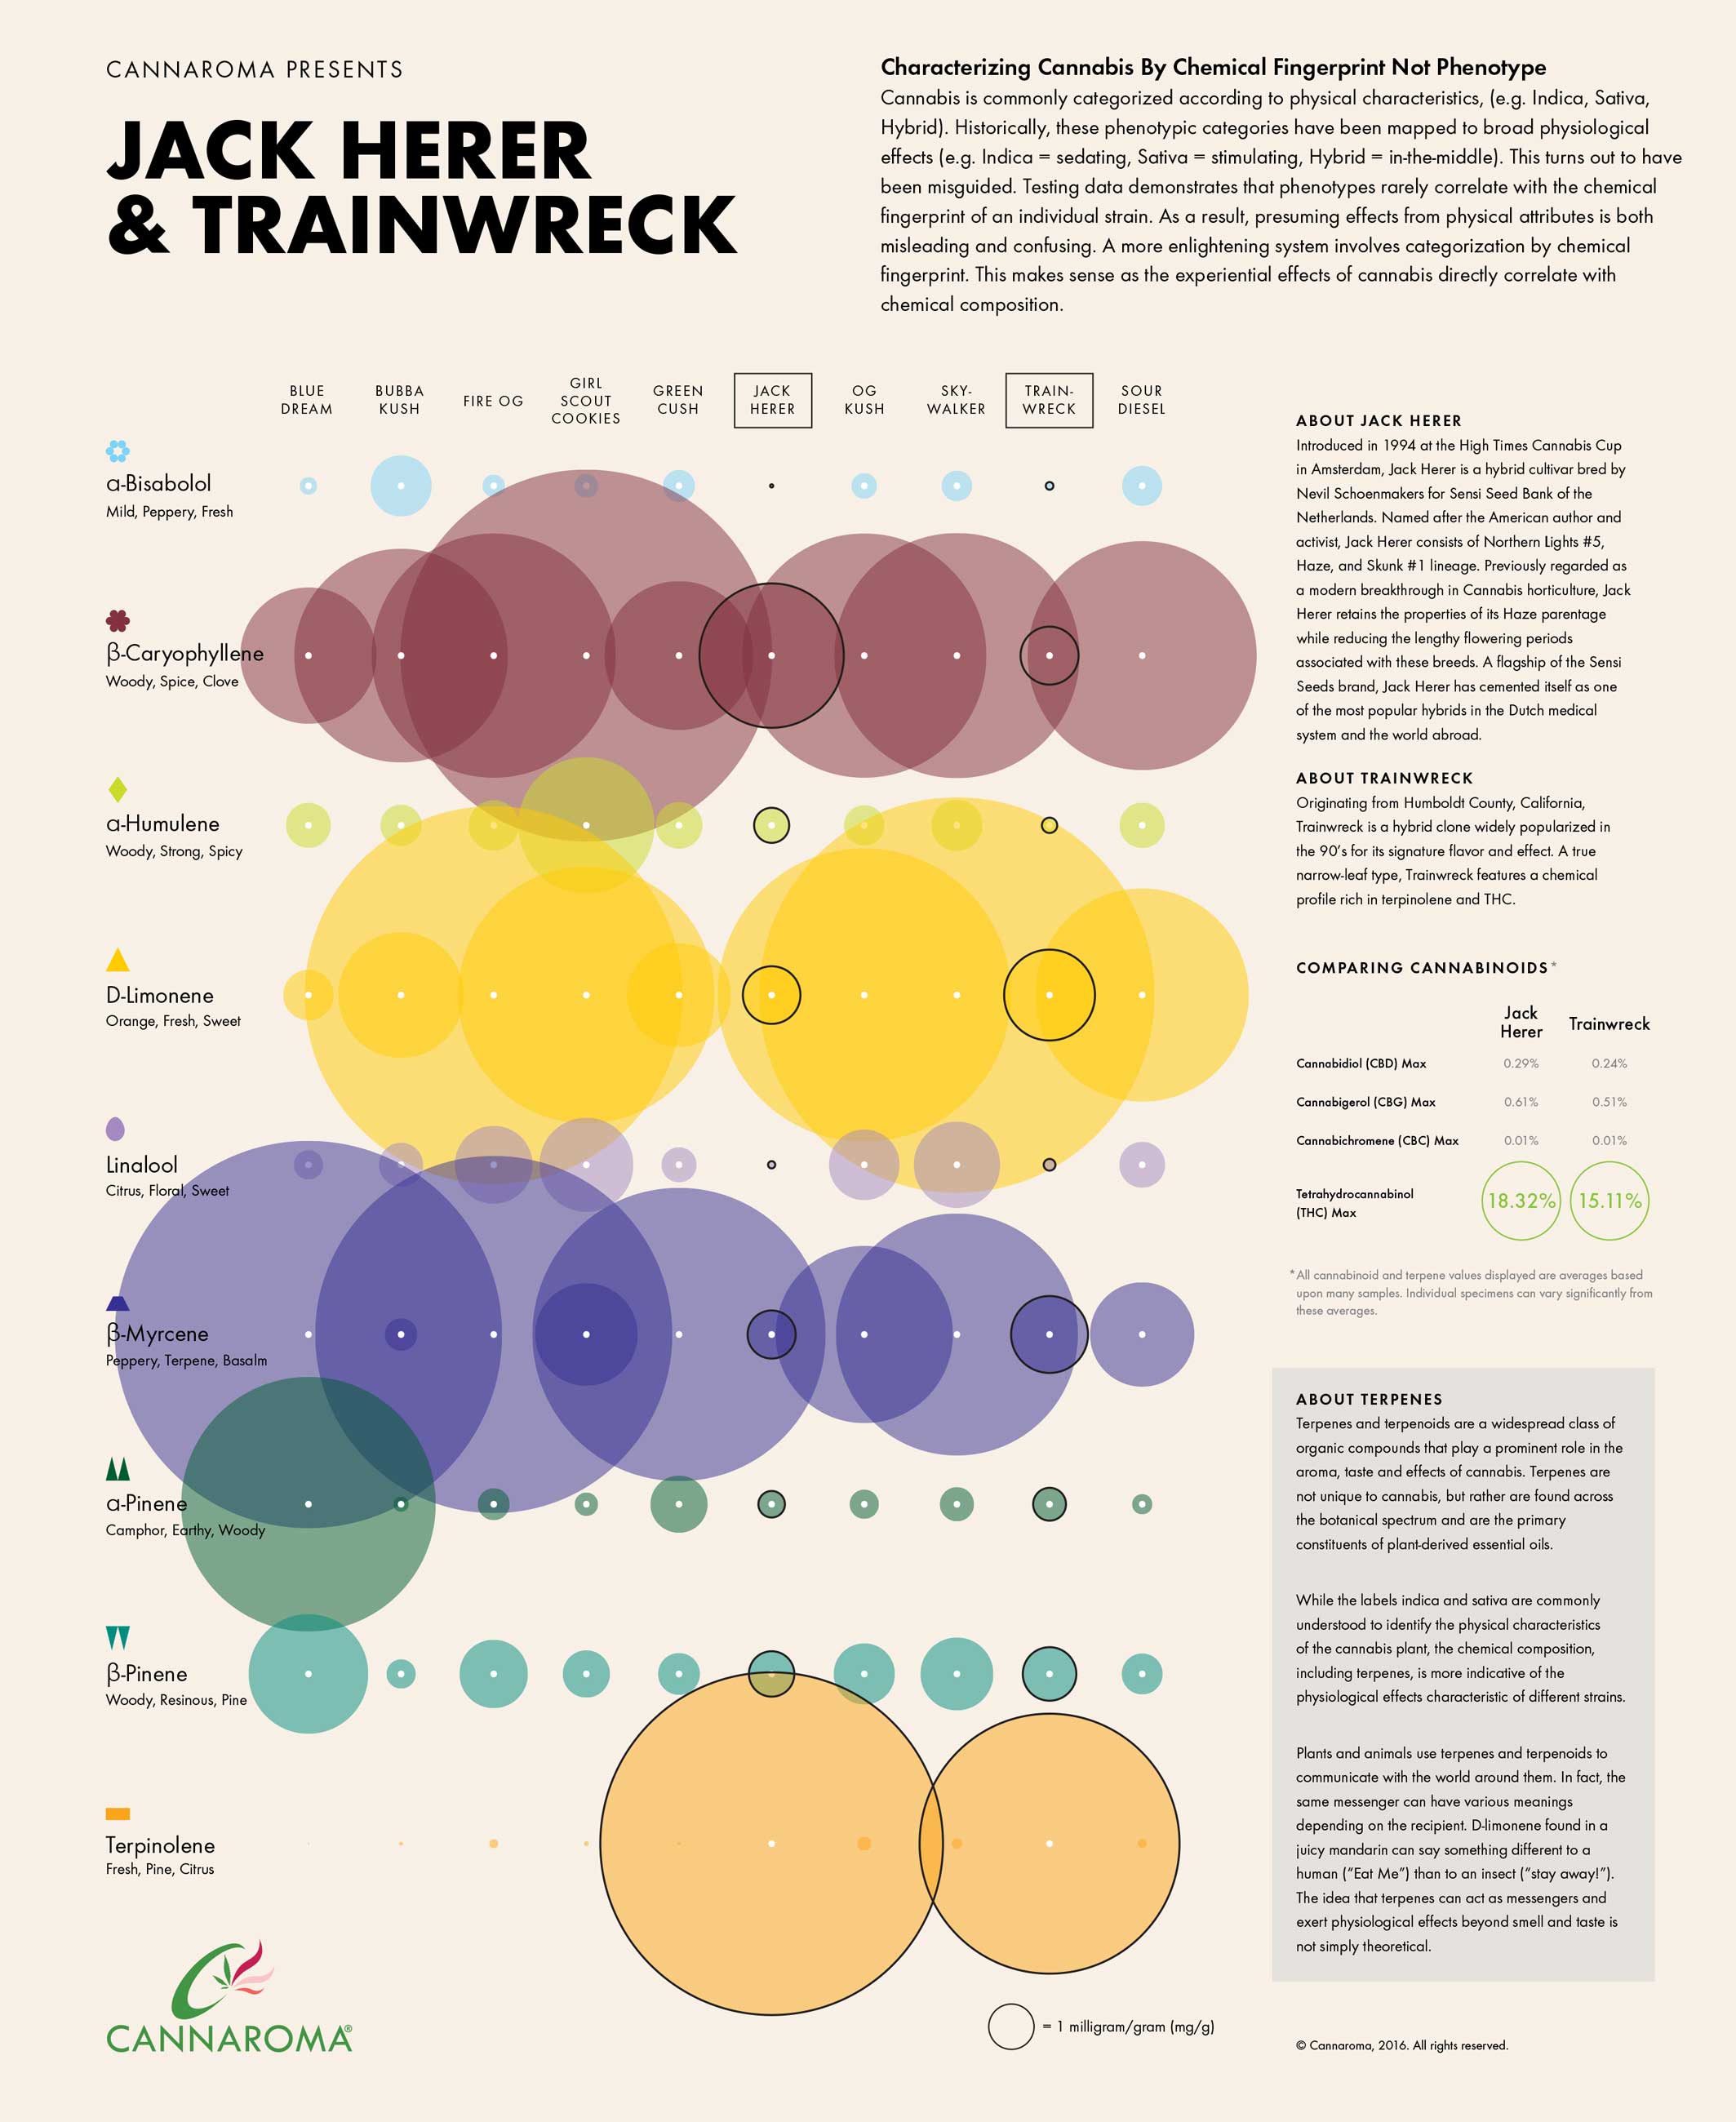
Terpene Data Visualization
TextArc
W. Bradford Paley
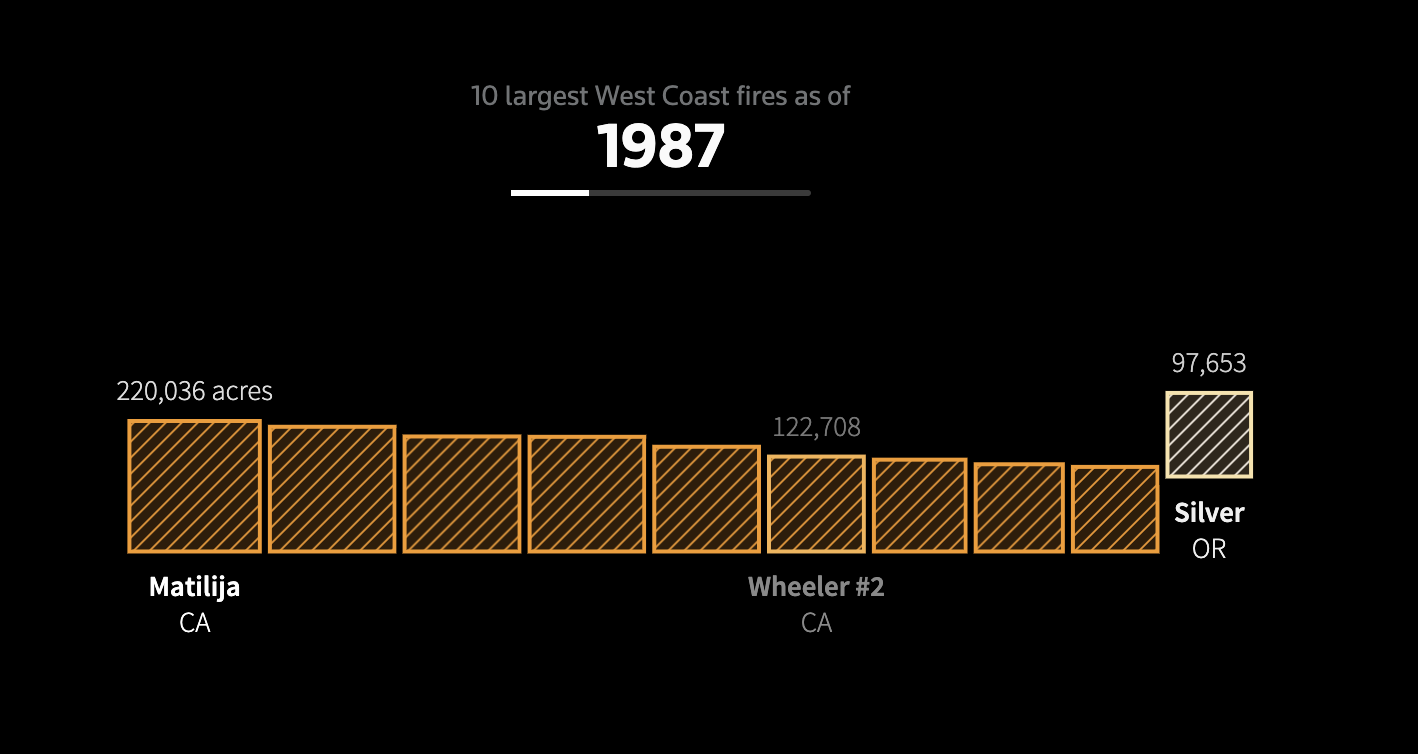
The Age of Megafire
Reuters
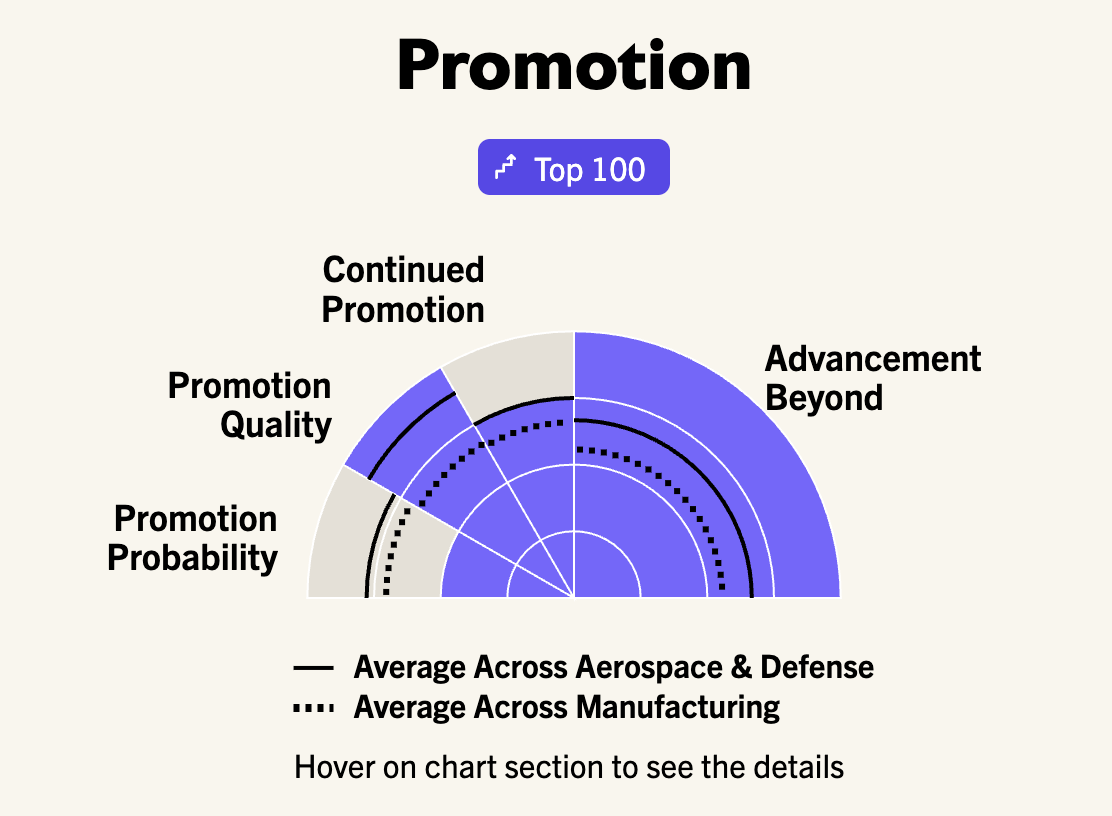
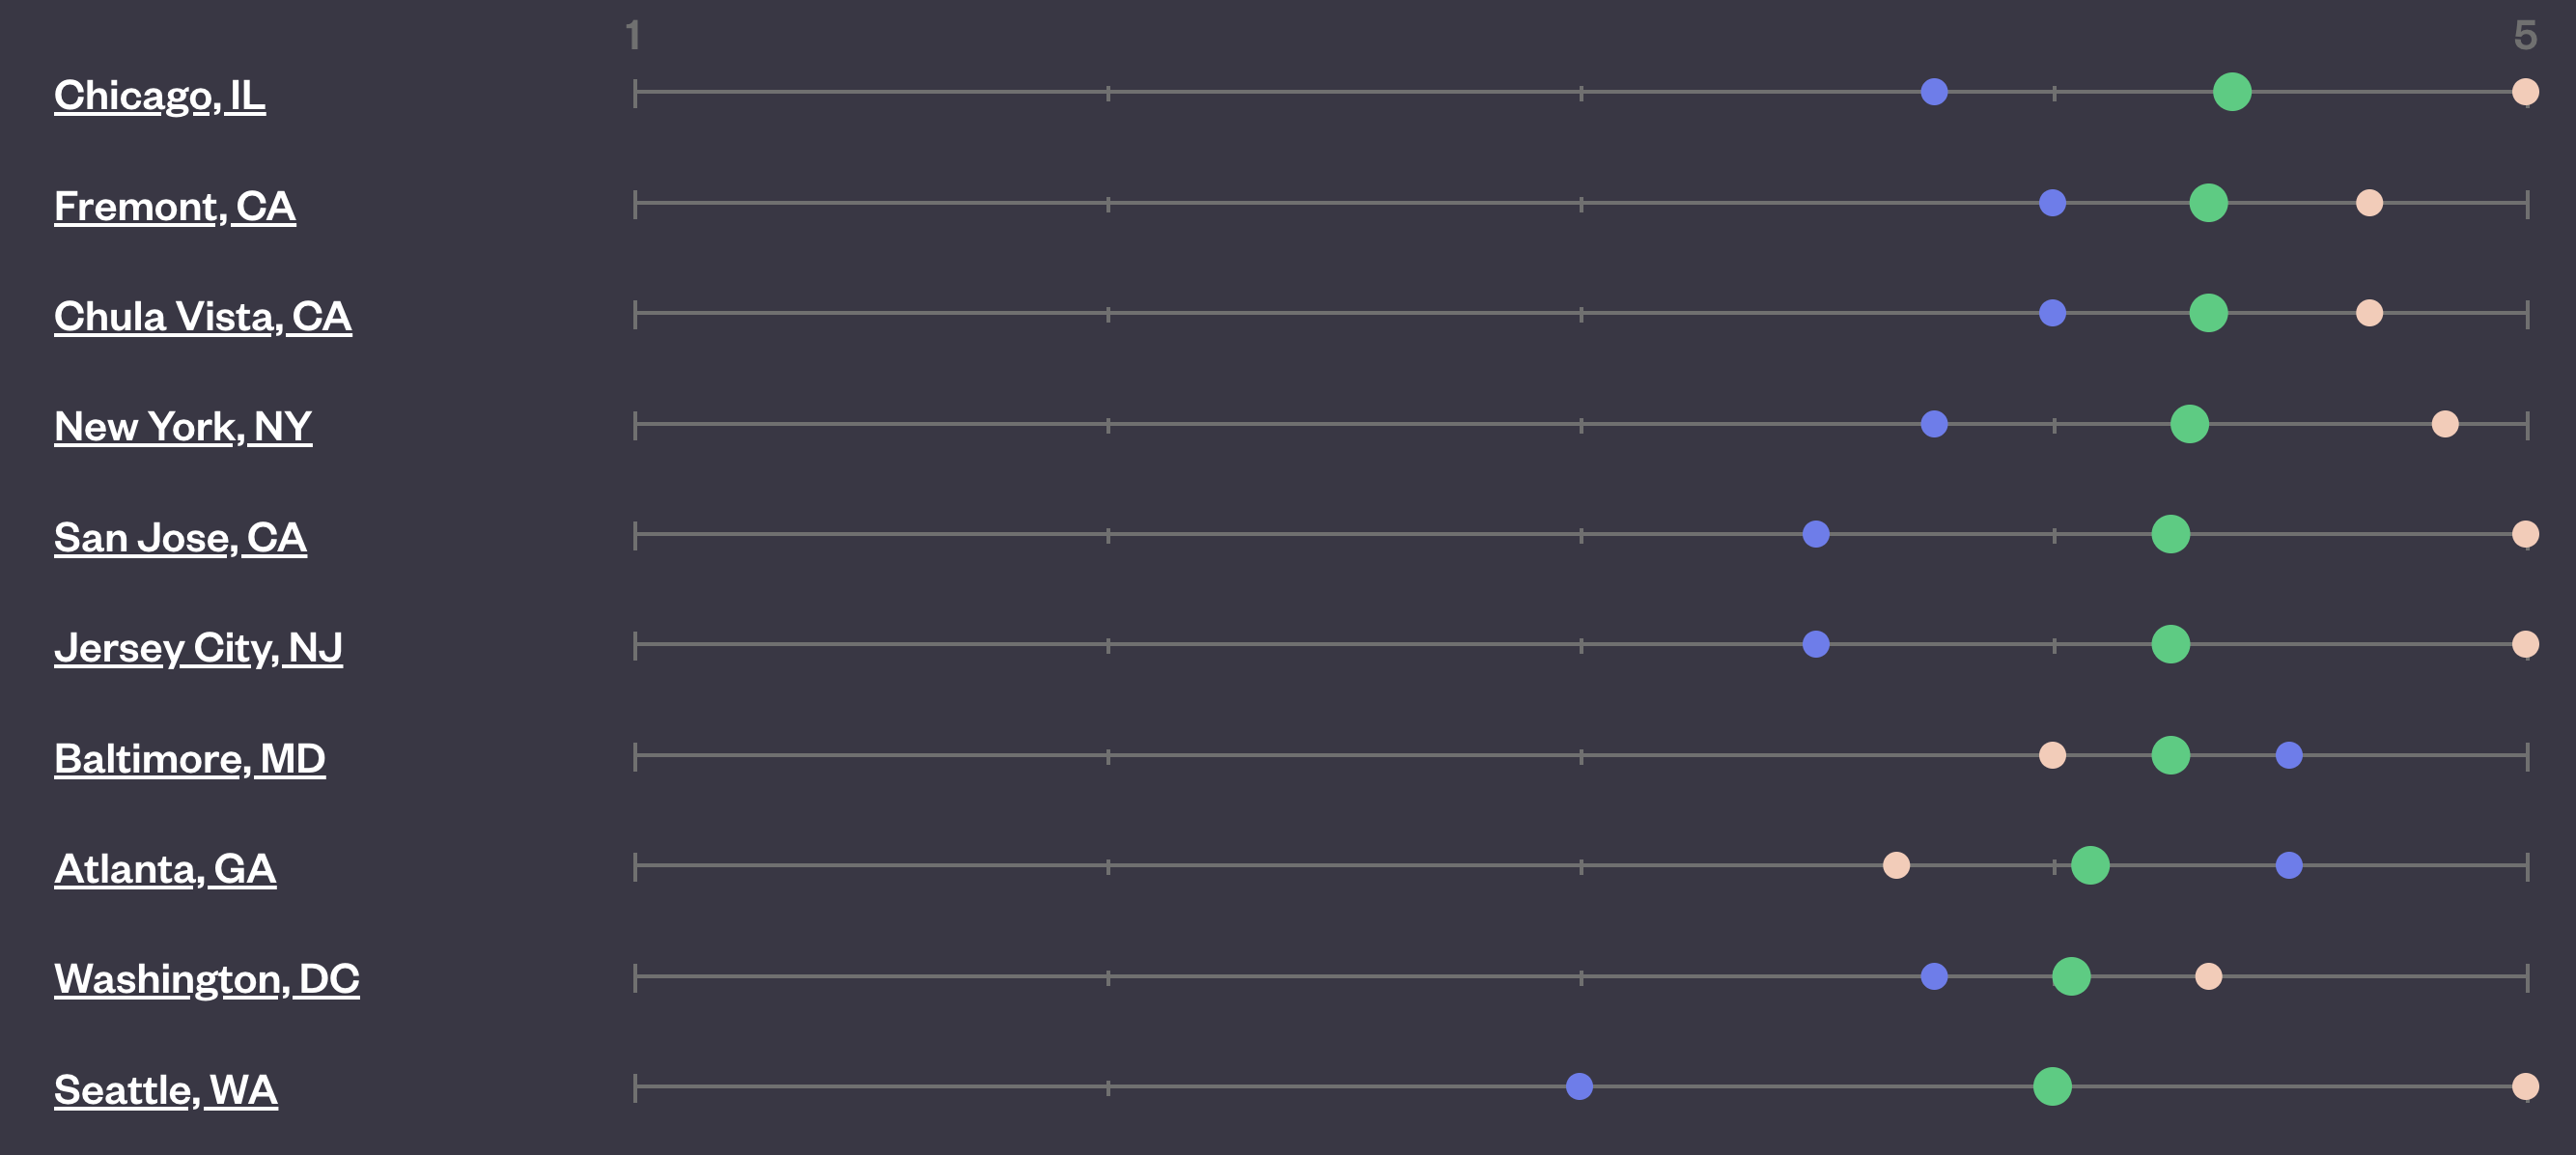
The American Opportunity Index
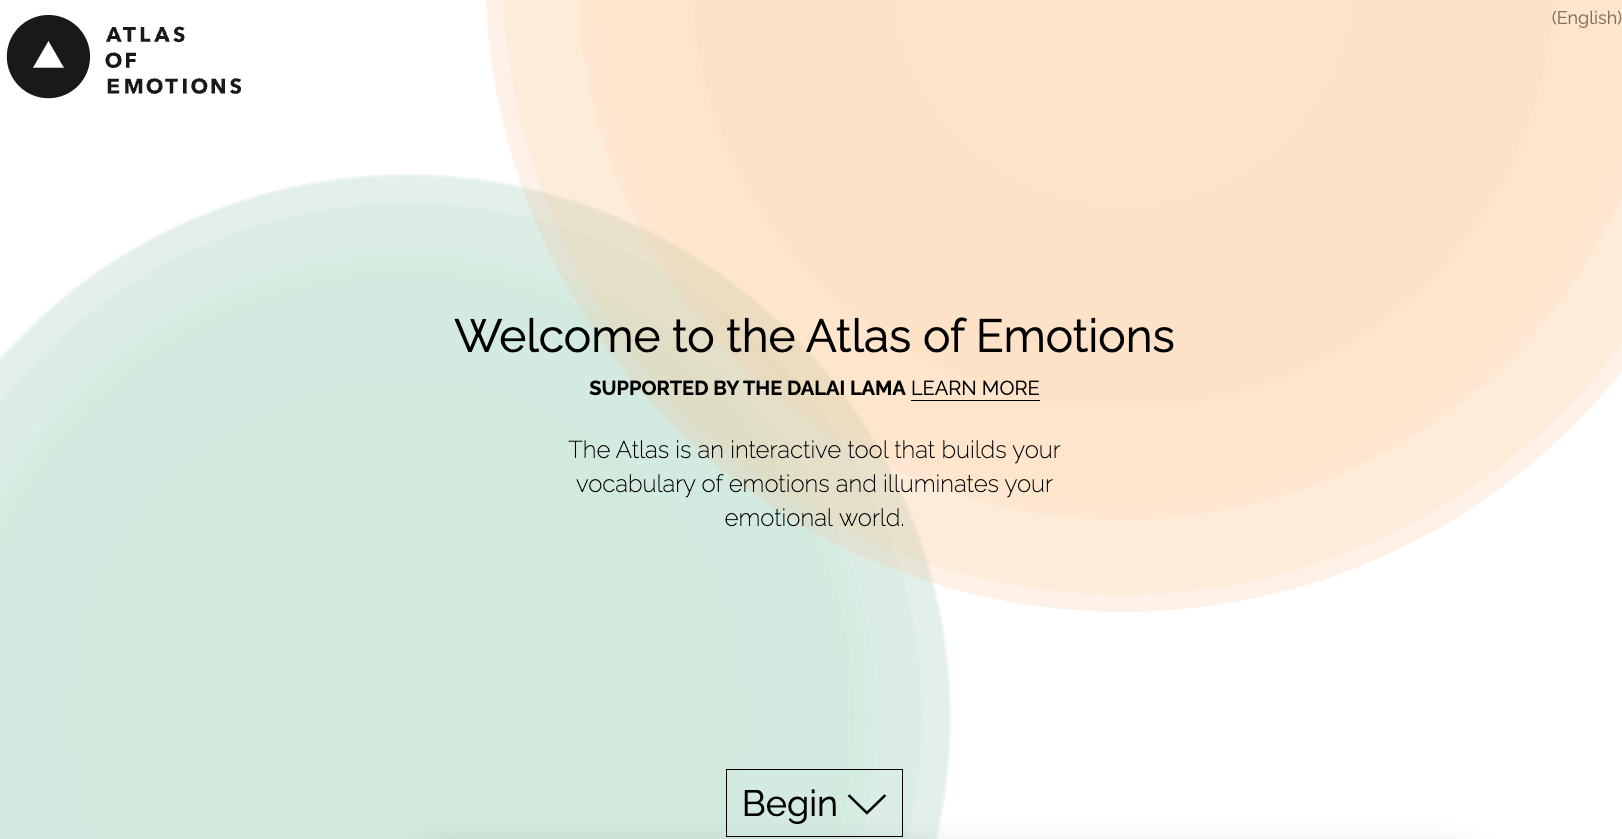
The Atlas of Emotions
The Big Swing
ABC News

The Bureau of Investigative Journalism
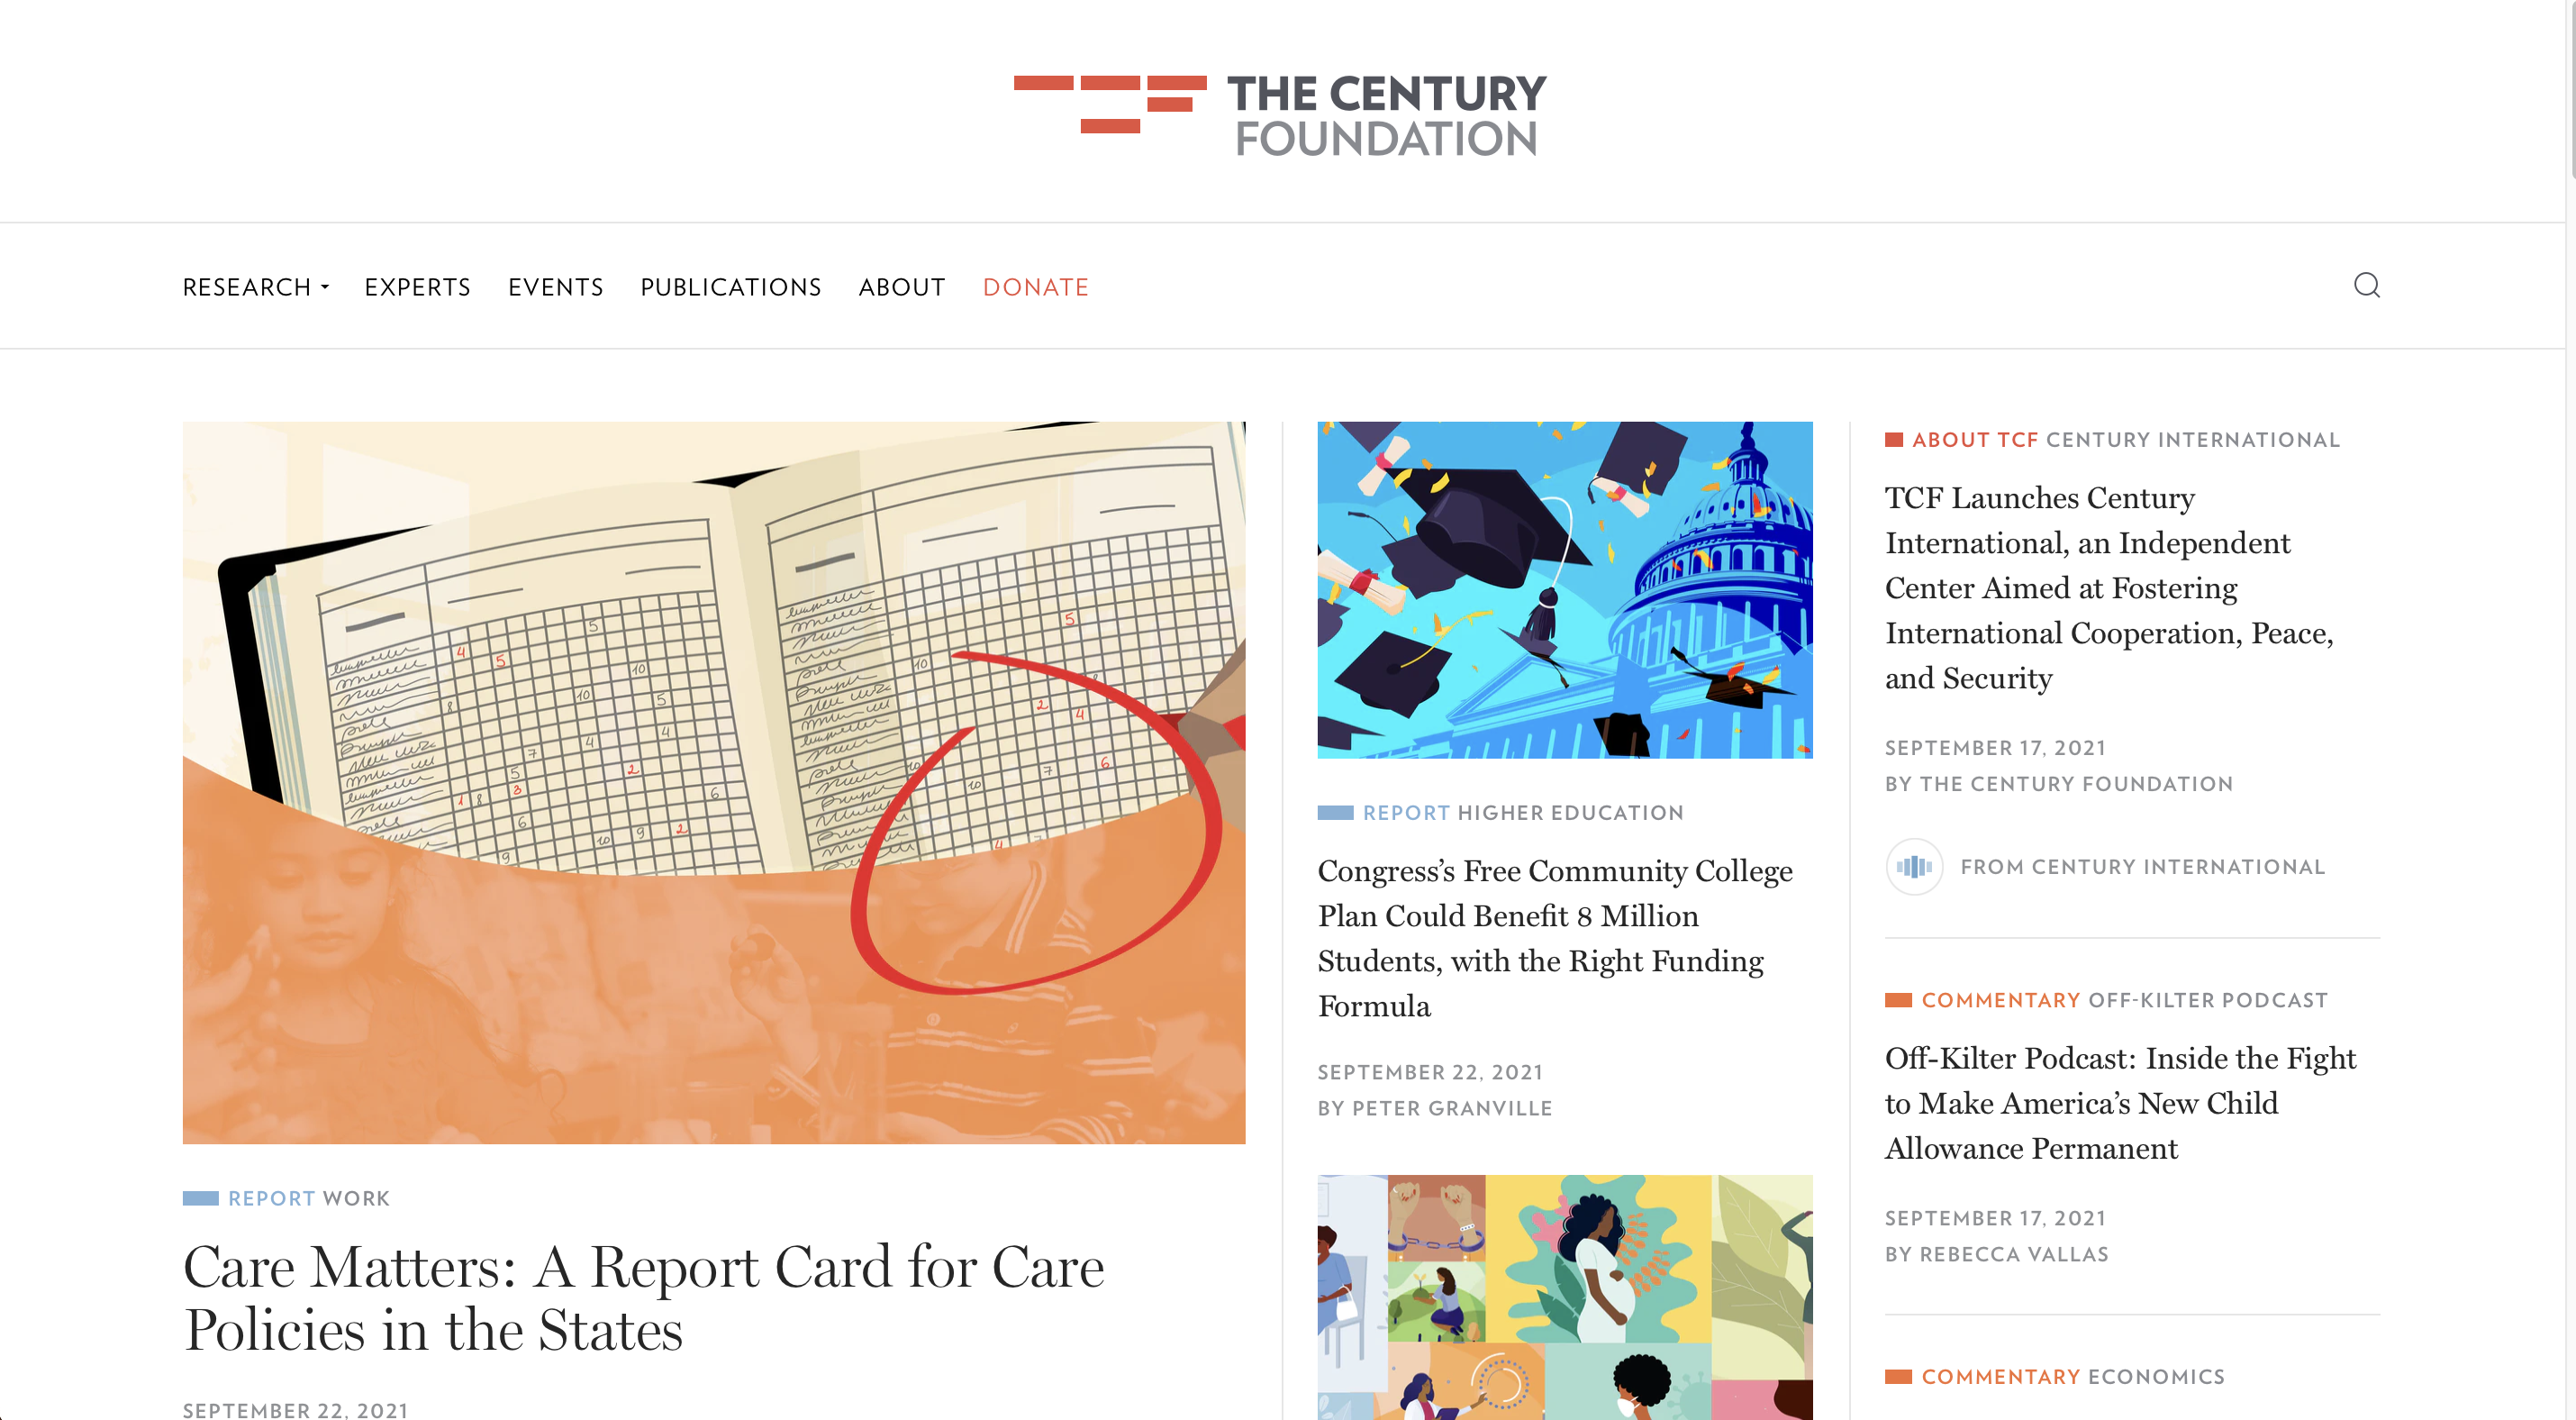
The Century Foundation
The Changing Childhood Project
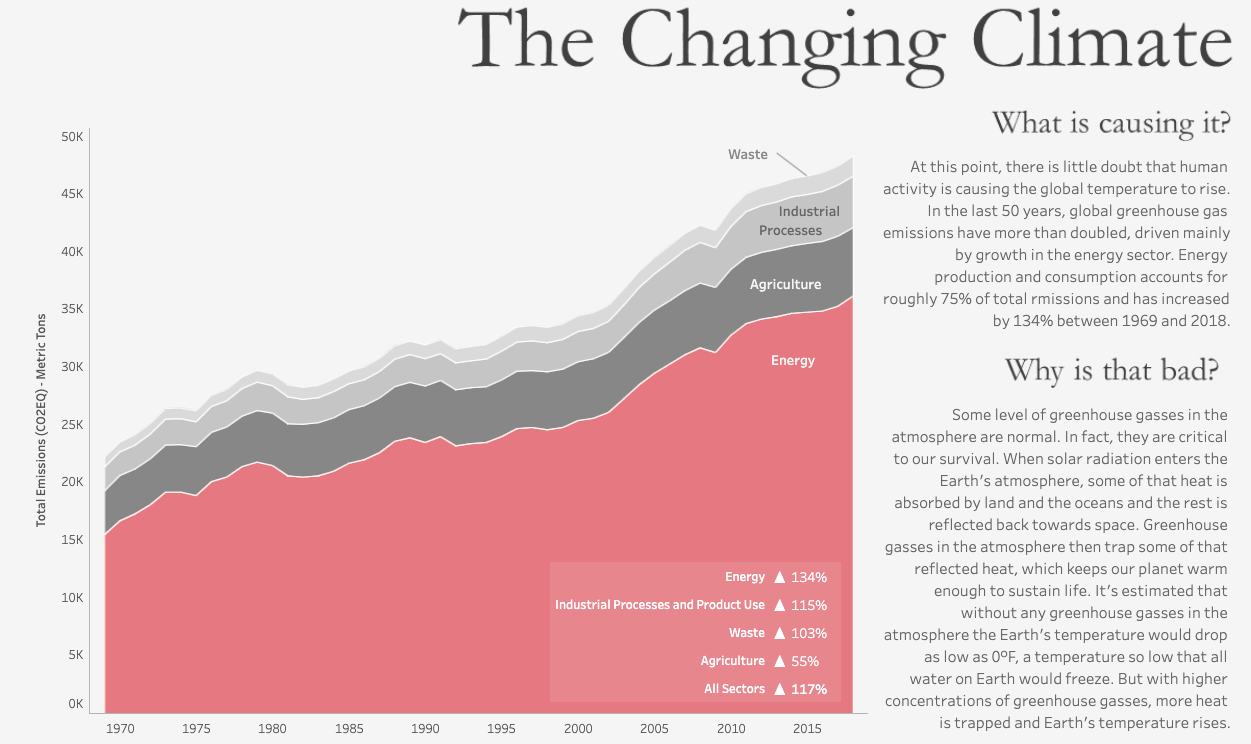
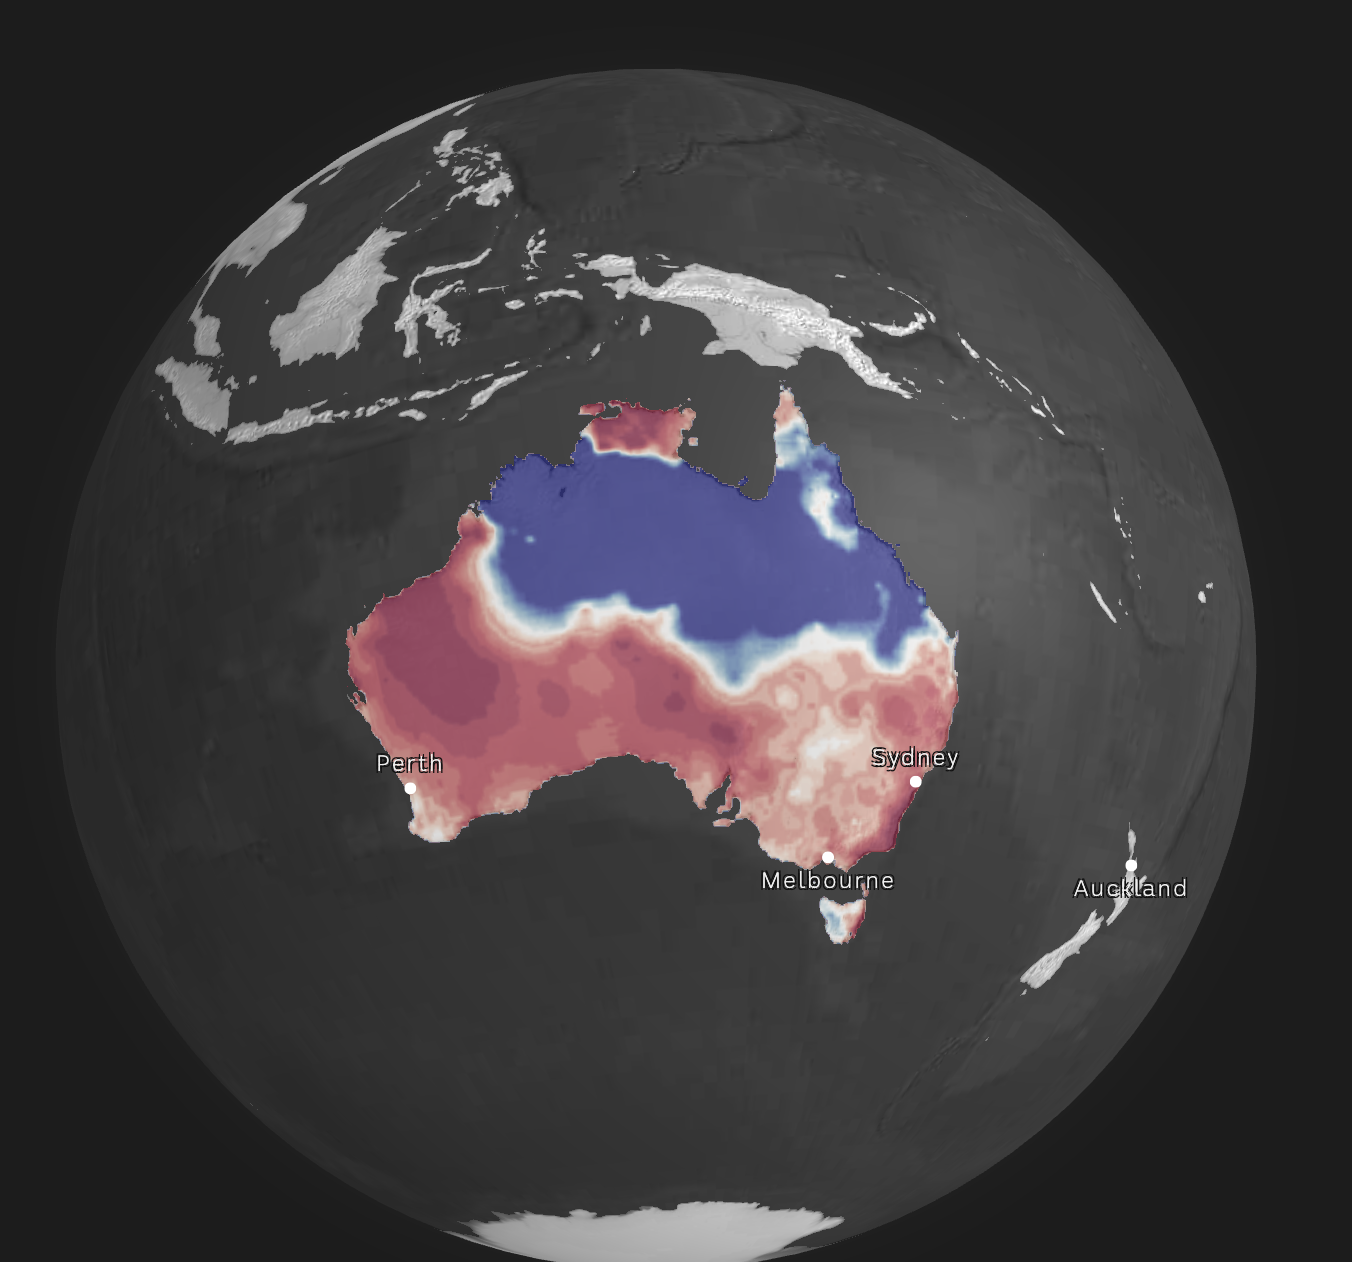
The Changing Climate
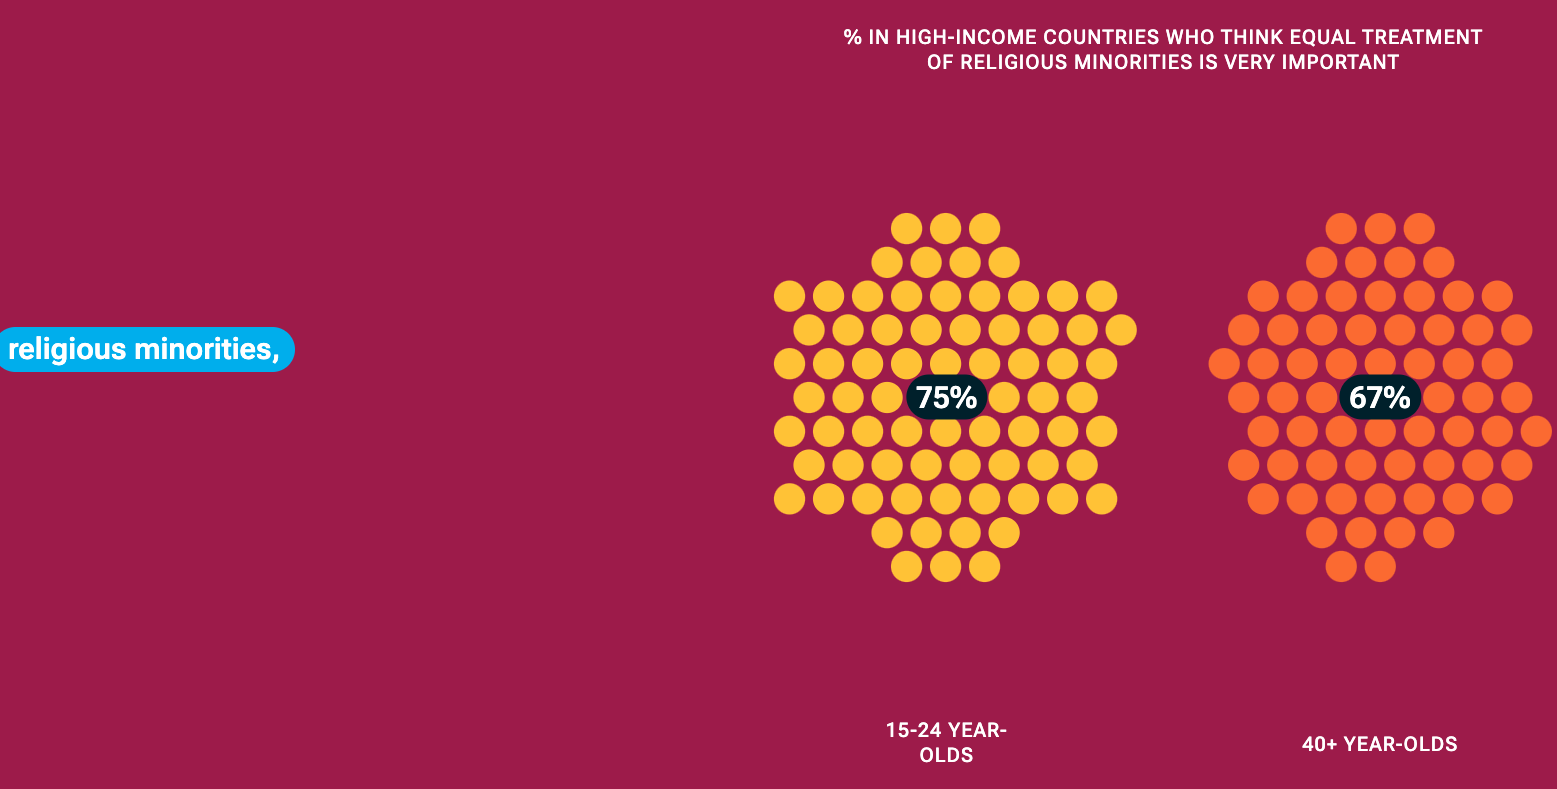
The Changing Face of the New Middle East
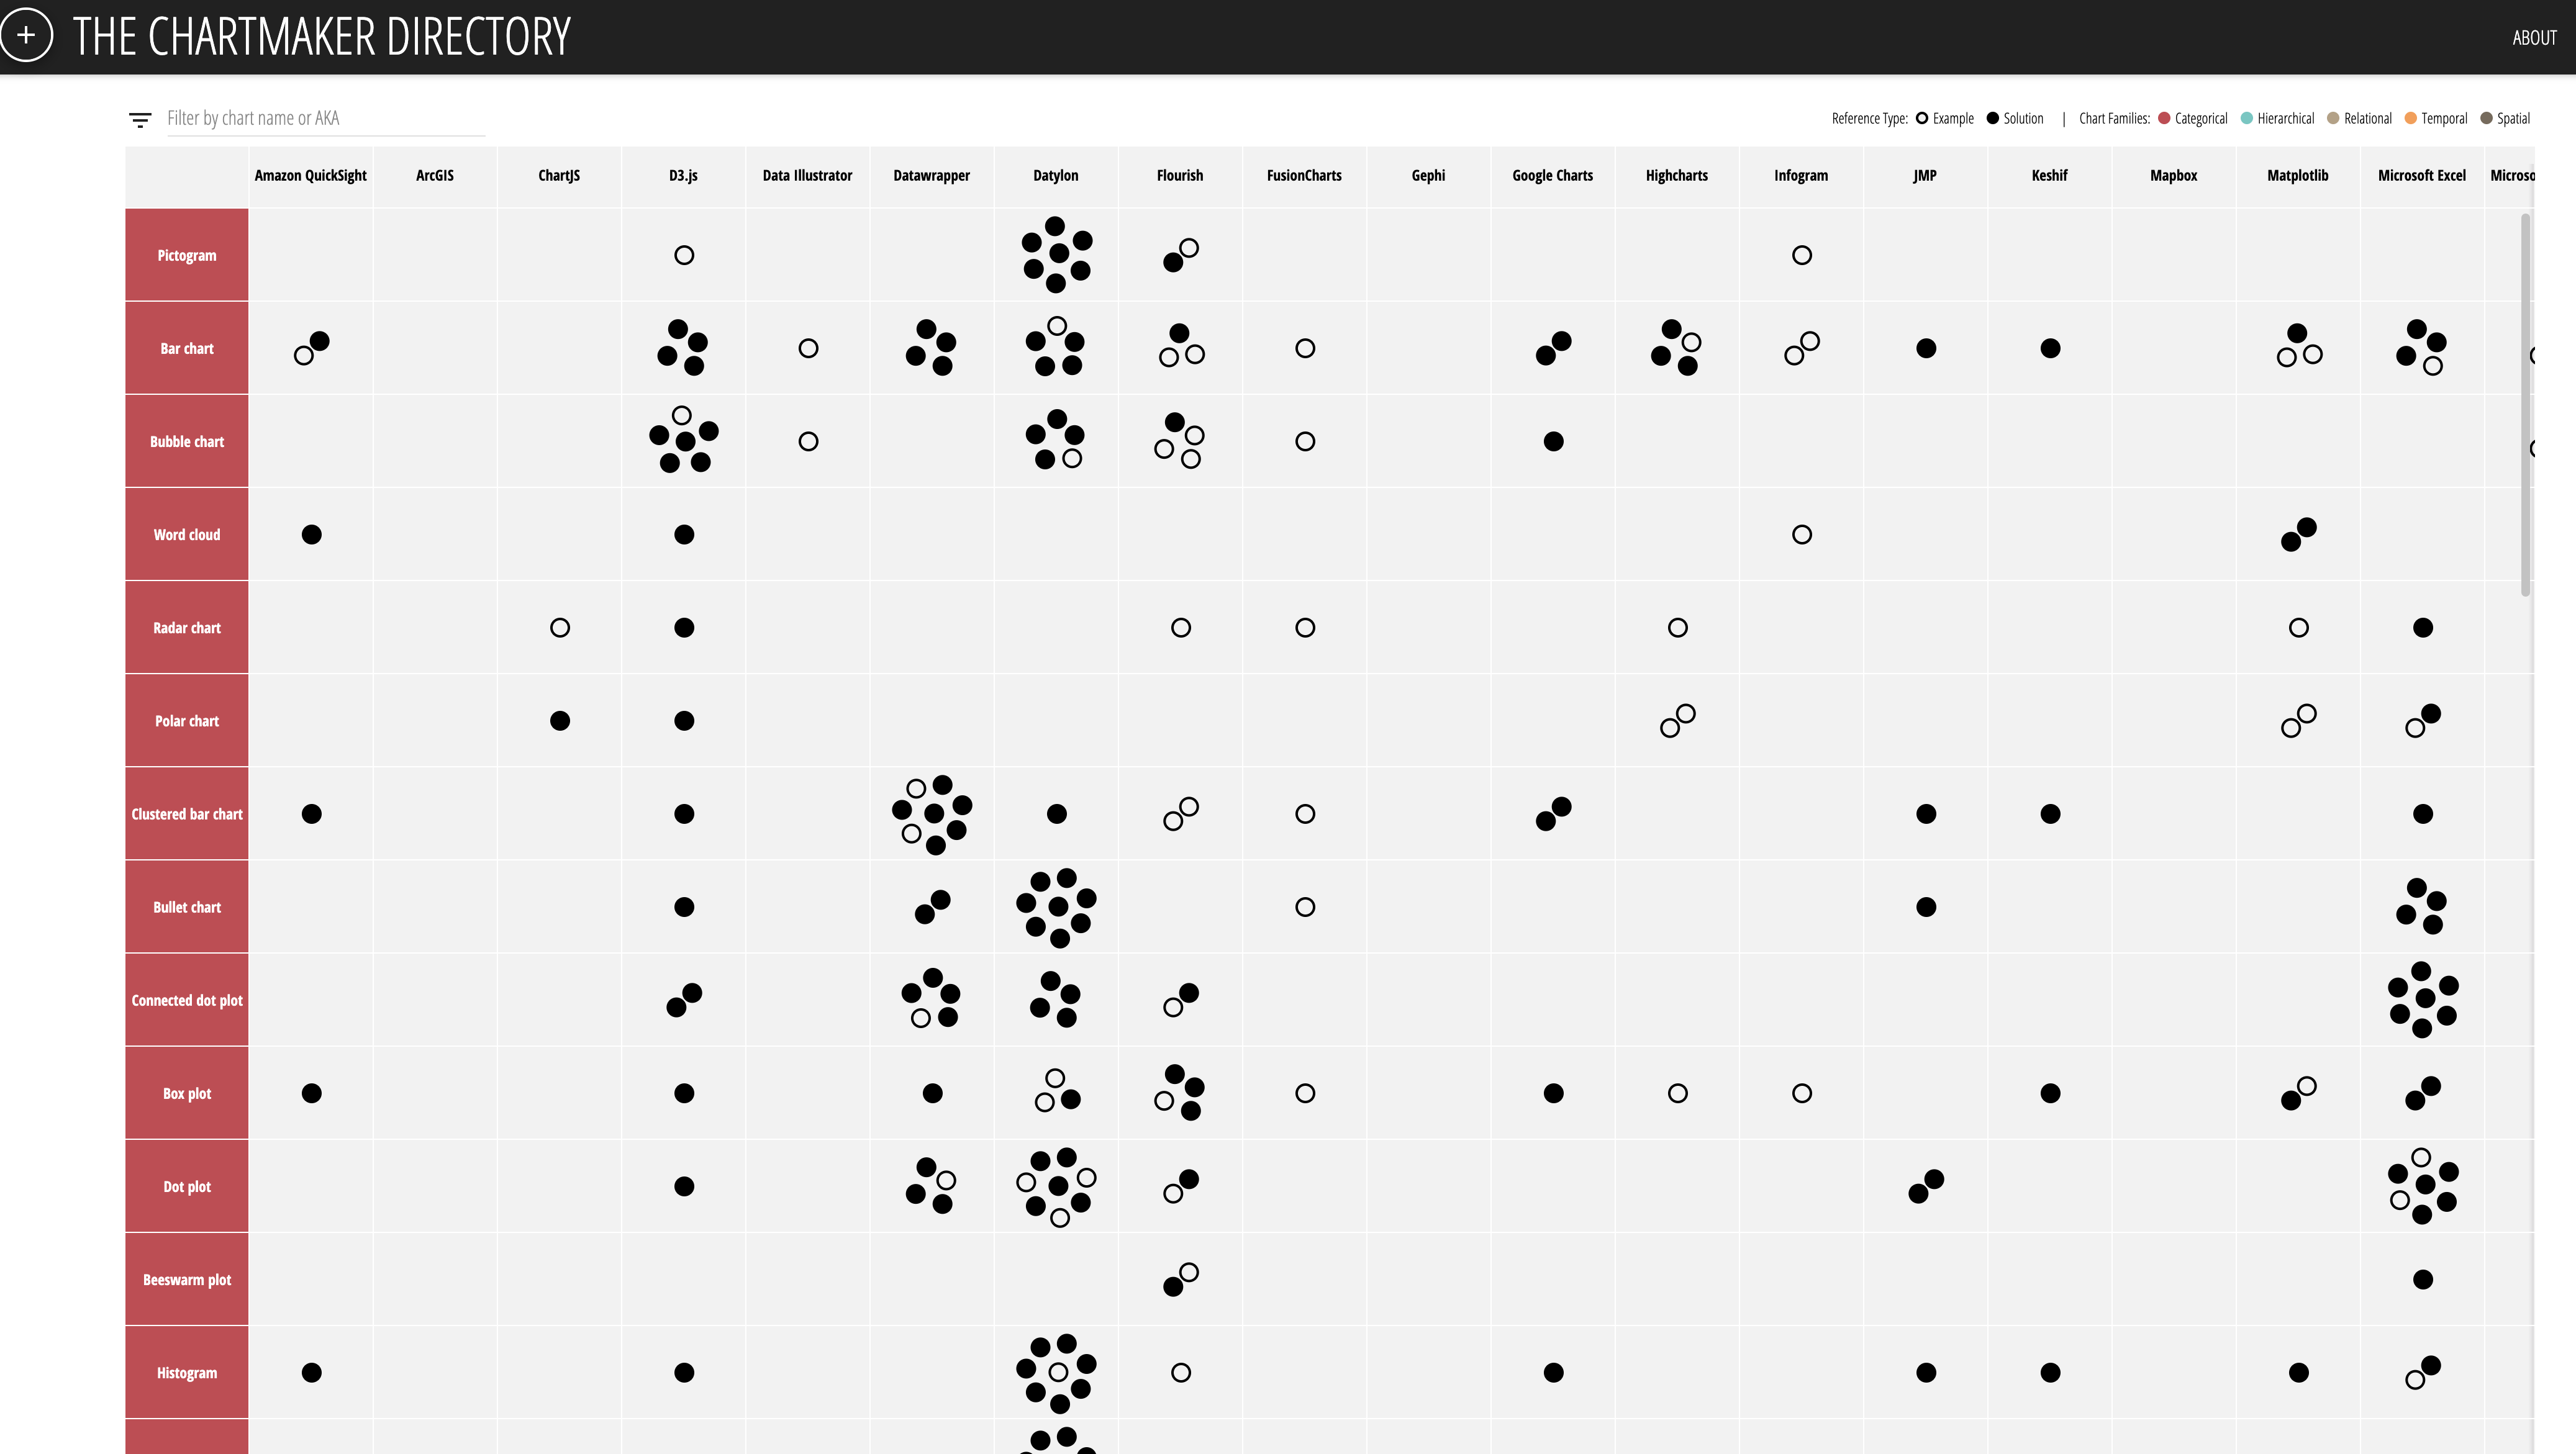
The Chartmaker Directory
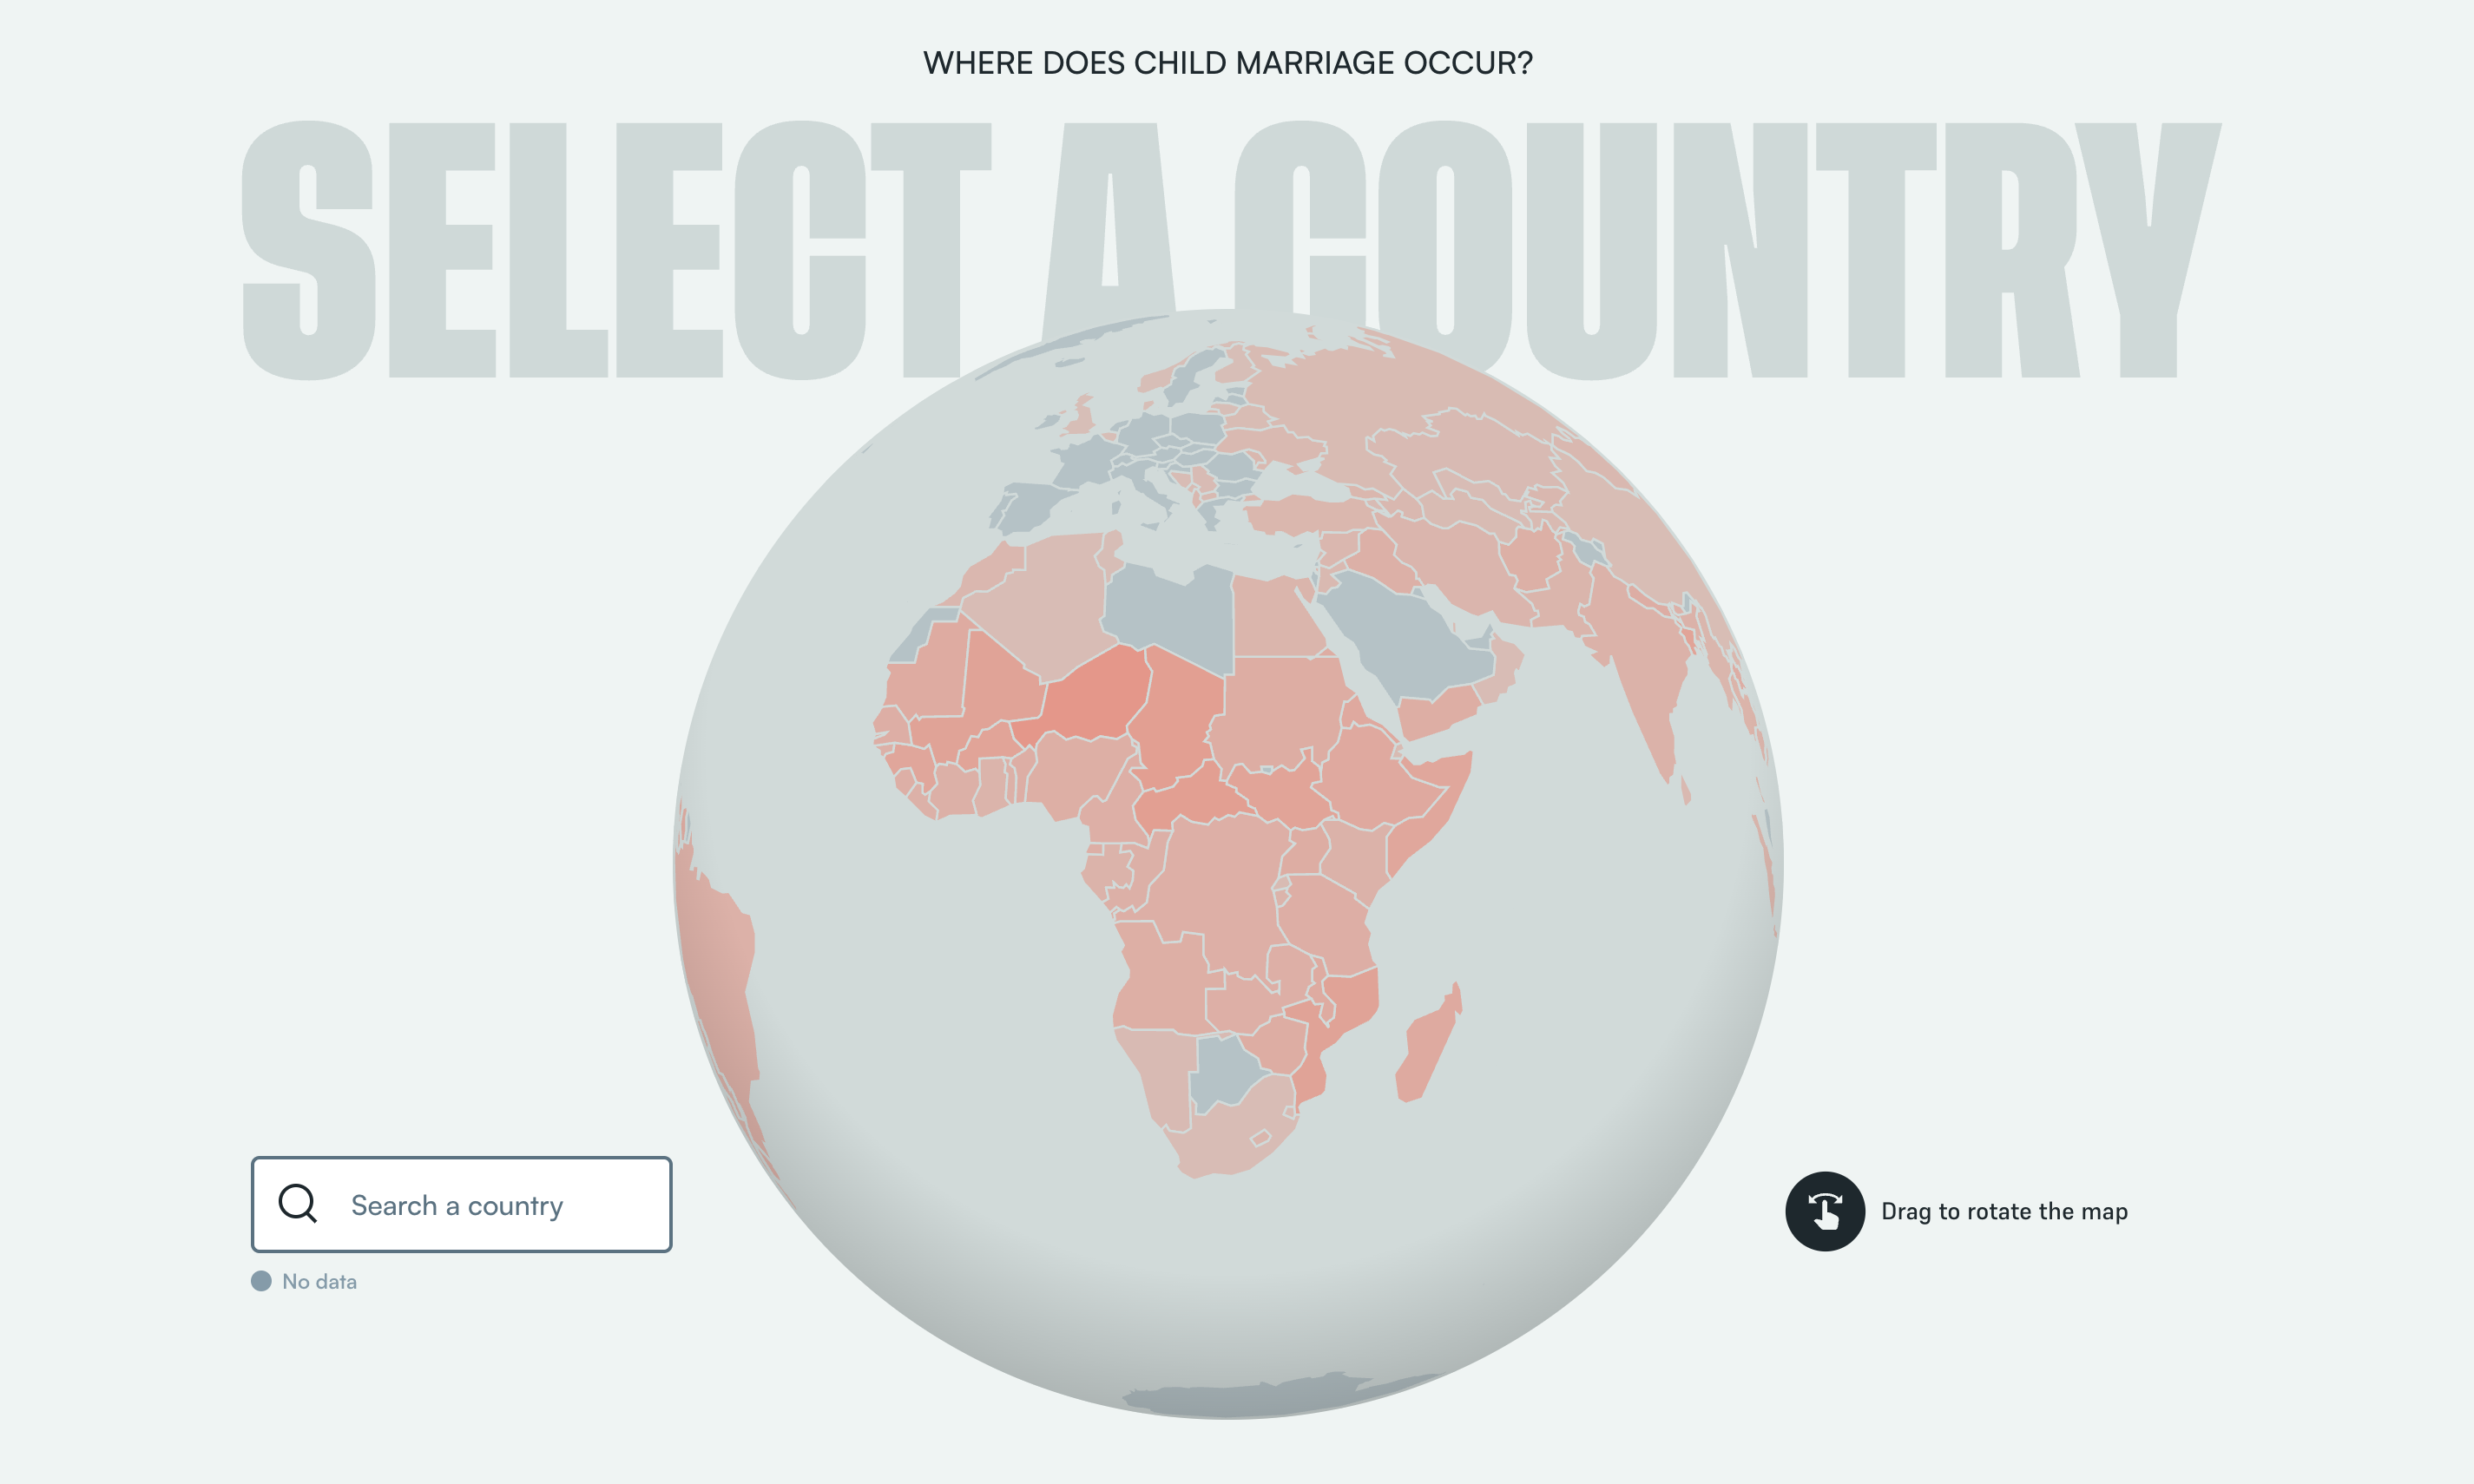
The Child Marriage Data Portal
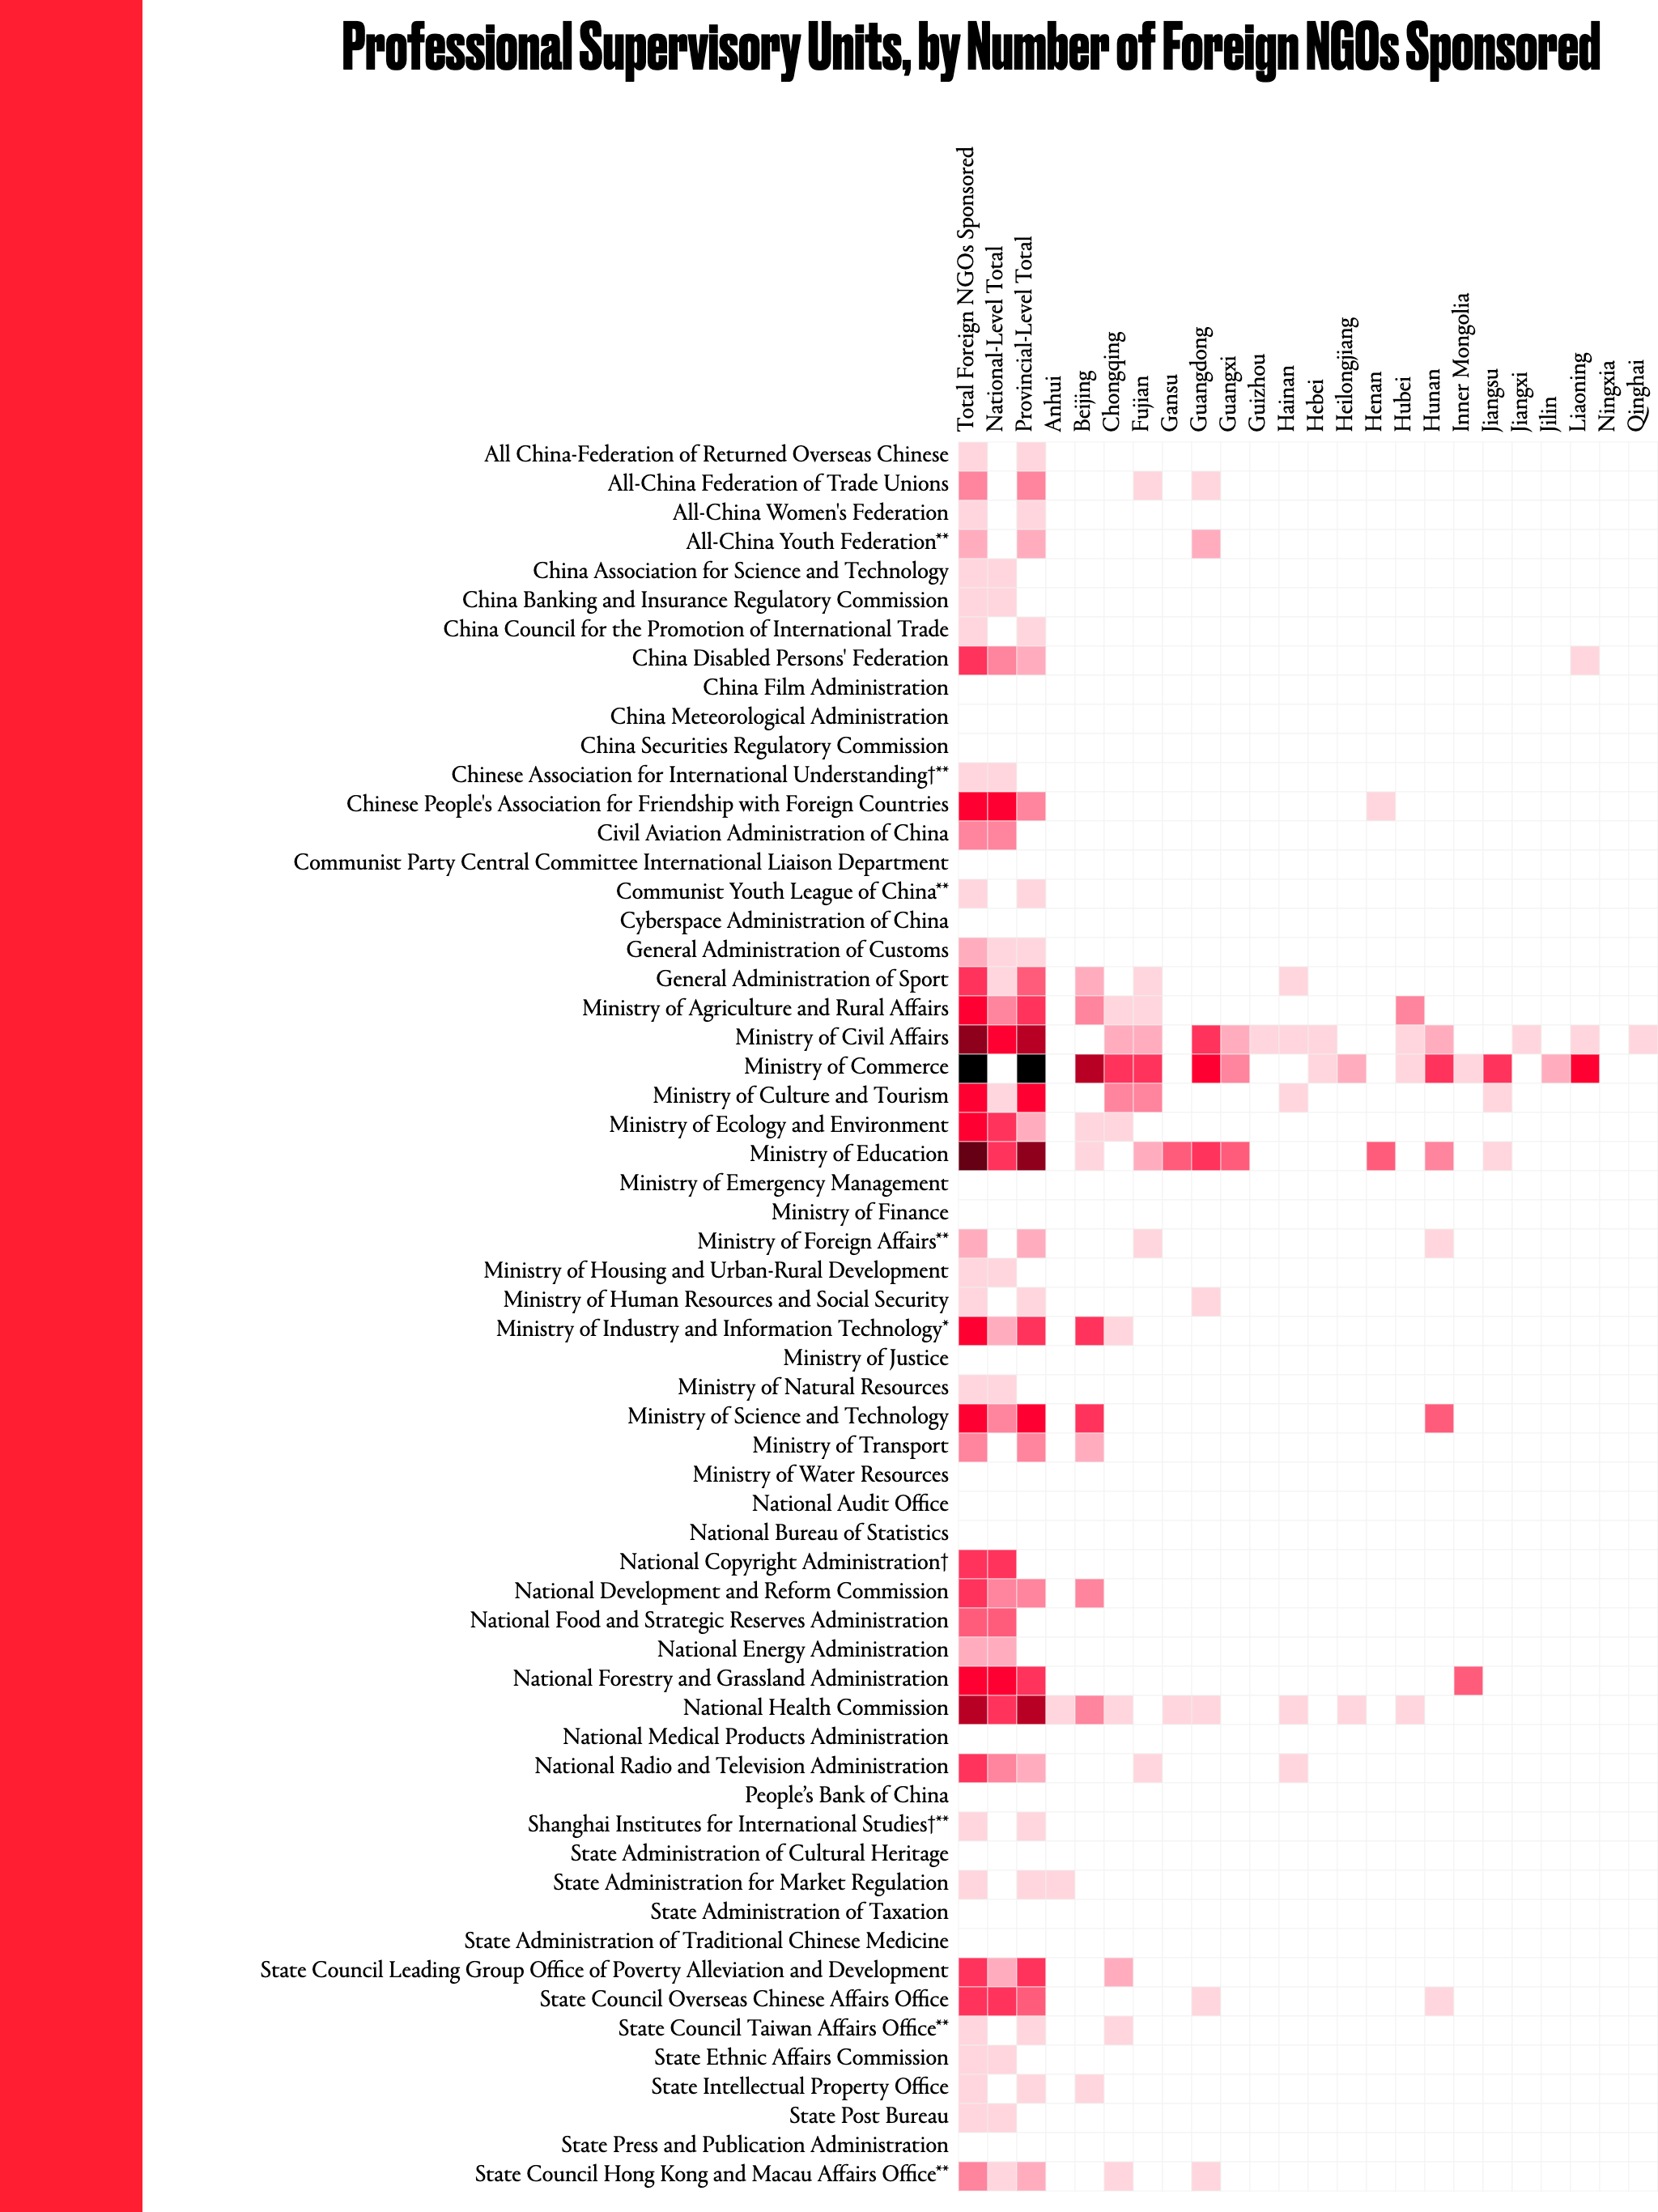
The China NGO Project
Schema Design
The Chip War
The Cleveland Museum of Art
Cleveland Museum of Art
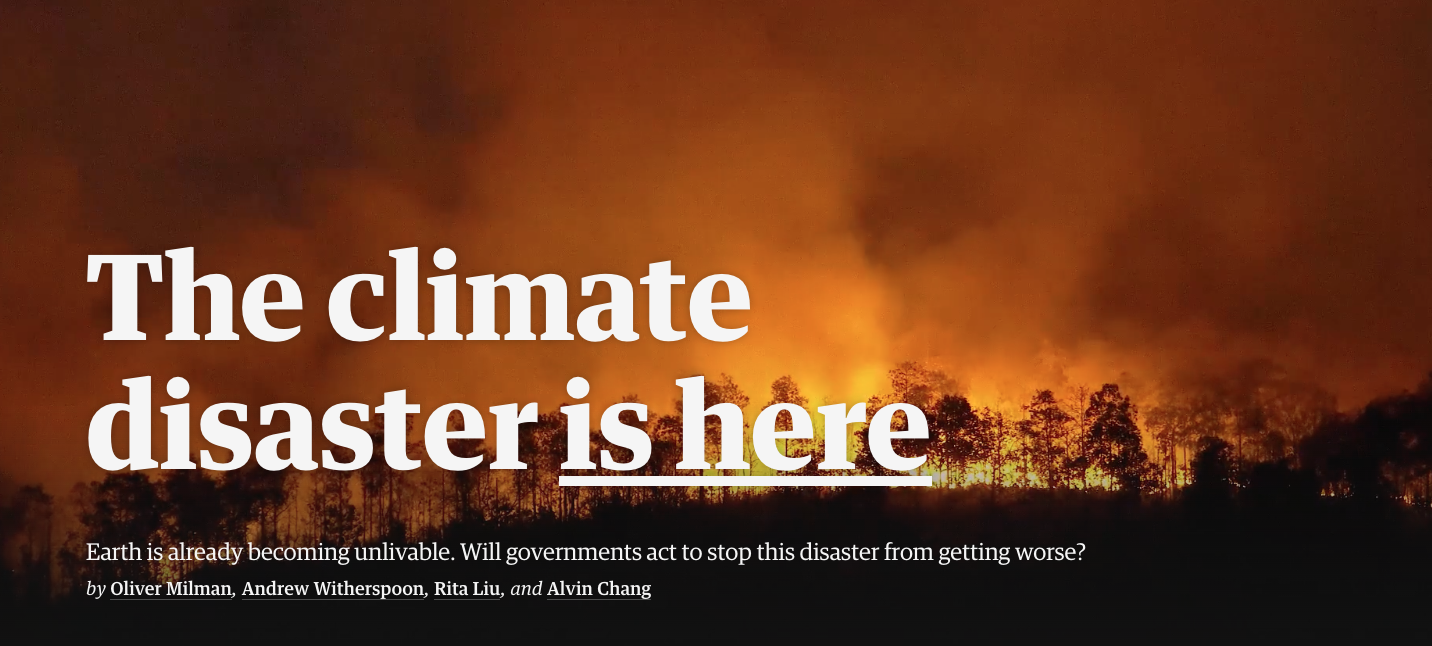
The Climate Disaster is Here, the Guardian
The Guardian
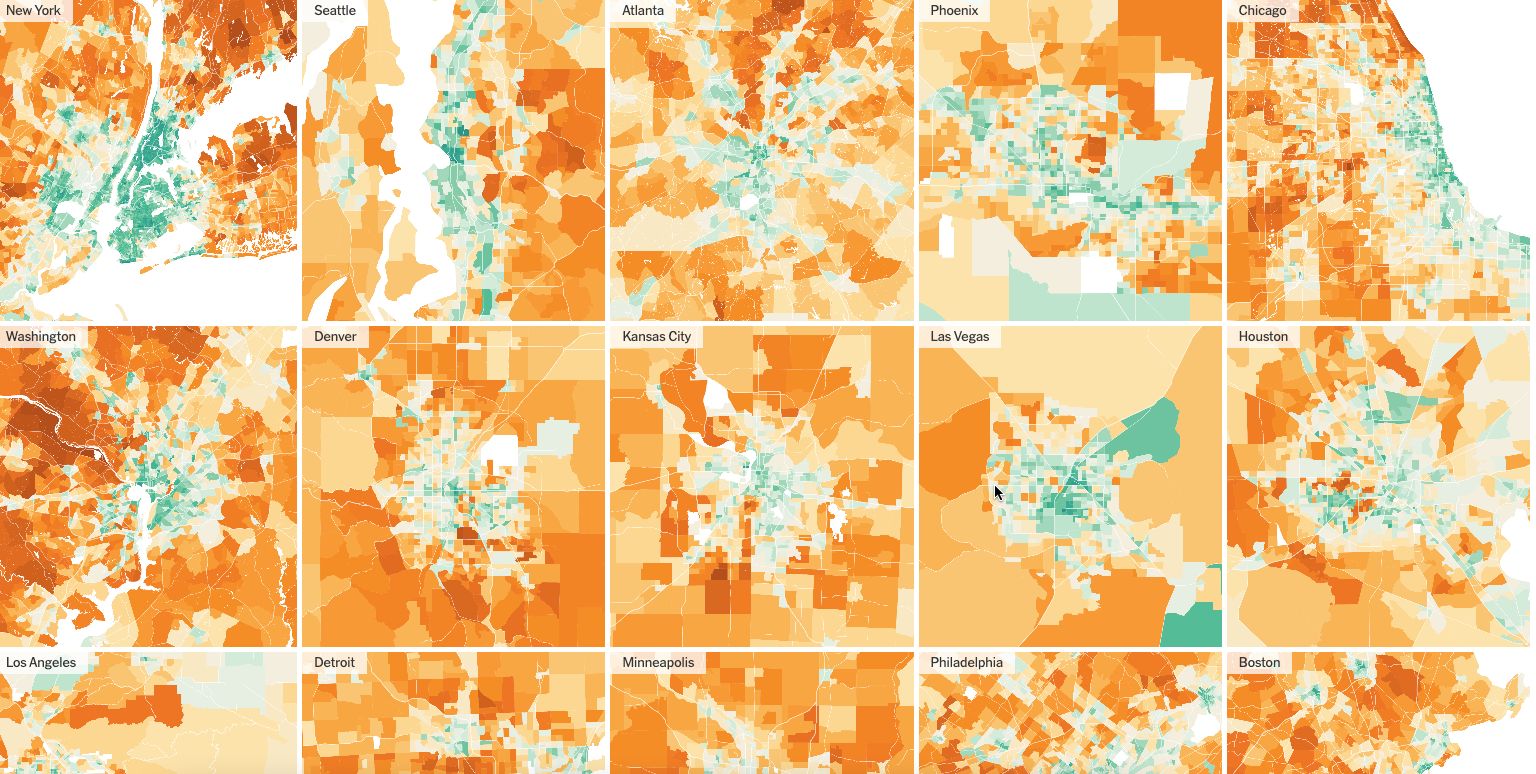
The Climate Impact of Your Neighborhood, Mapped
The New York Times
The Collapse of Insects
Reuters
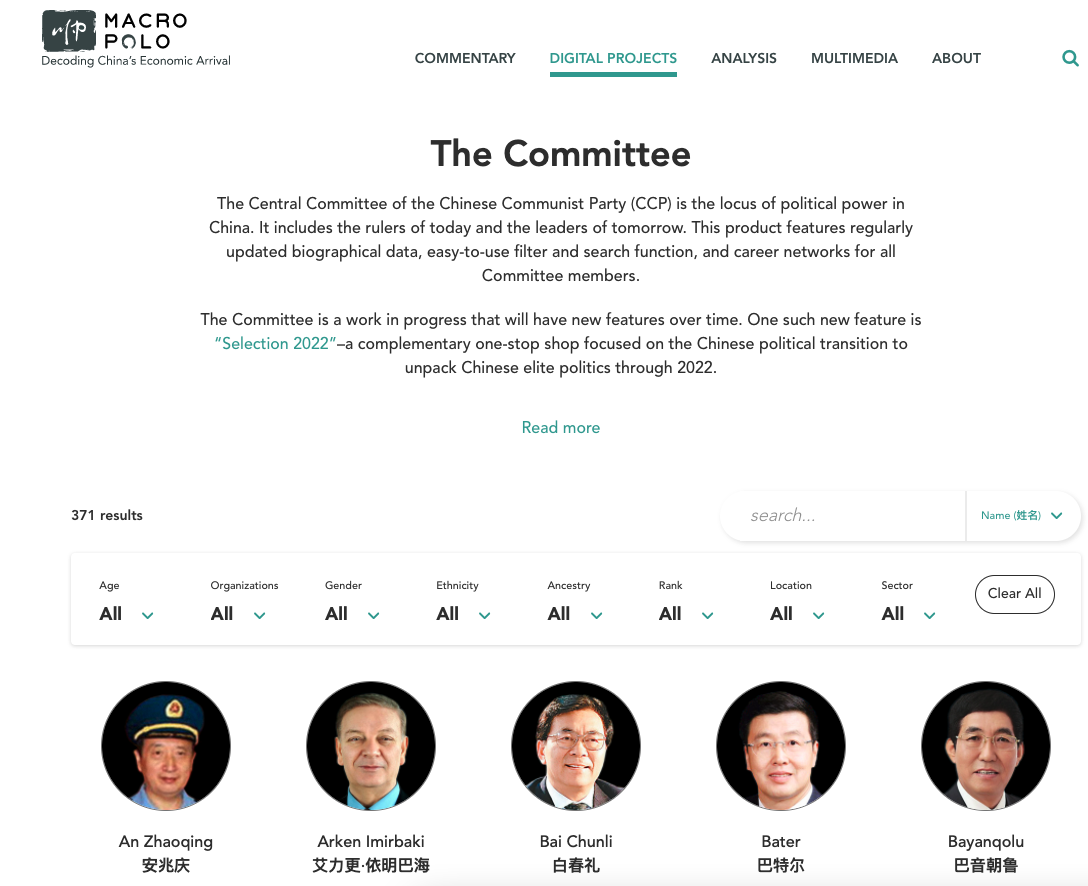
The Committee
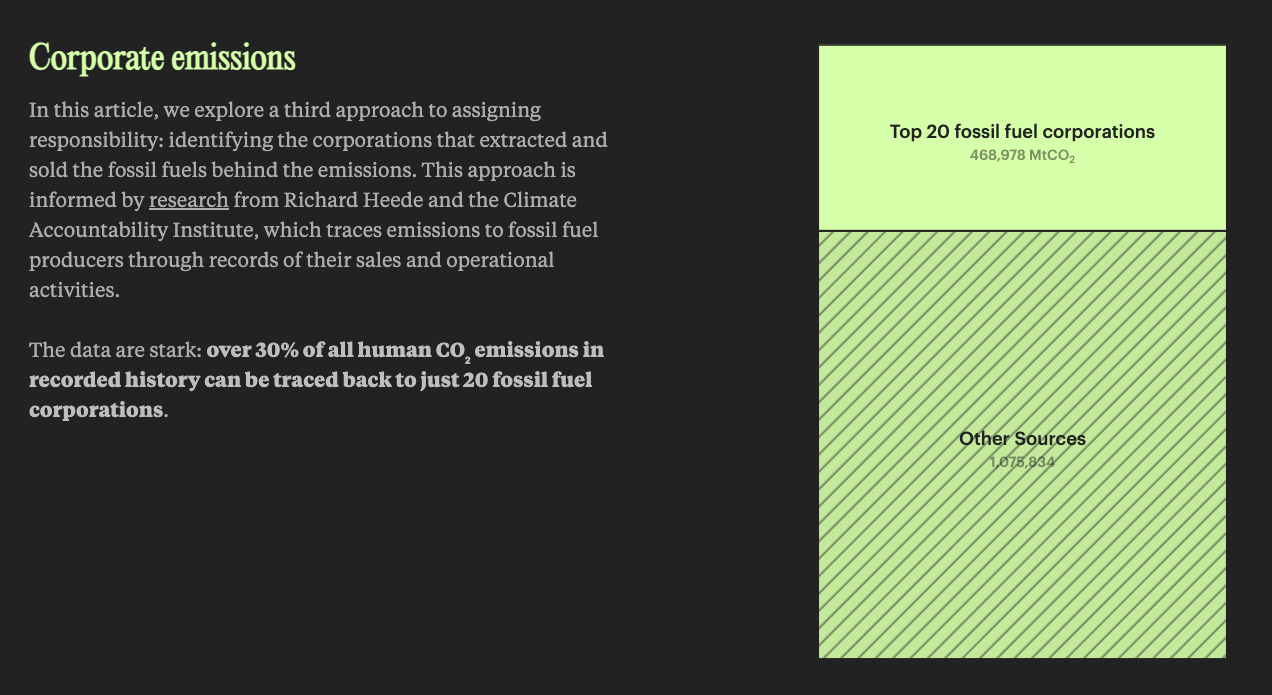
The Corporations Behind Climate Change
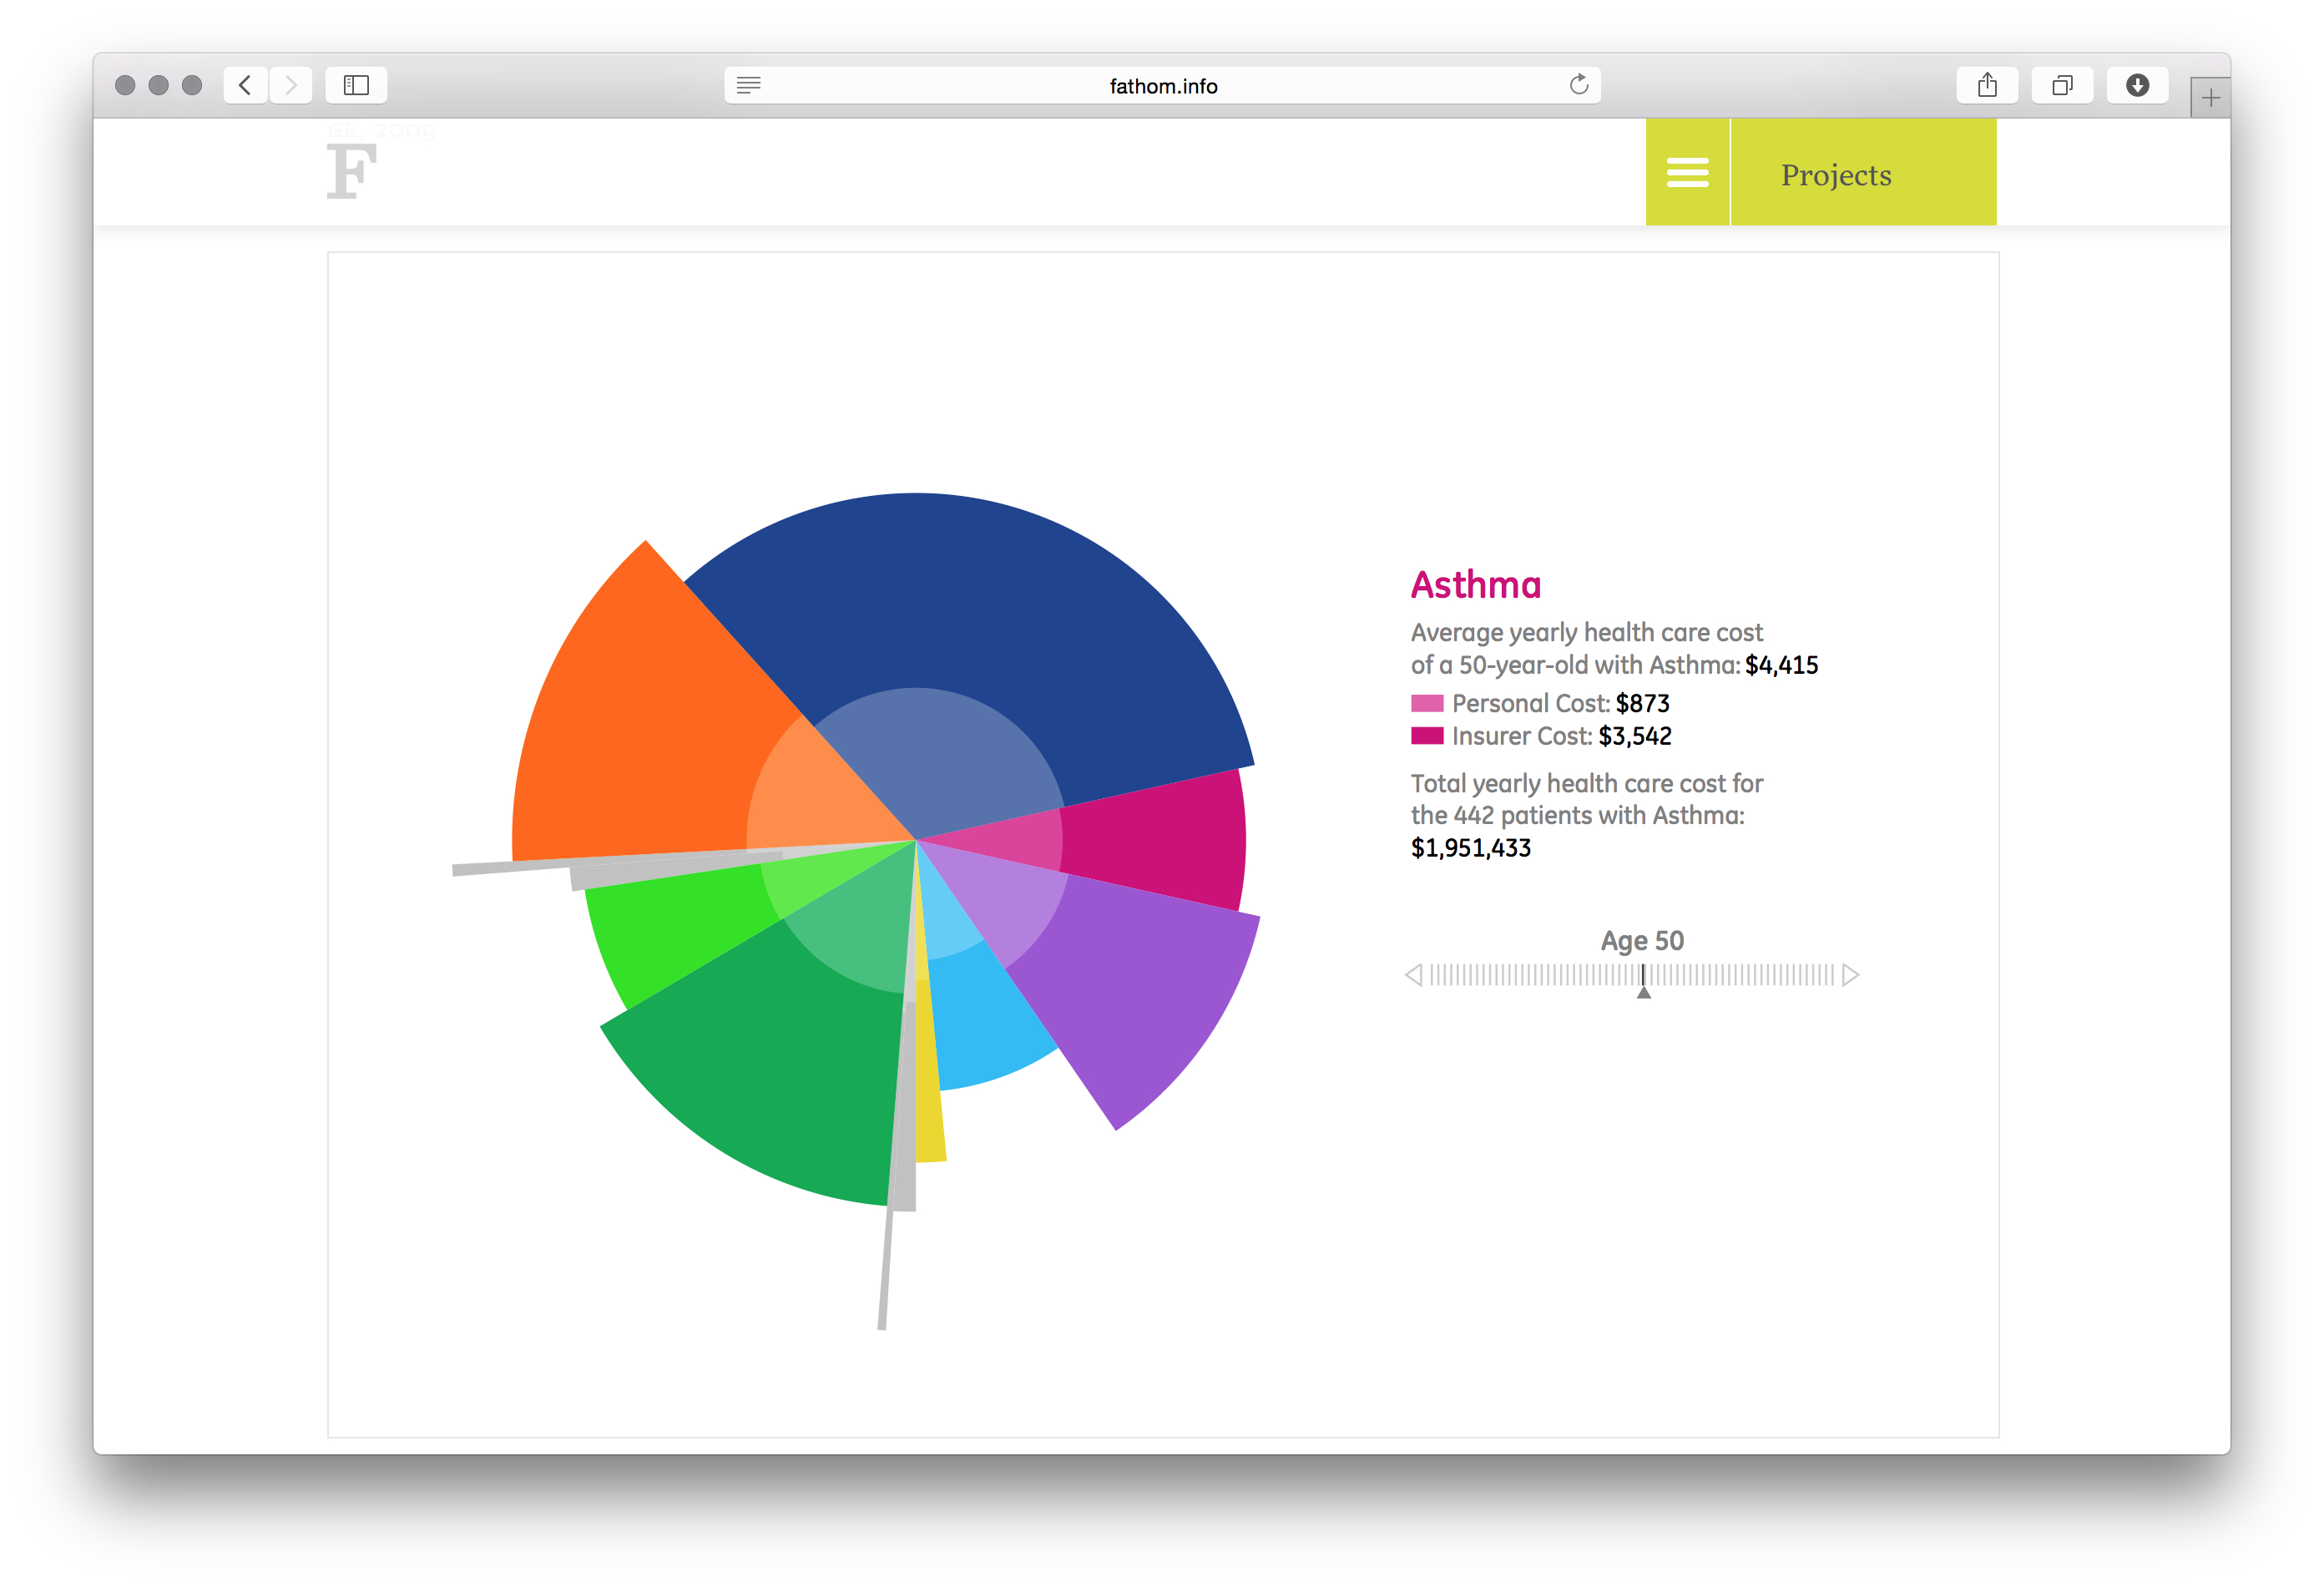
The Cost of Getting Sick
Fathom Information Design
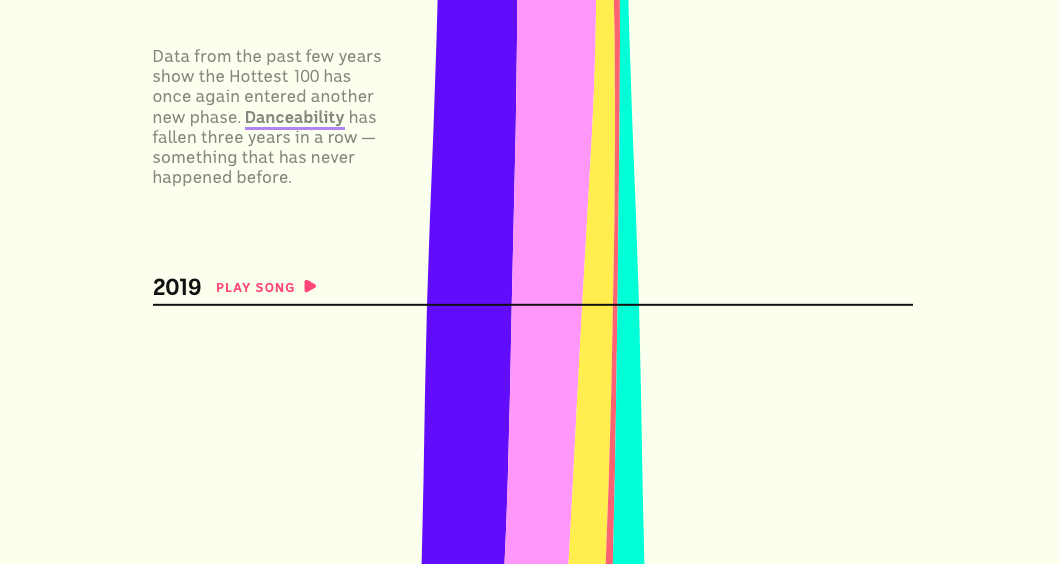
The Cultural Evolution of the Hottest 100
ABC News
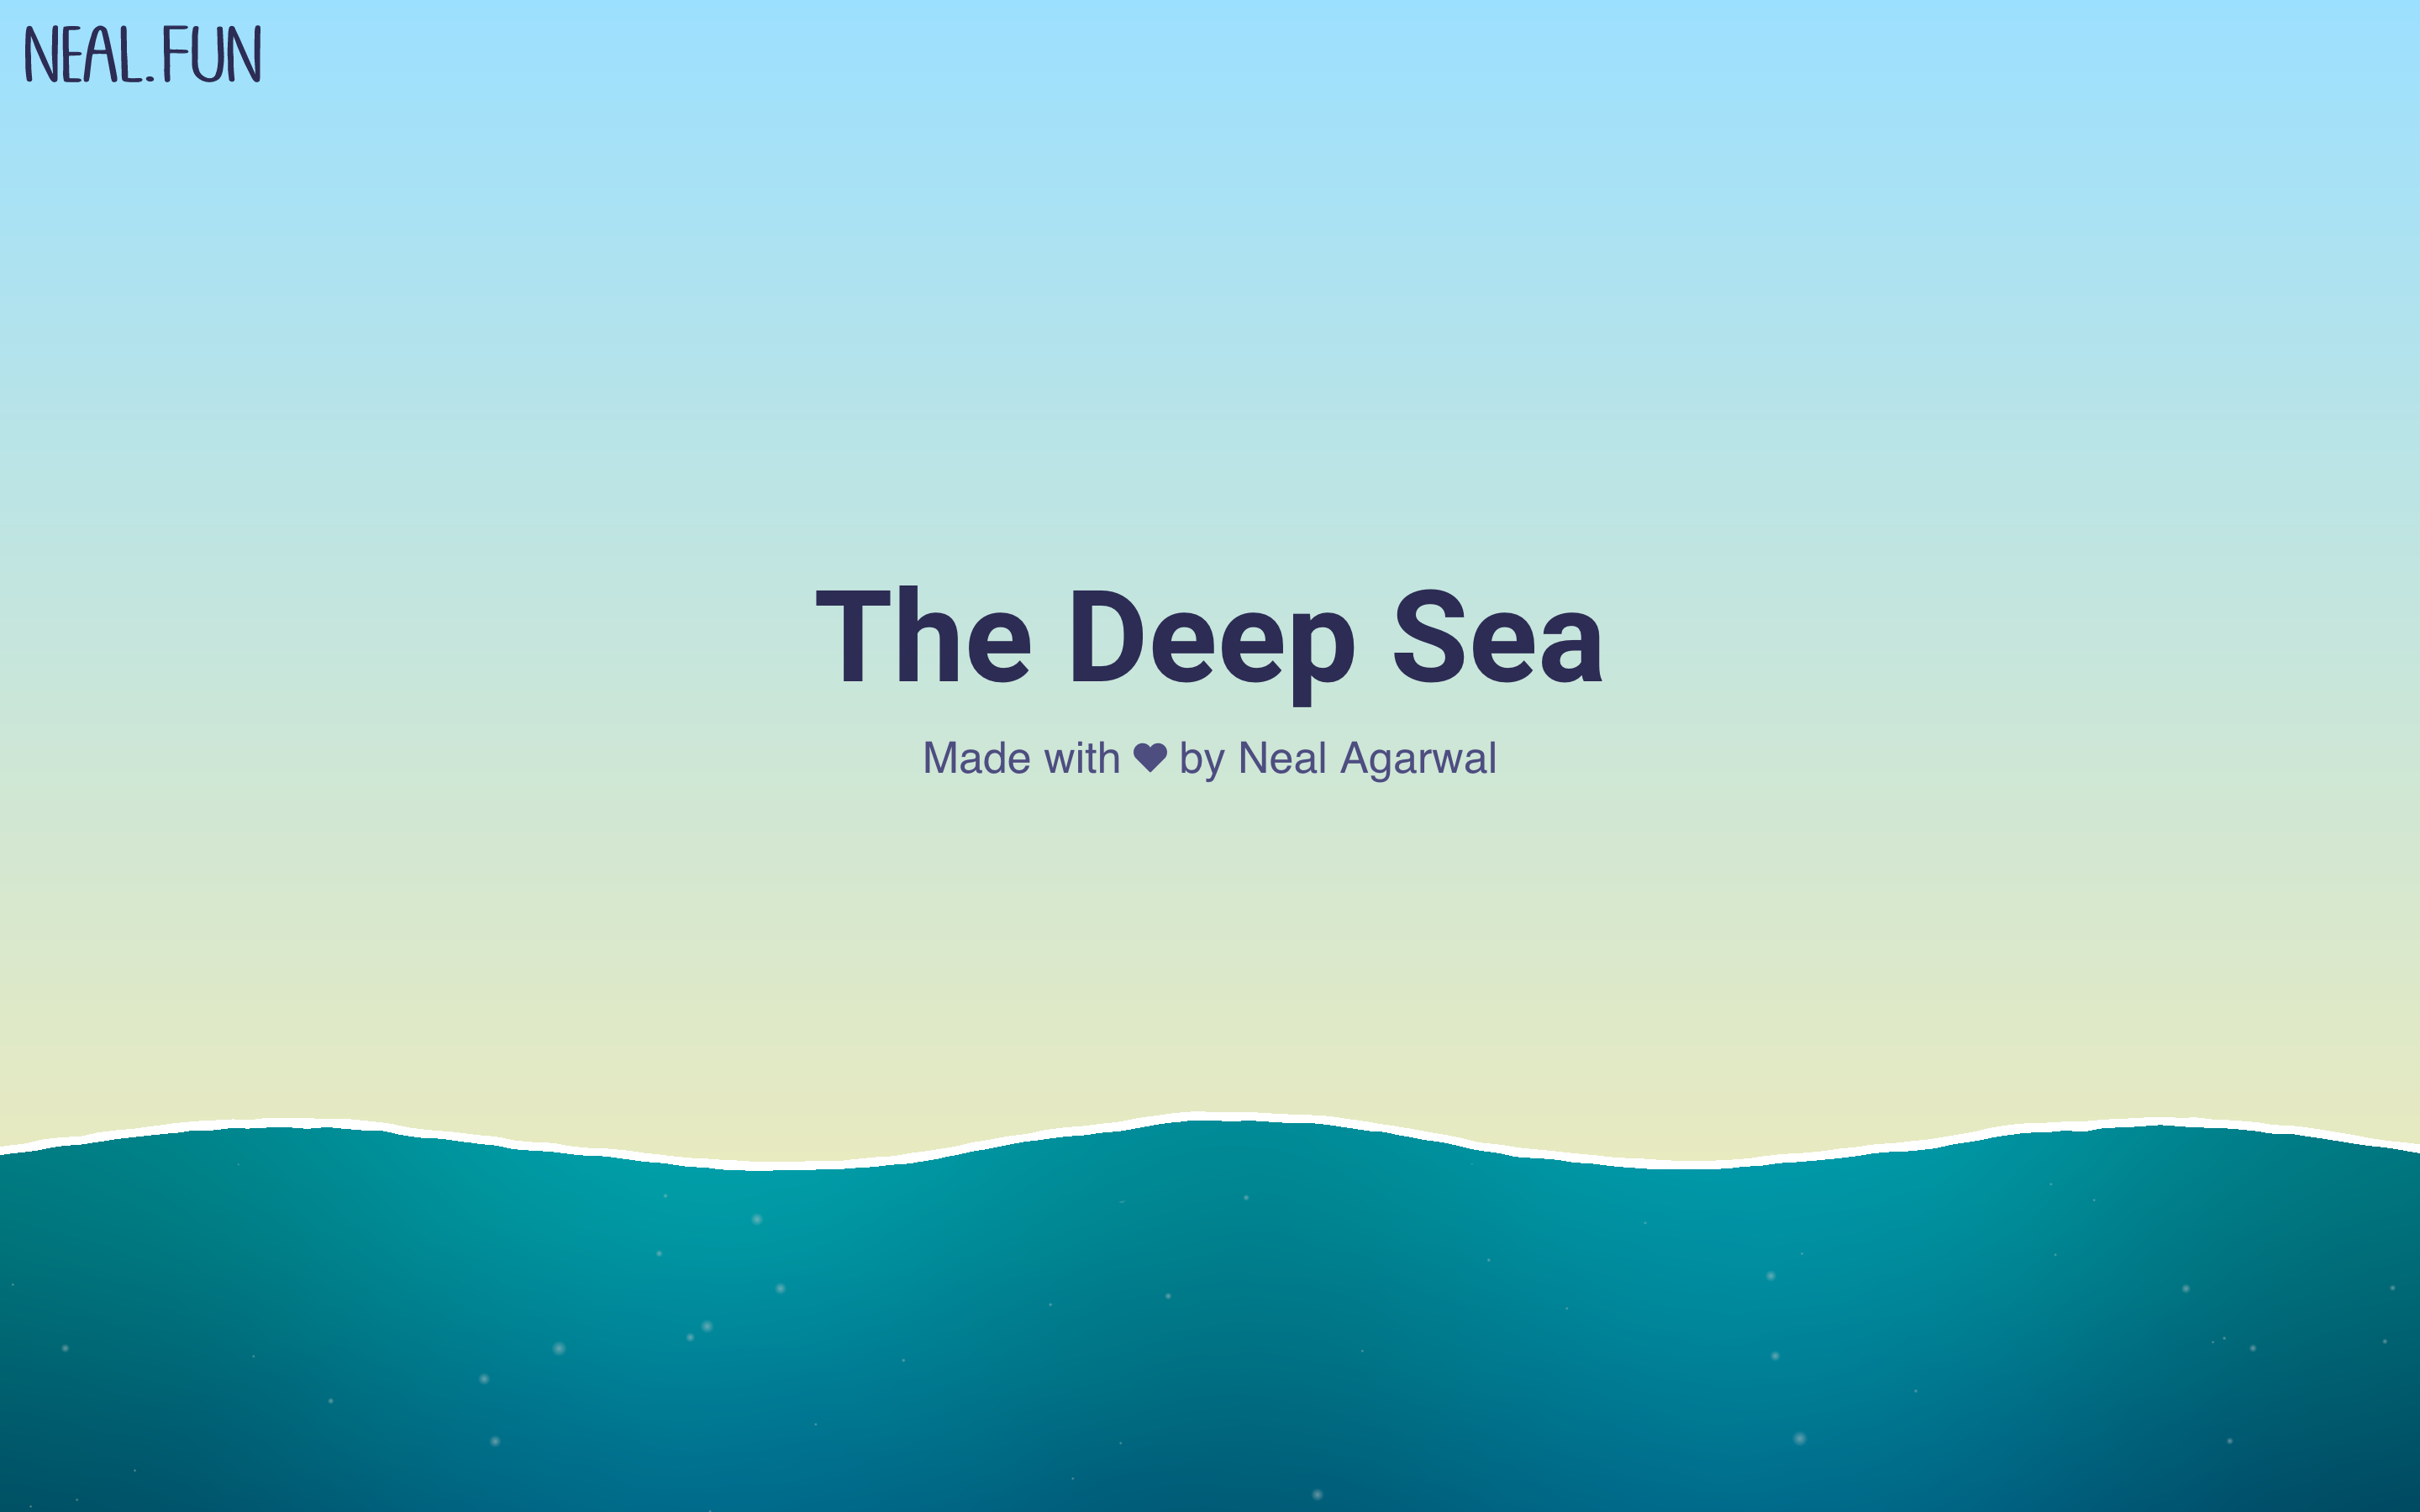
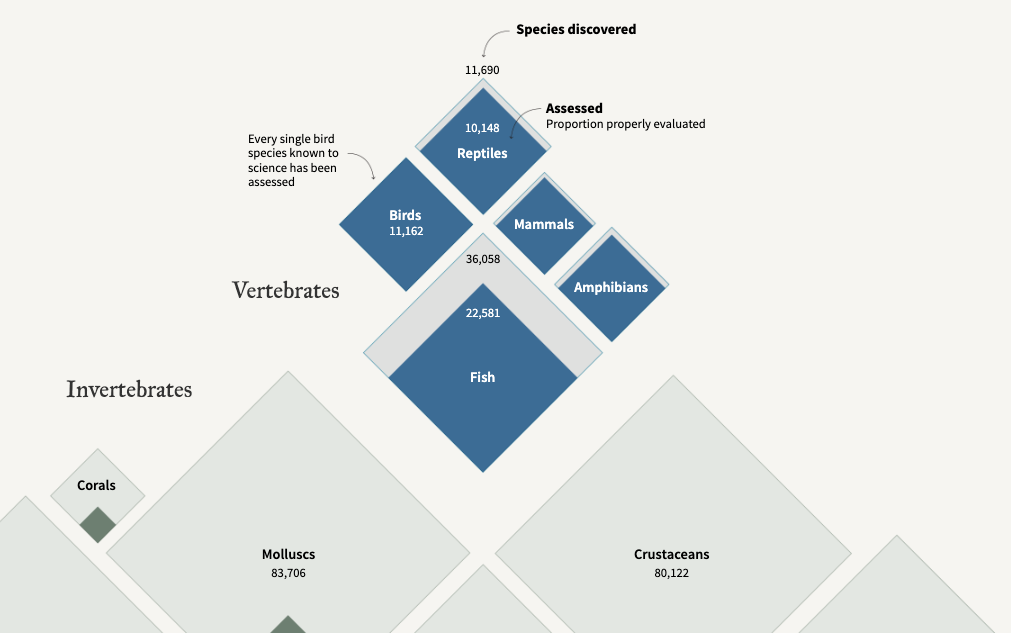
The Deep Sea
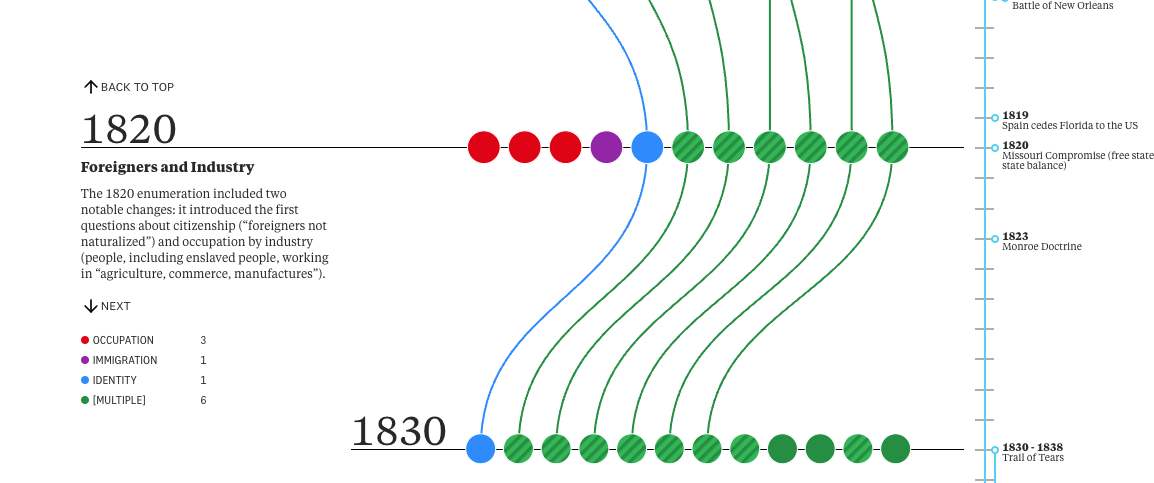
The Evolution of the American Census
Pudding
The Executive’s Guide to New-business Building
McKinsey
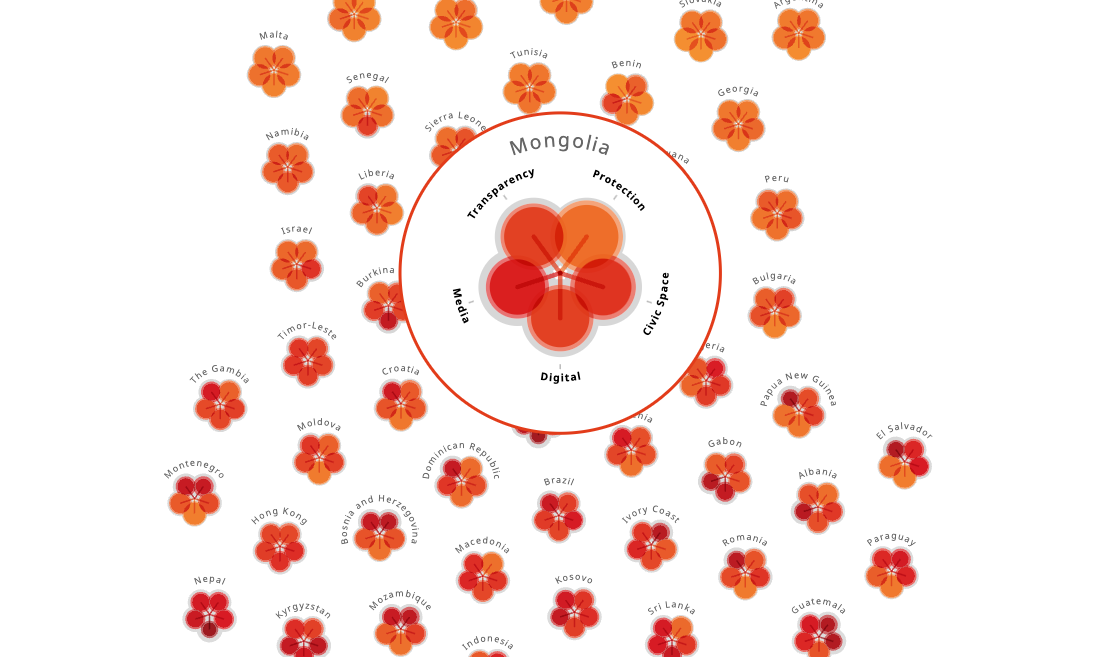
The Freedom of Expression 2016

The Gates Foundation
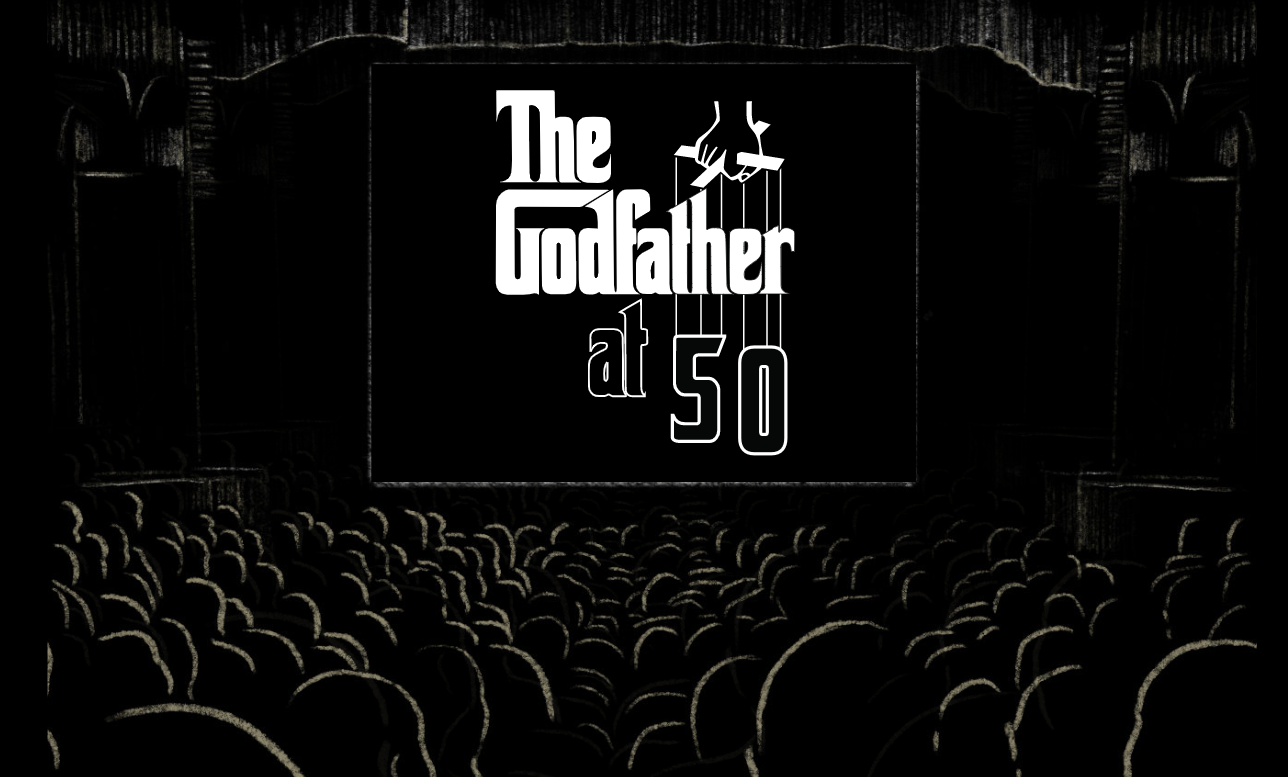
The Godfather at 50, Reuters
Reuters
The Good Country Index
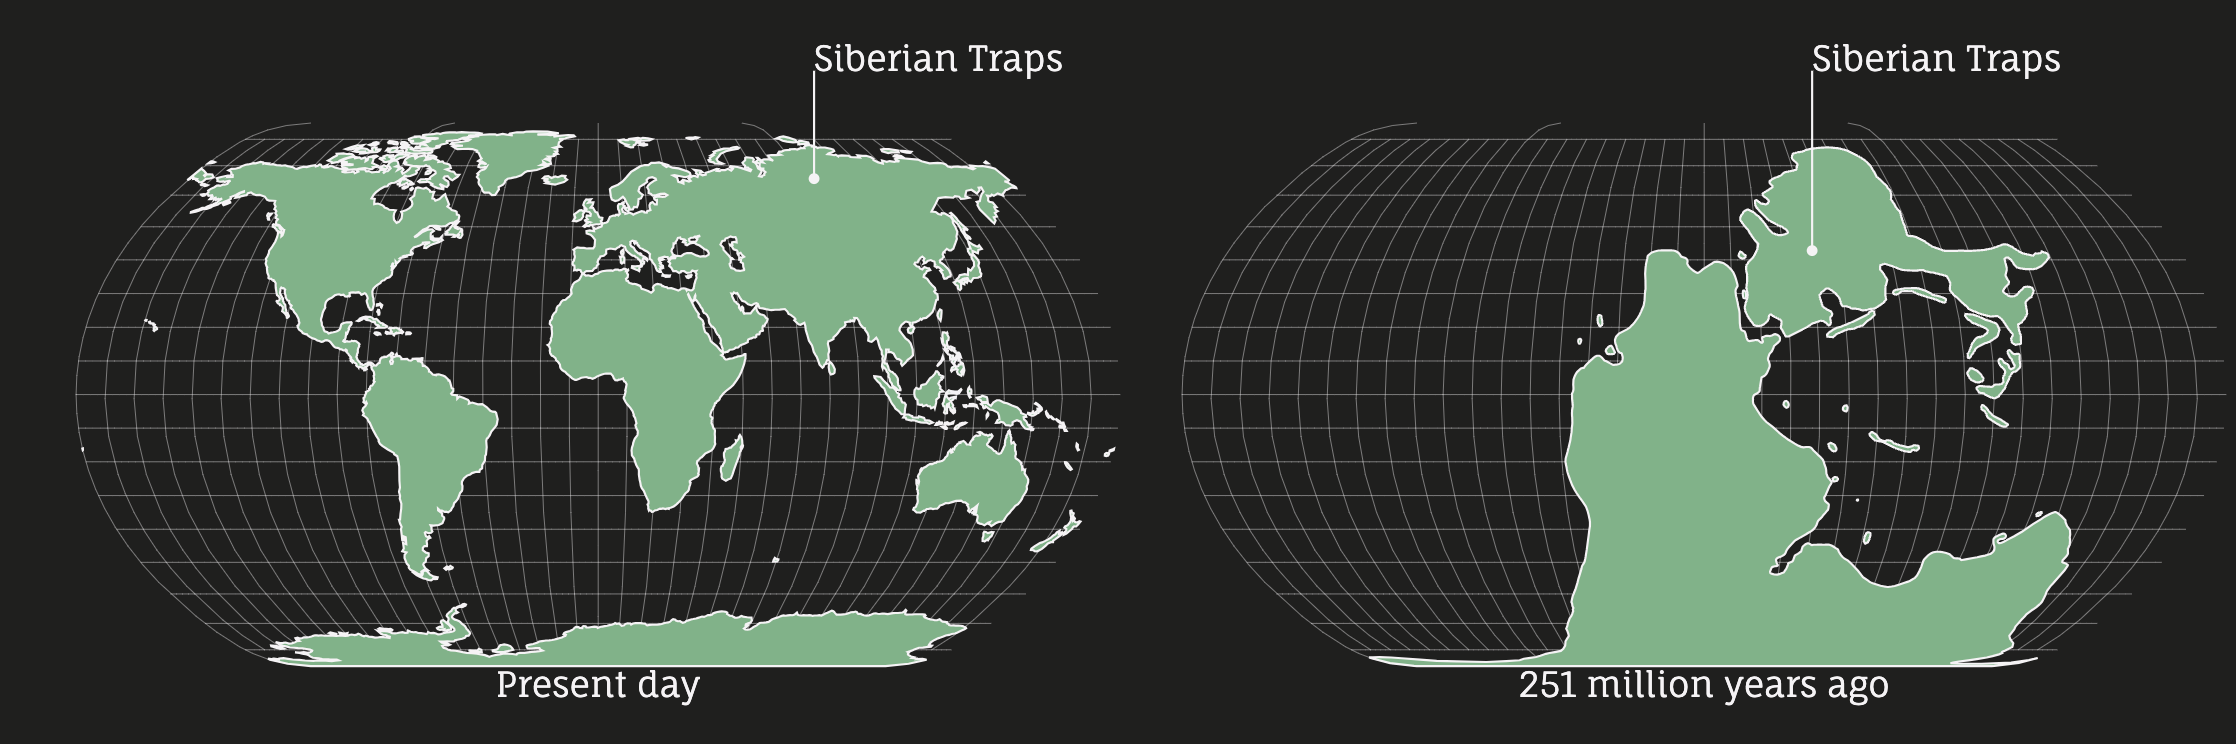
The Great Dying
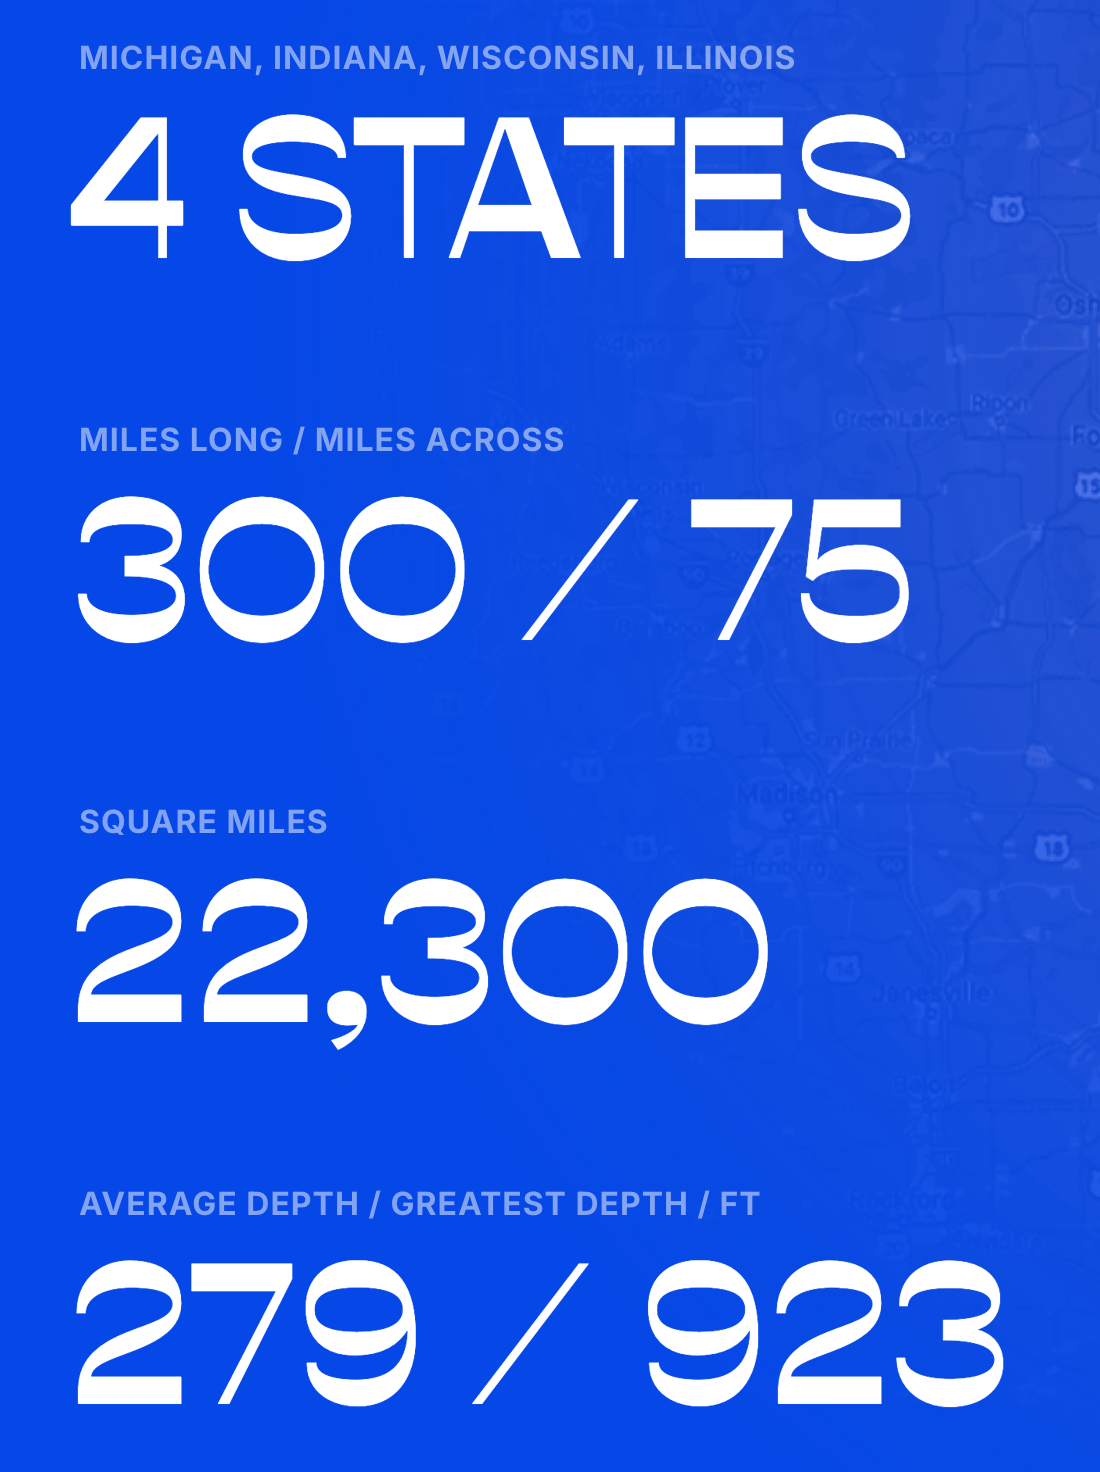
The Great Lake
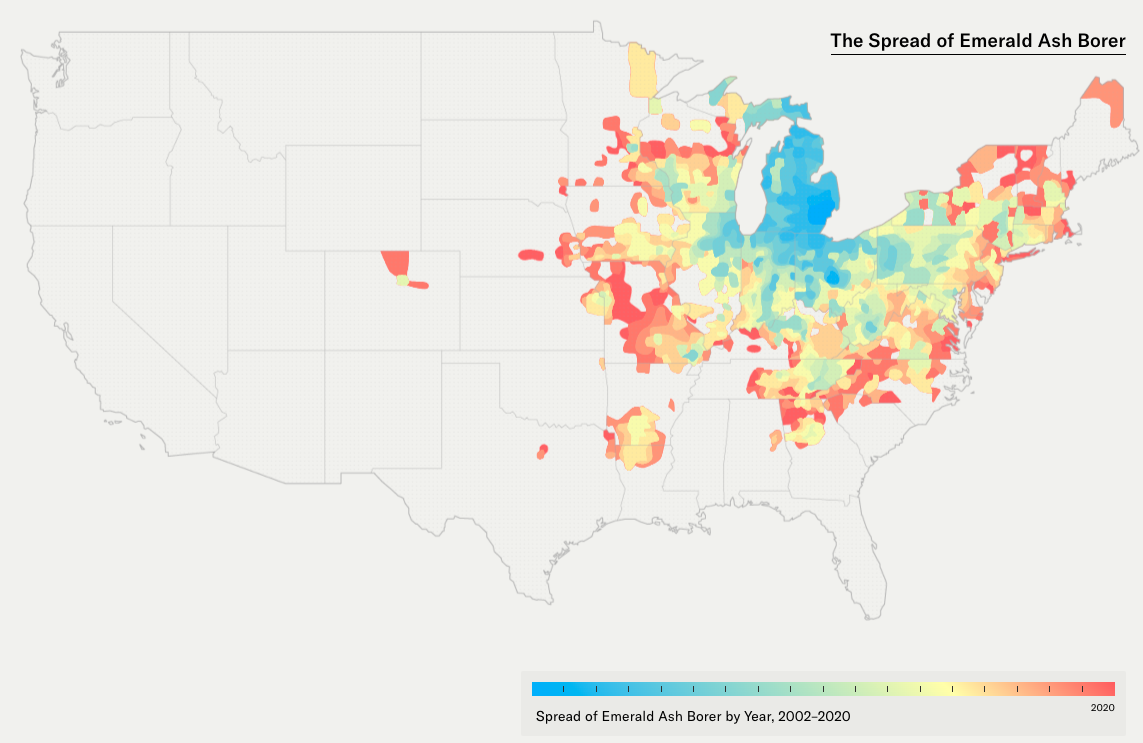
The Great Tree Migration
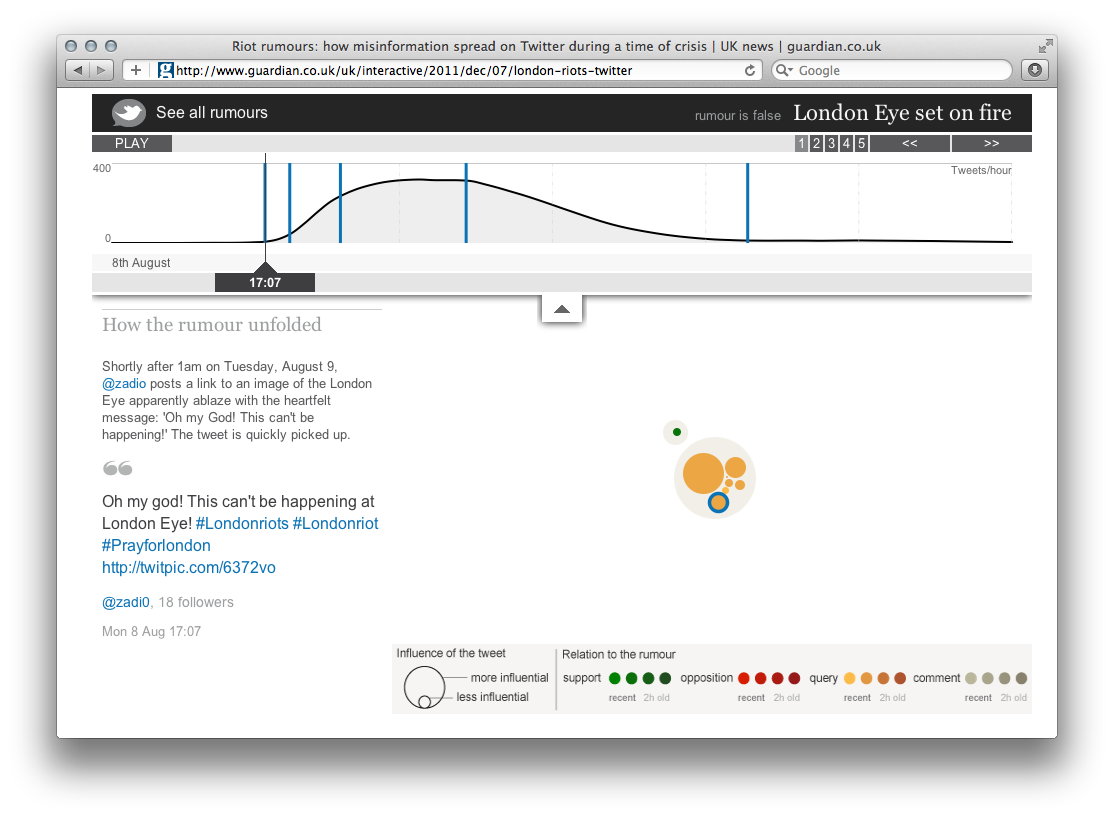
The Guardian Interactives
The Guardian
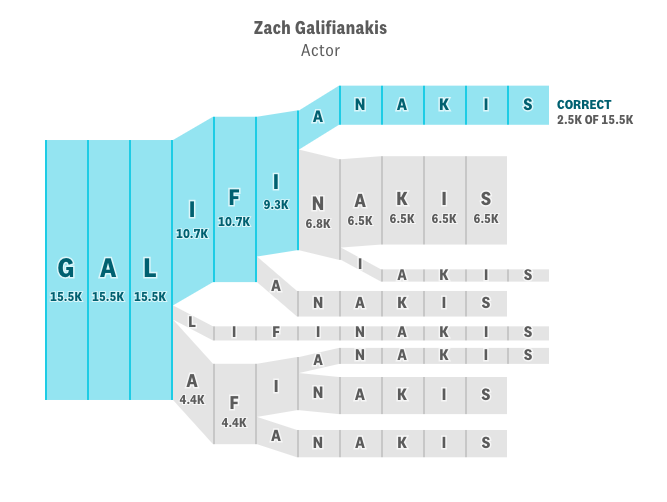
The Gyllenhaal Experiment, Celebrity Name Spelling
Pudding
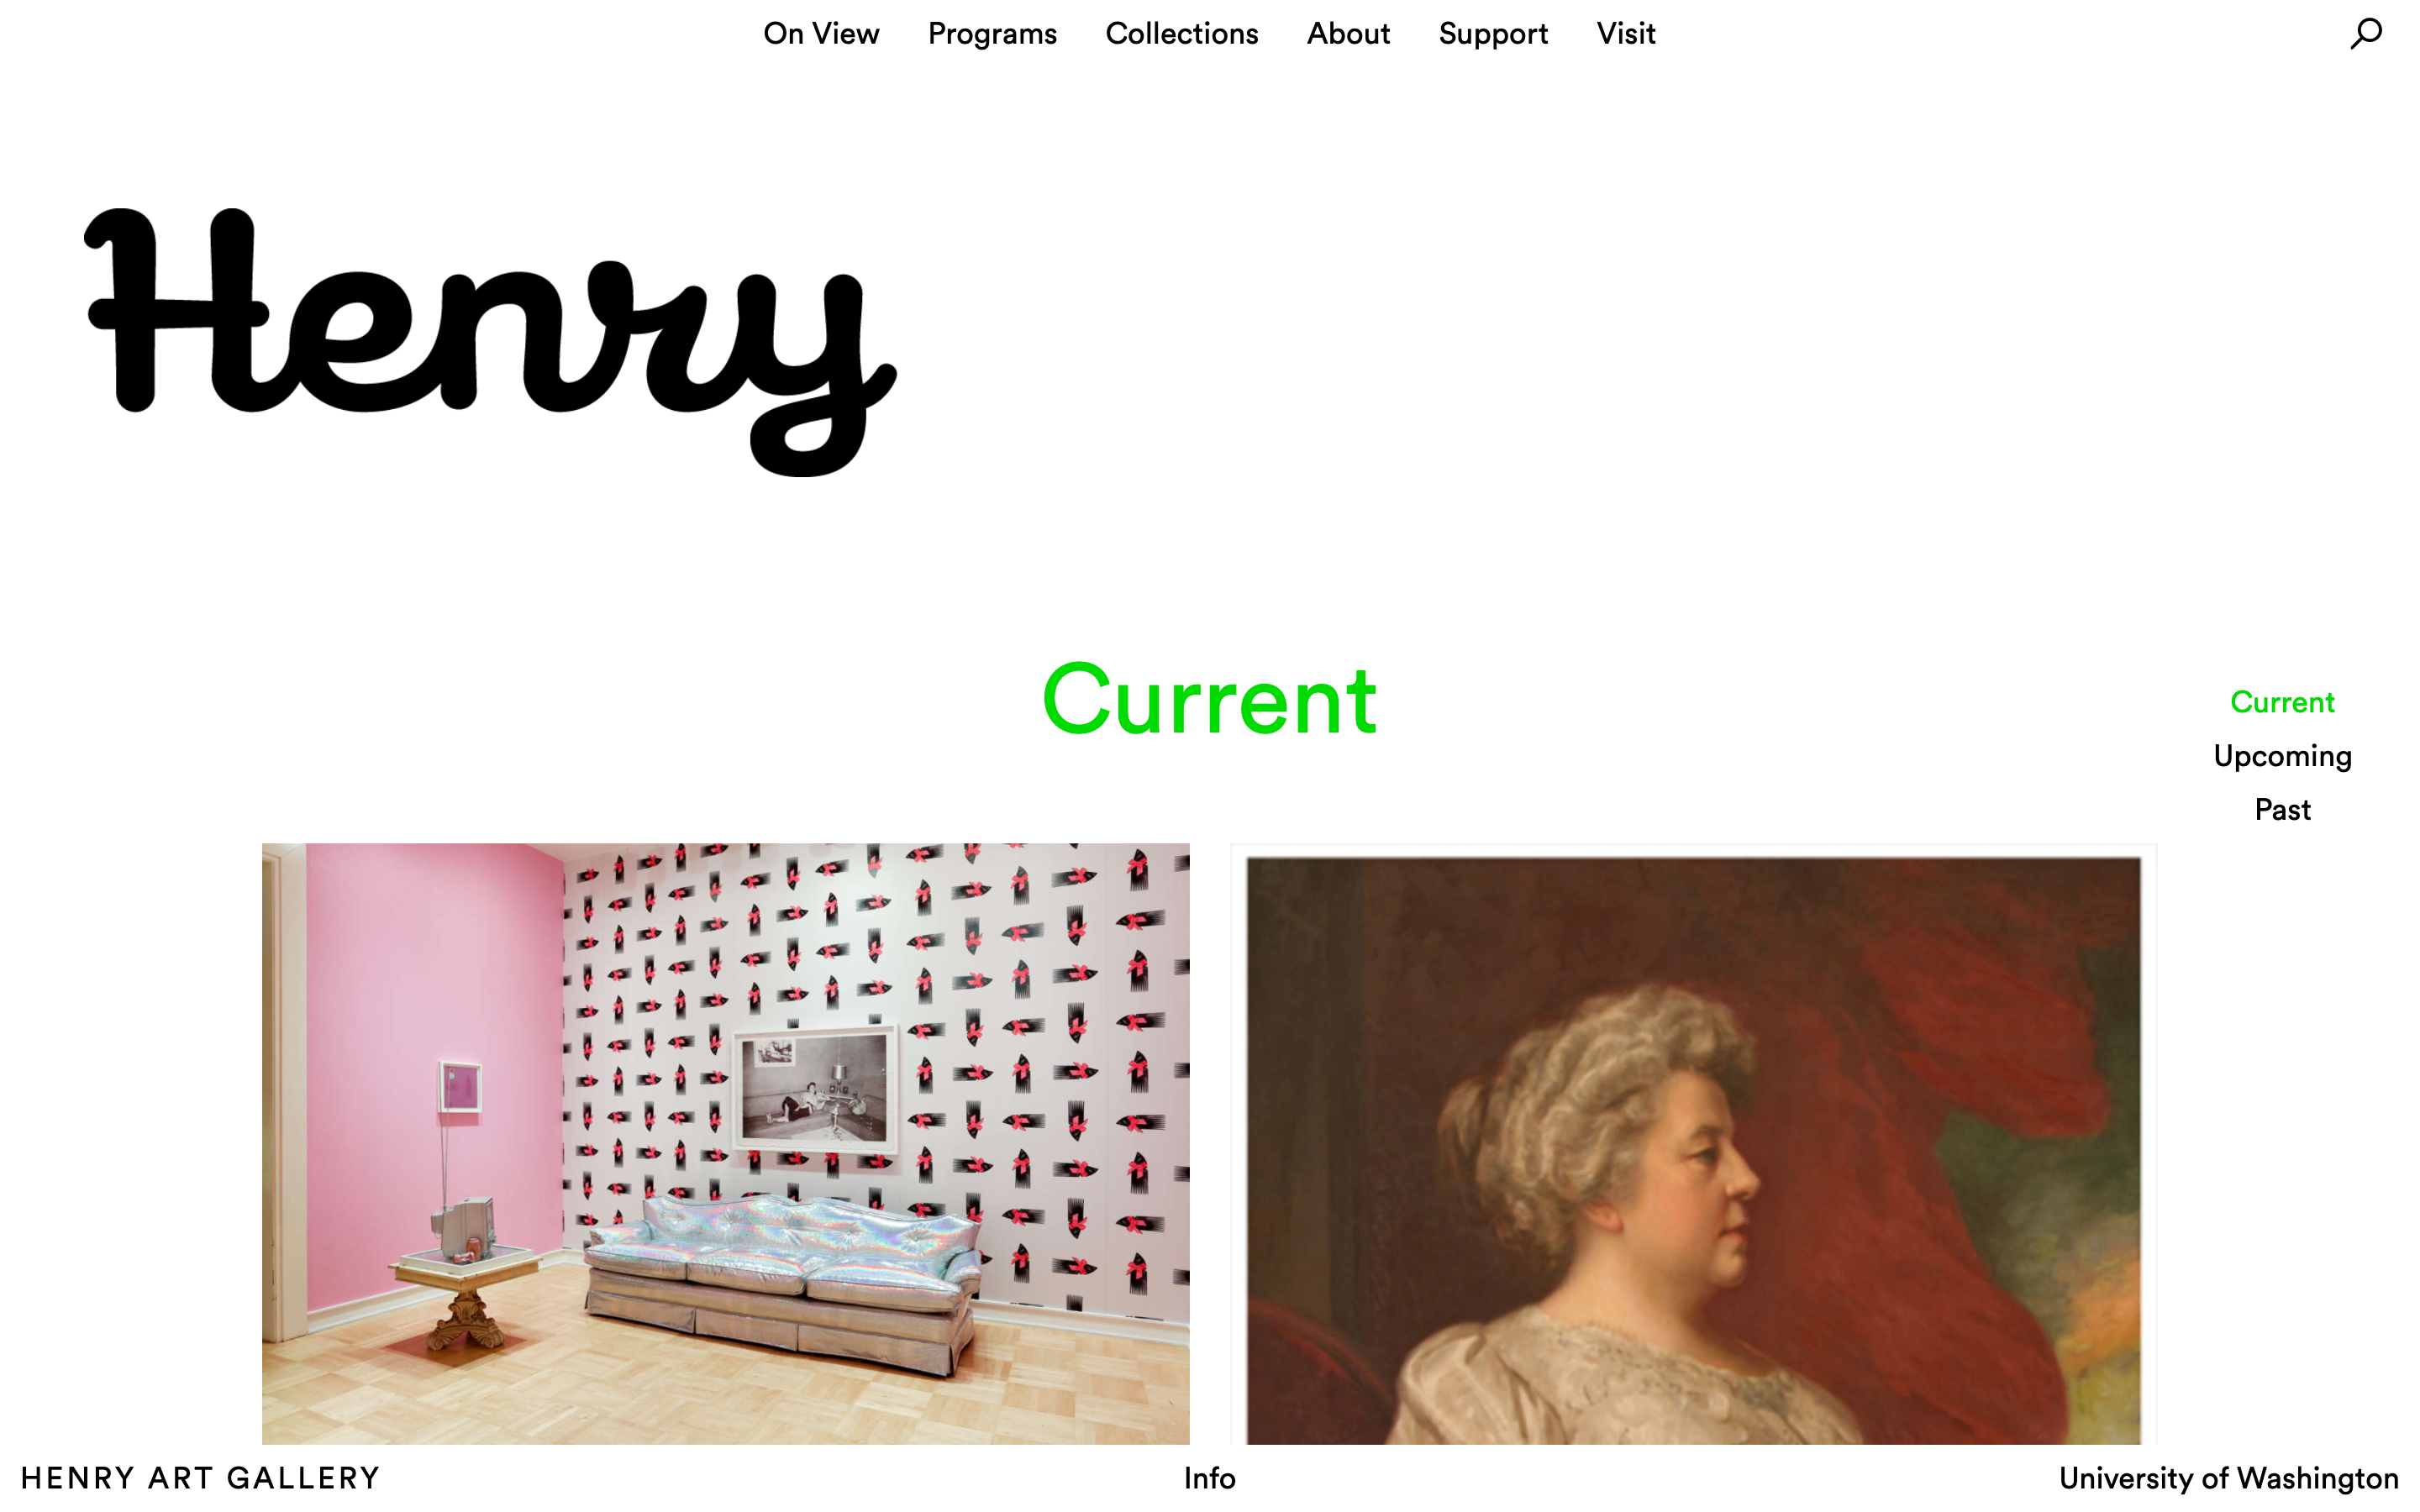
The Henry Website
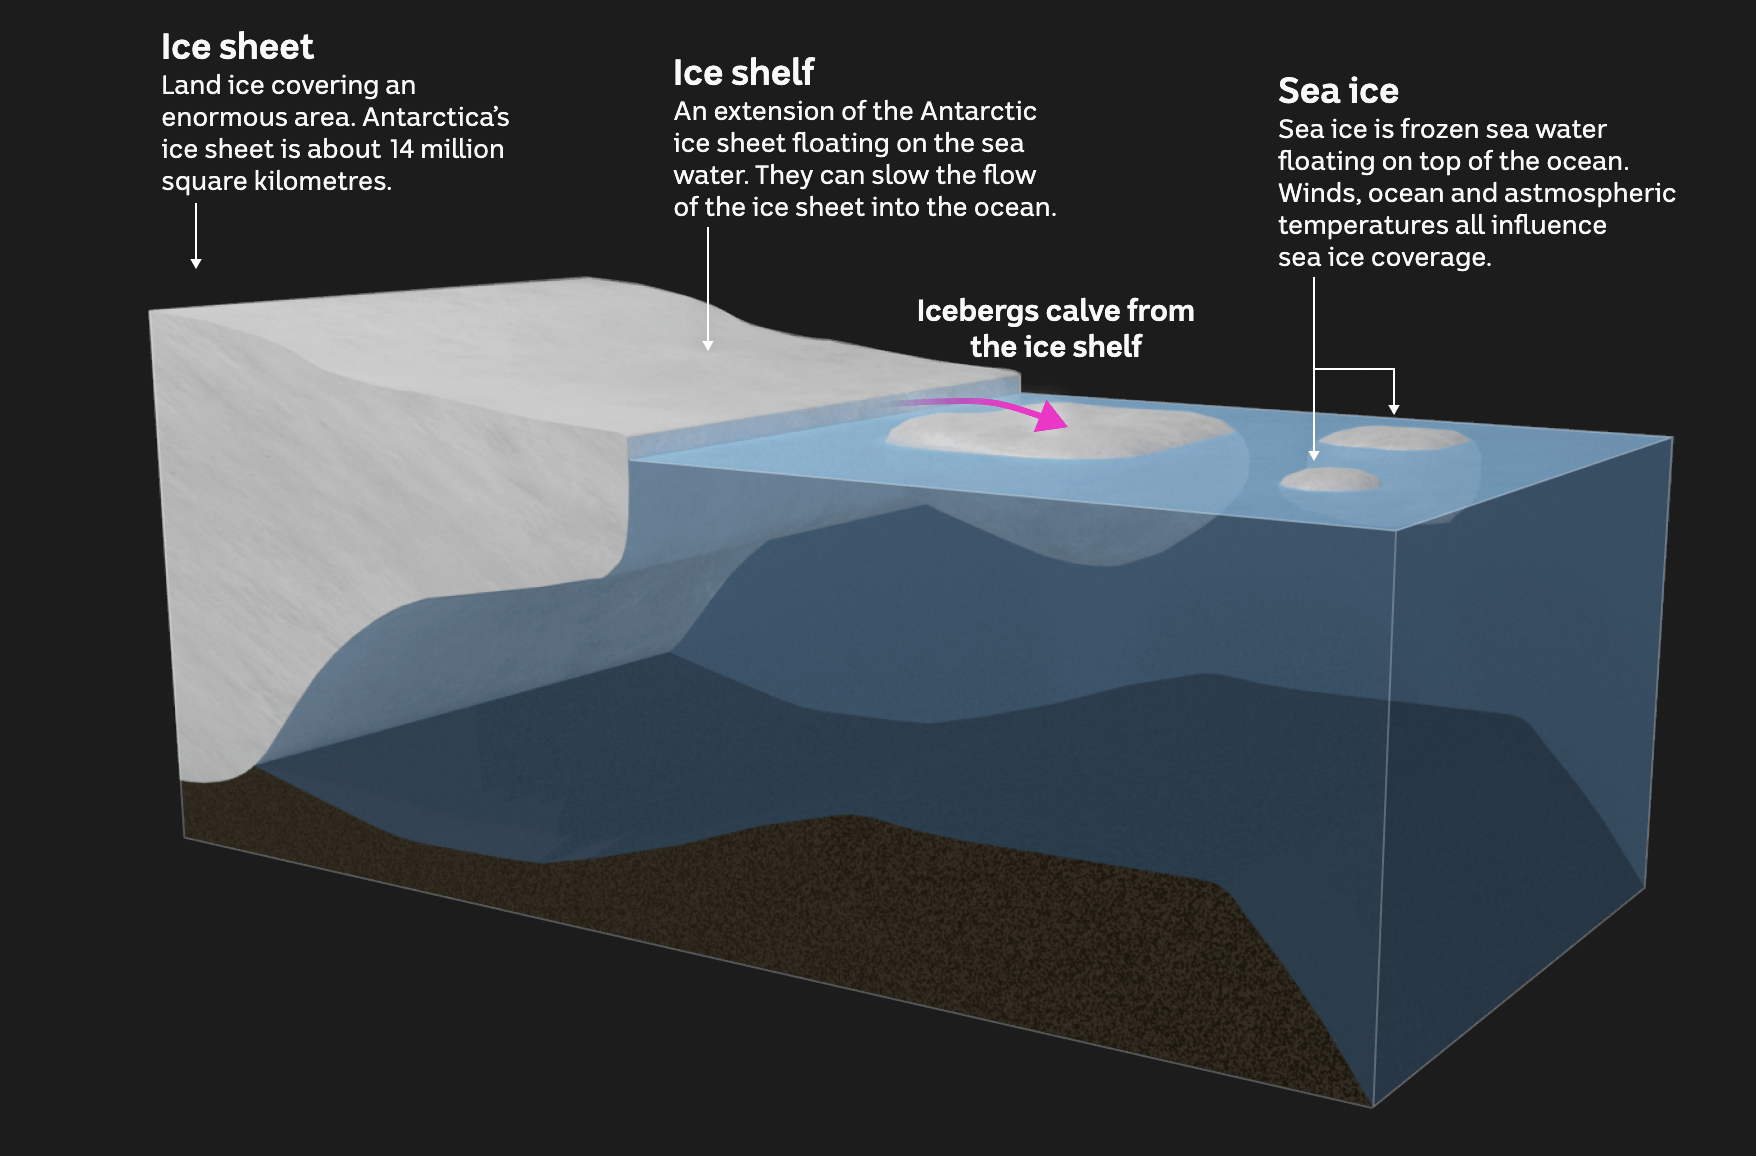
The Icy Pulse, Abc News
ABC News
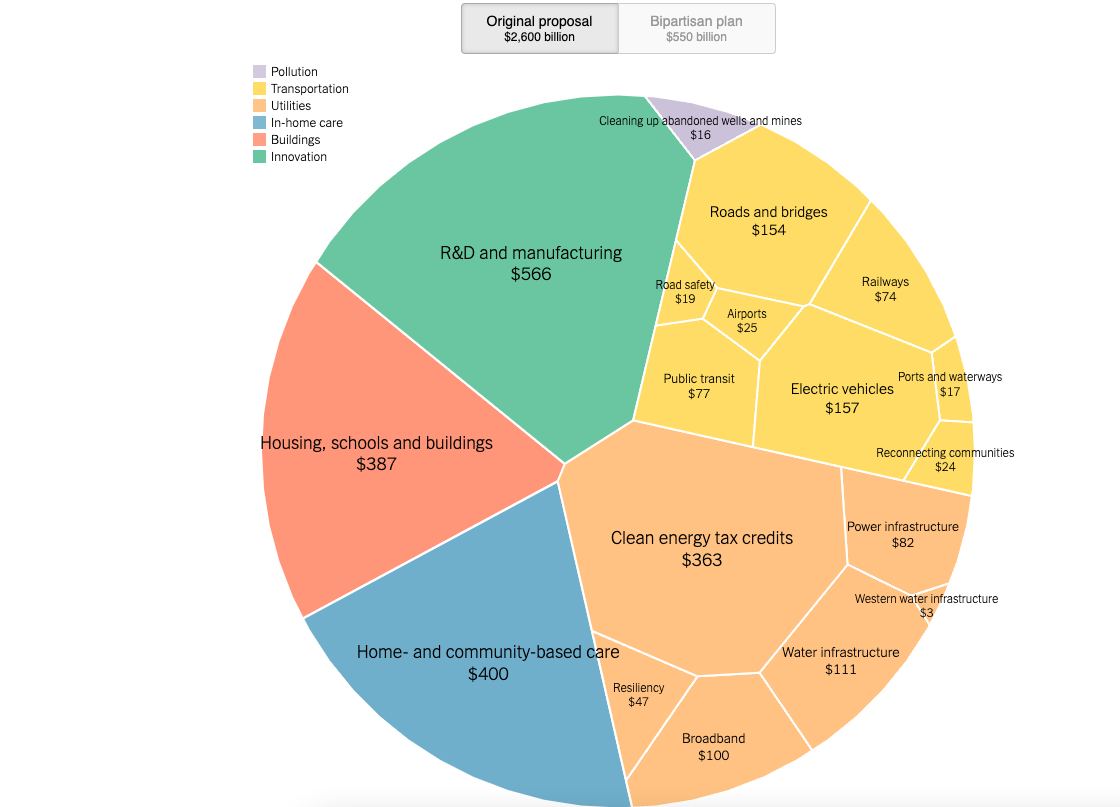
The Infrastructure Plan: What’s in and What’s Out
The New York Times
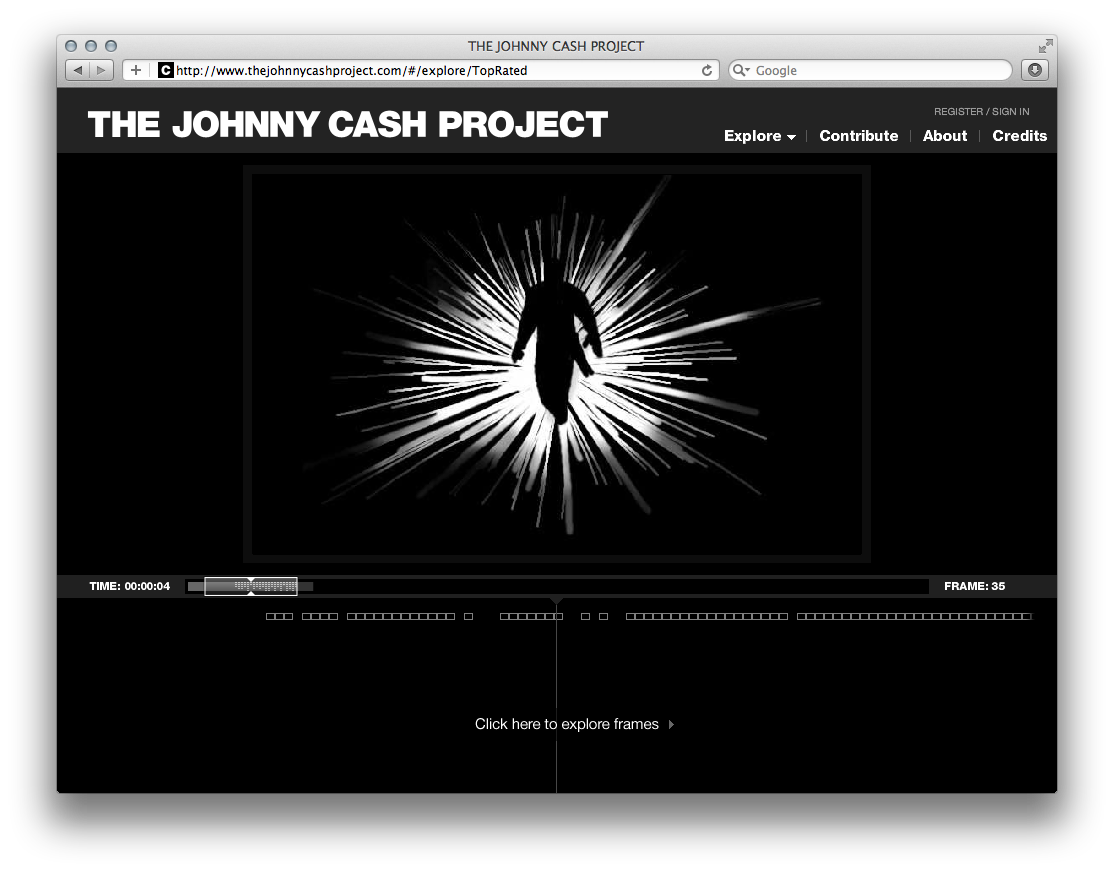
The Johnny Cash Project
Aaron Koblin
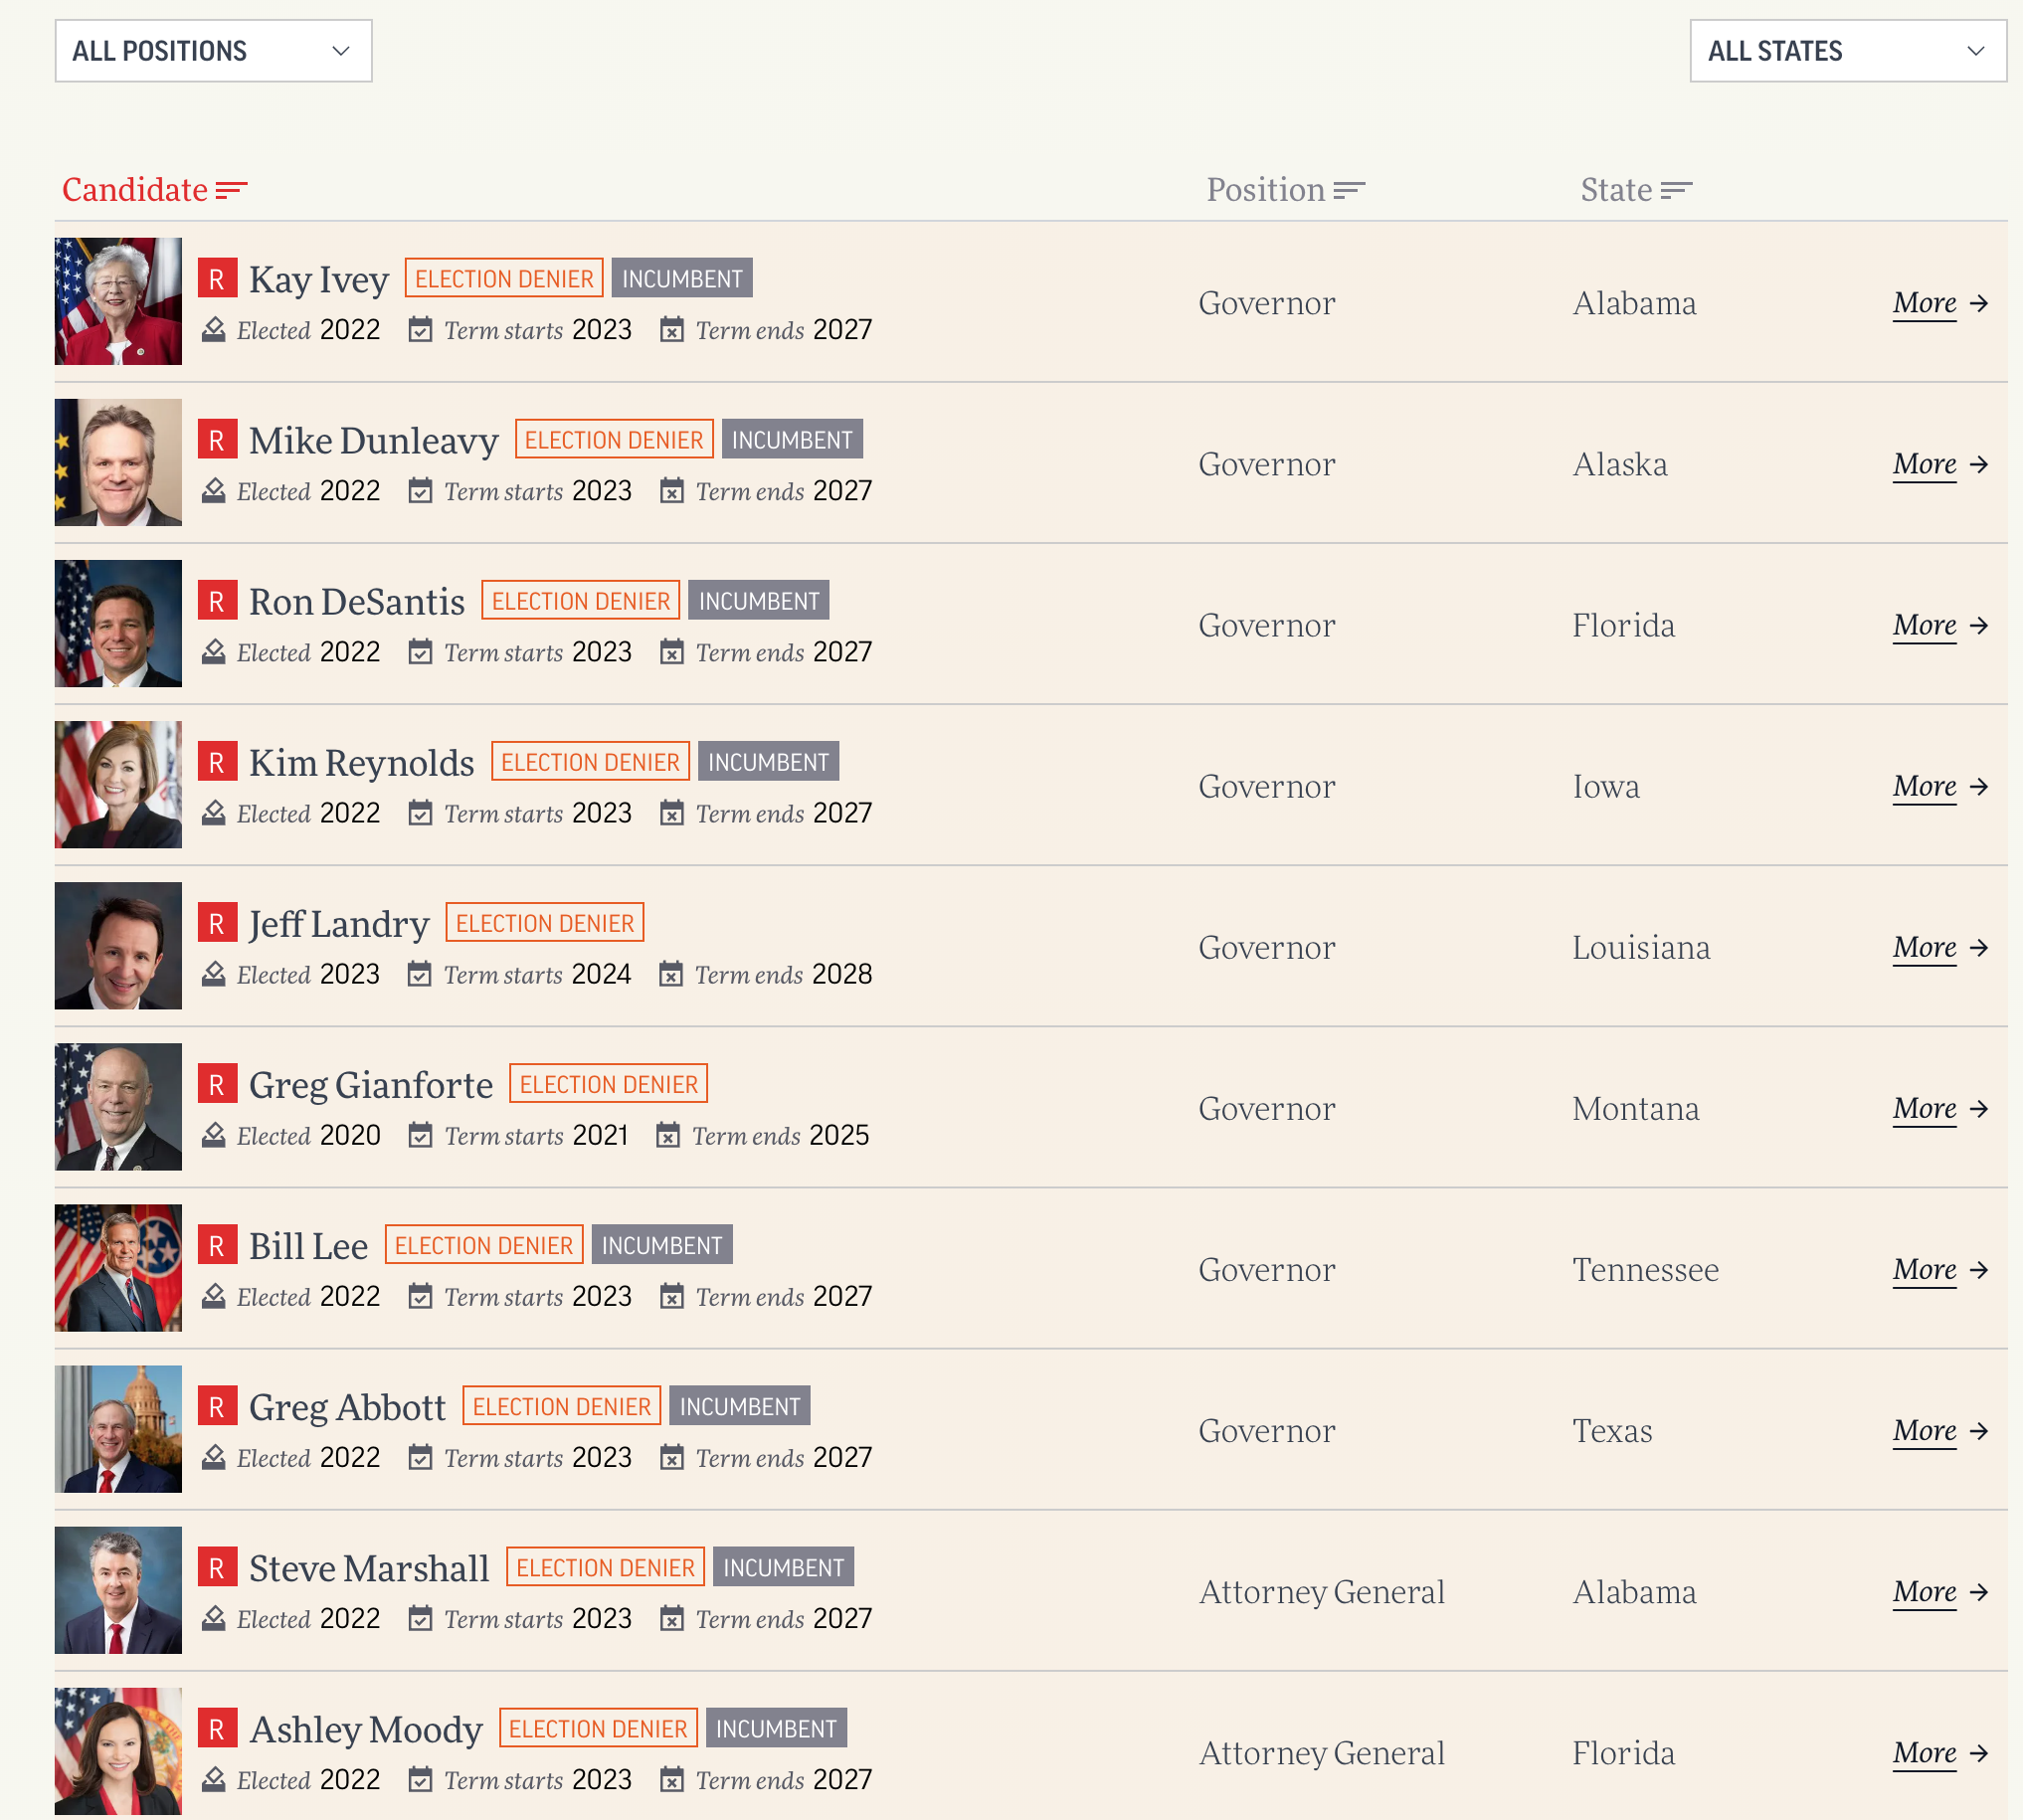
The Landscape of Election Denial in America
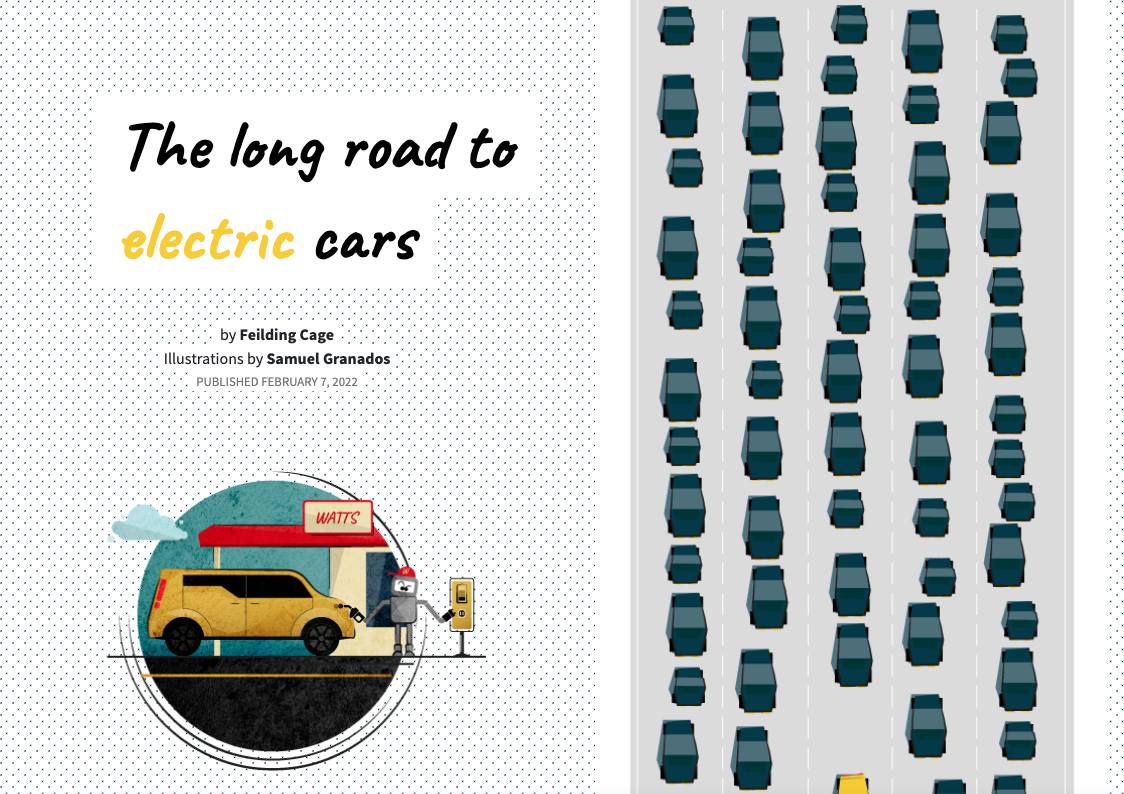
The Long Road to Electric Cars
Reuters
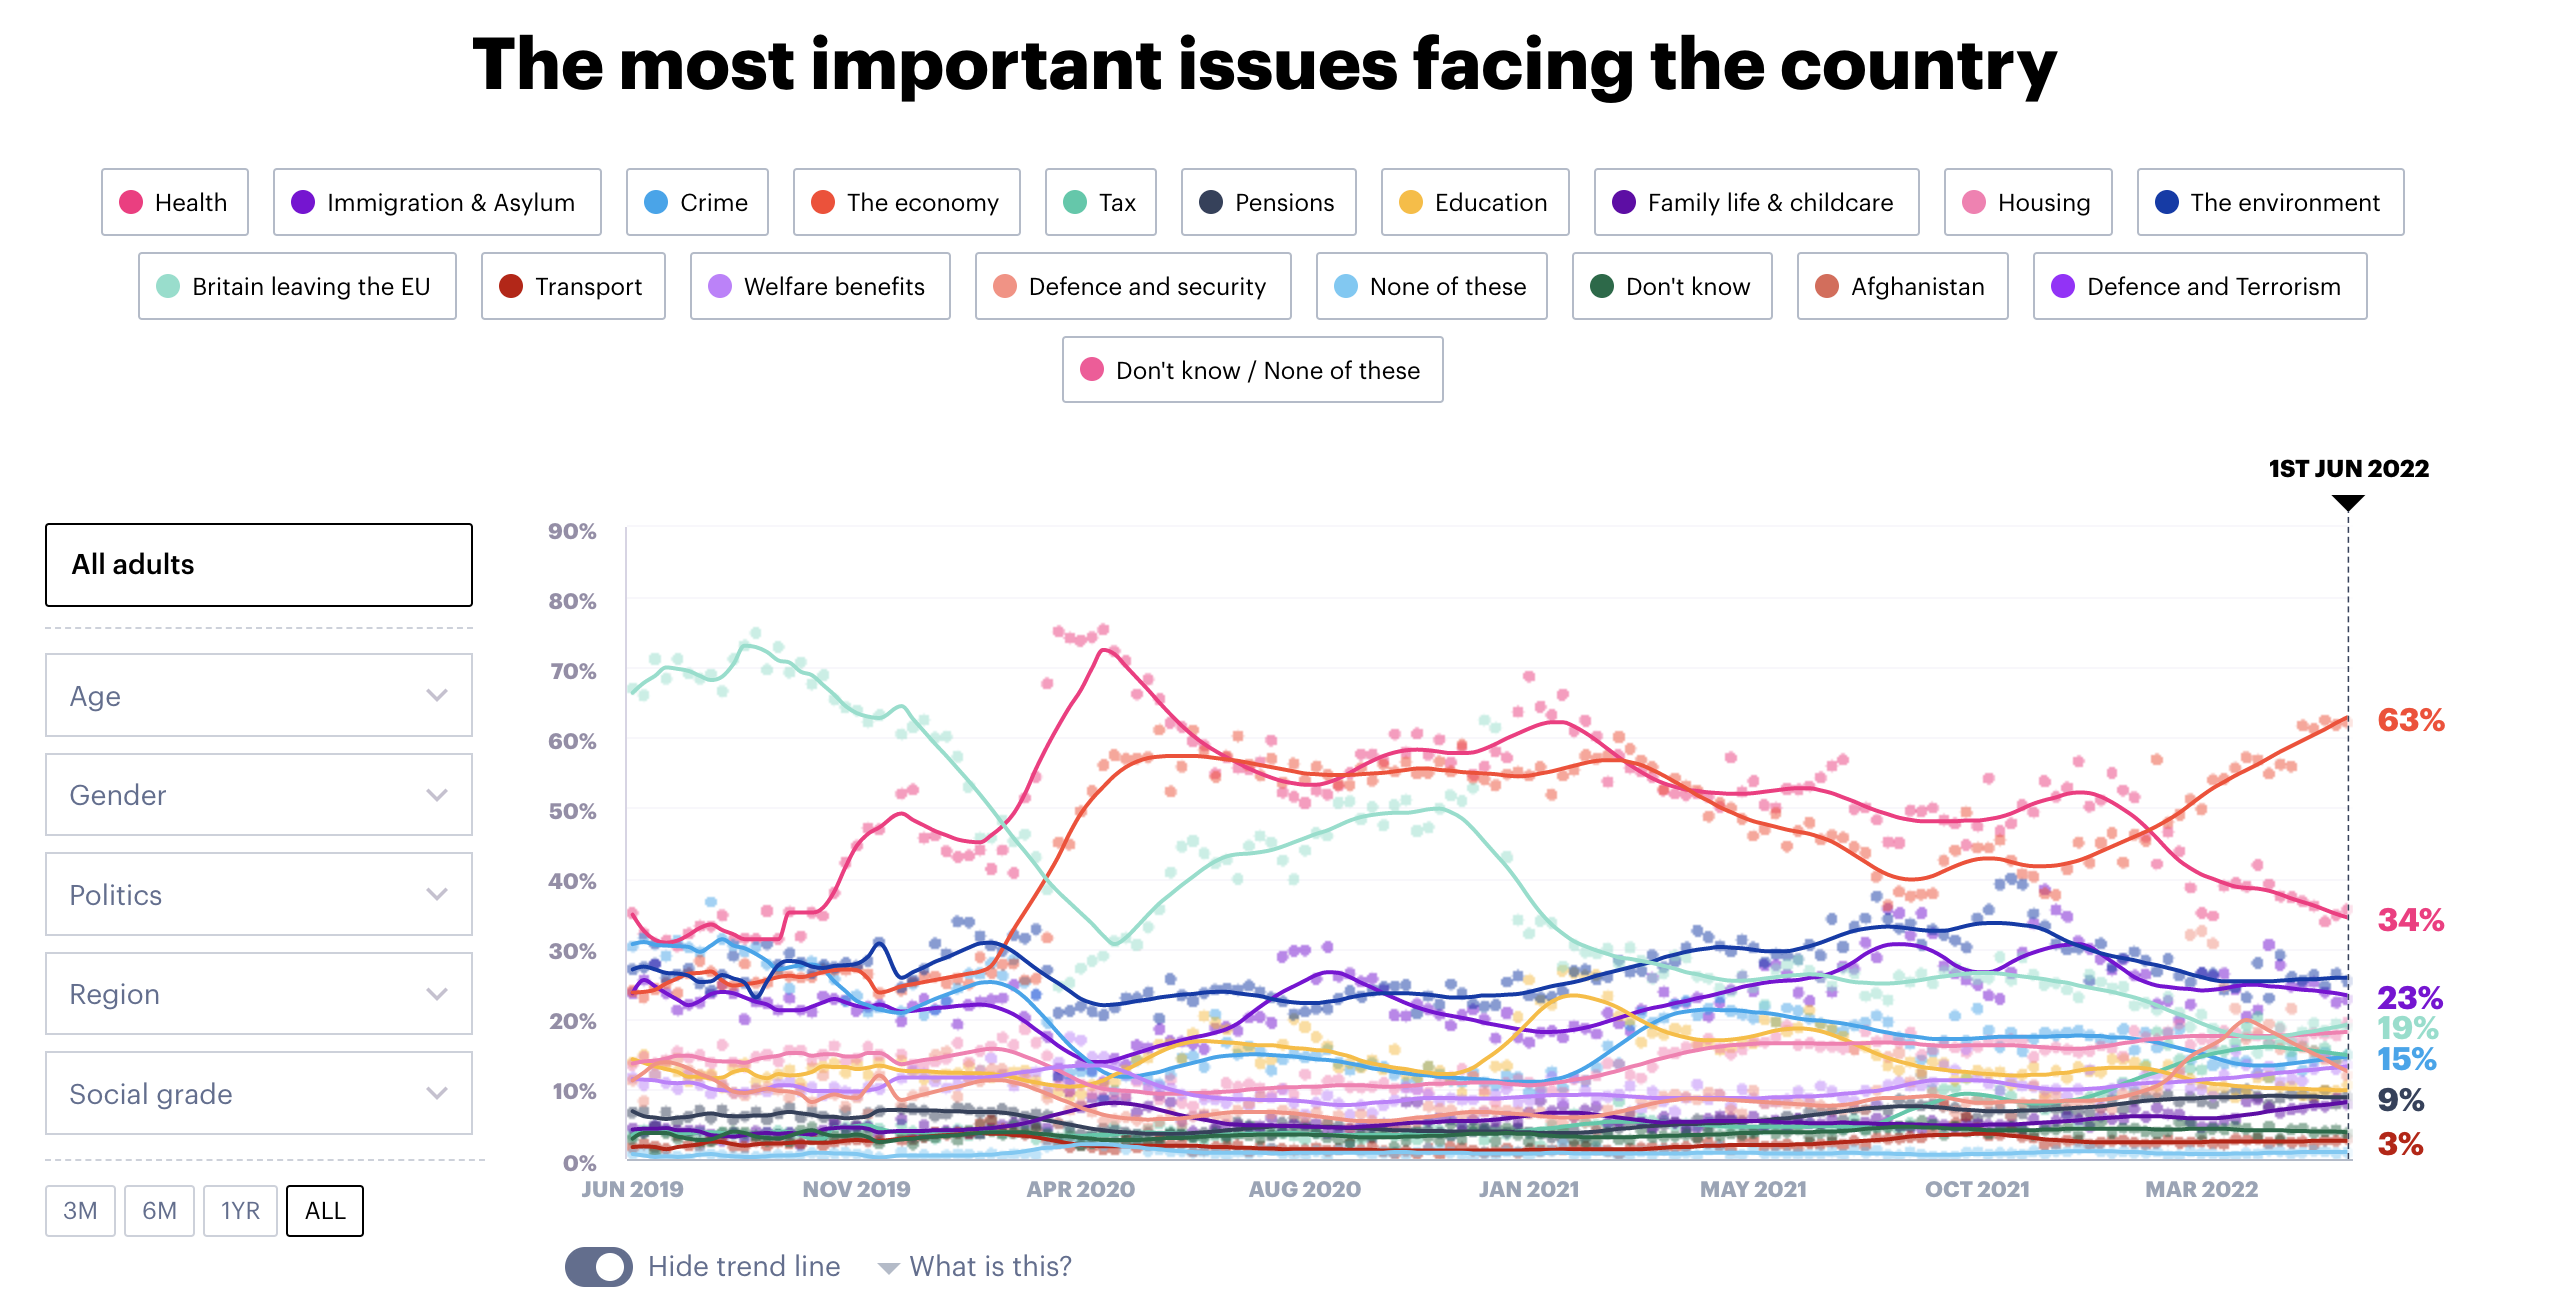
The Most Important Issues Facing the Country
The New Normal
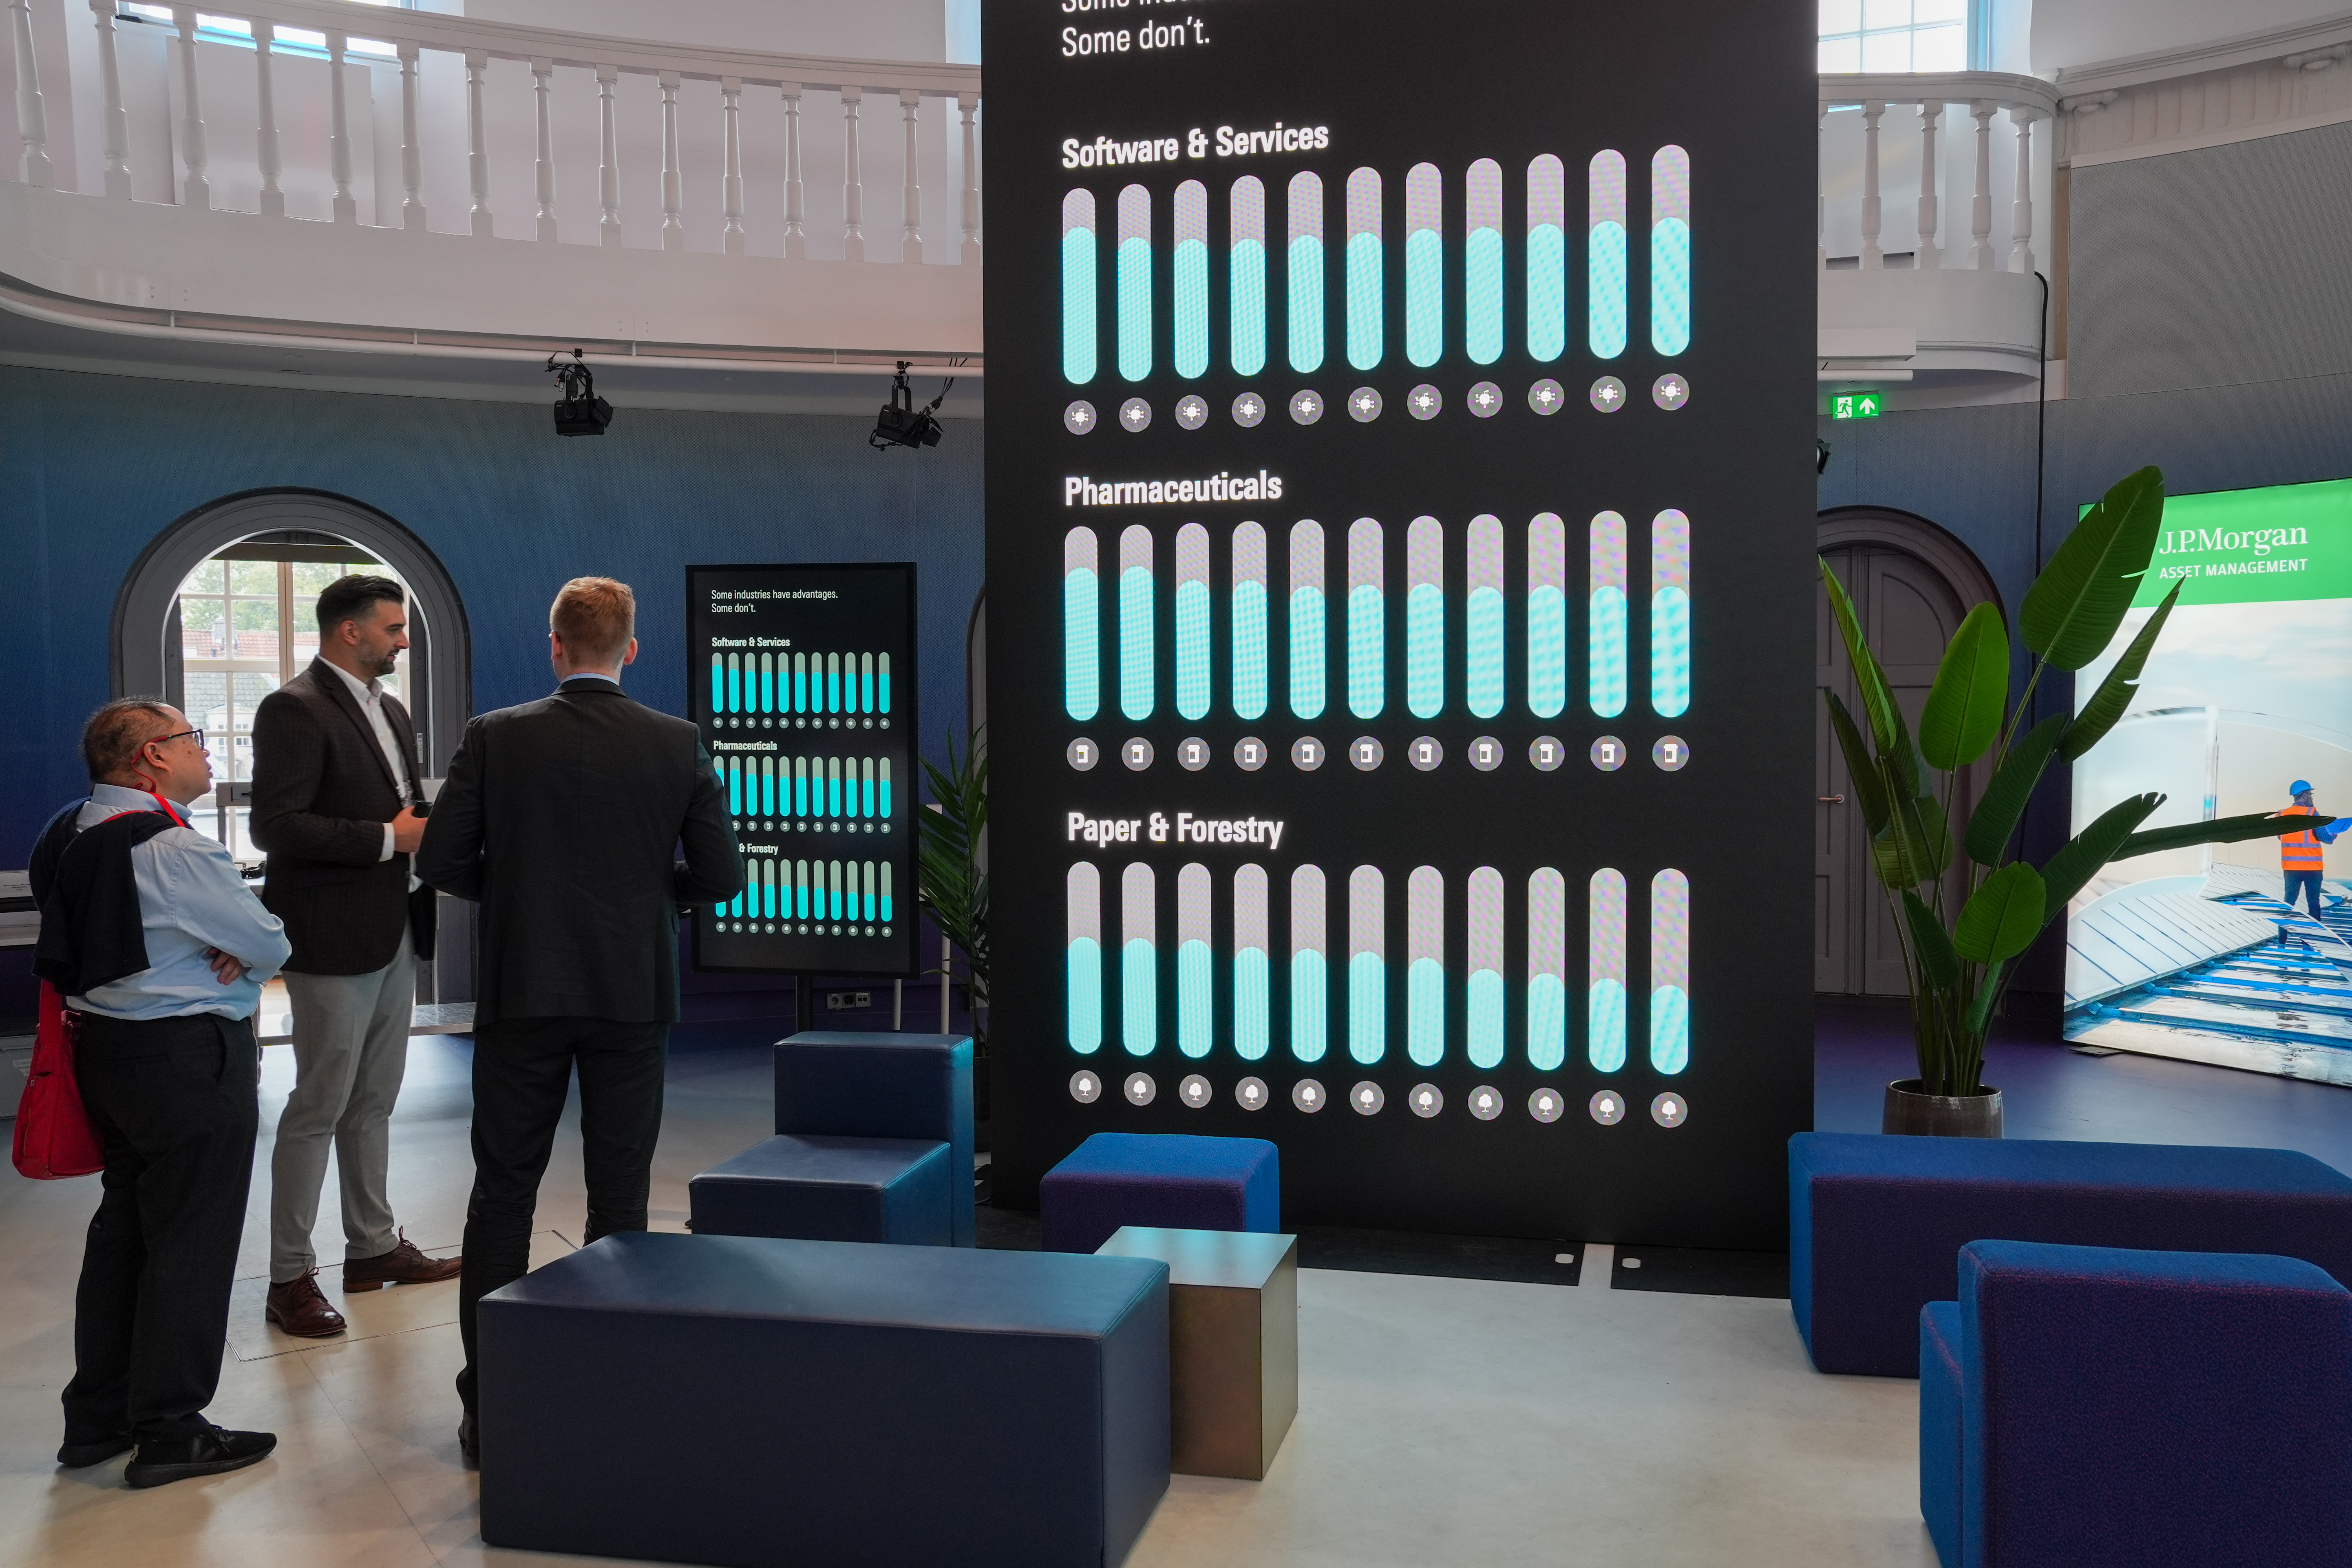
Schema Design
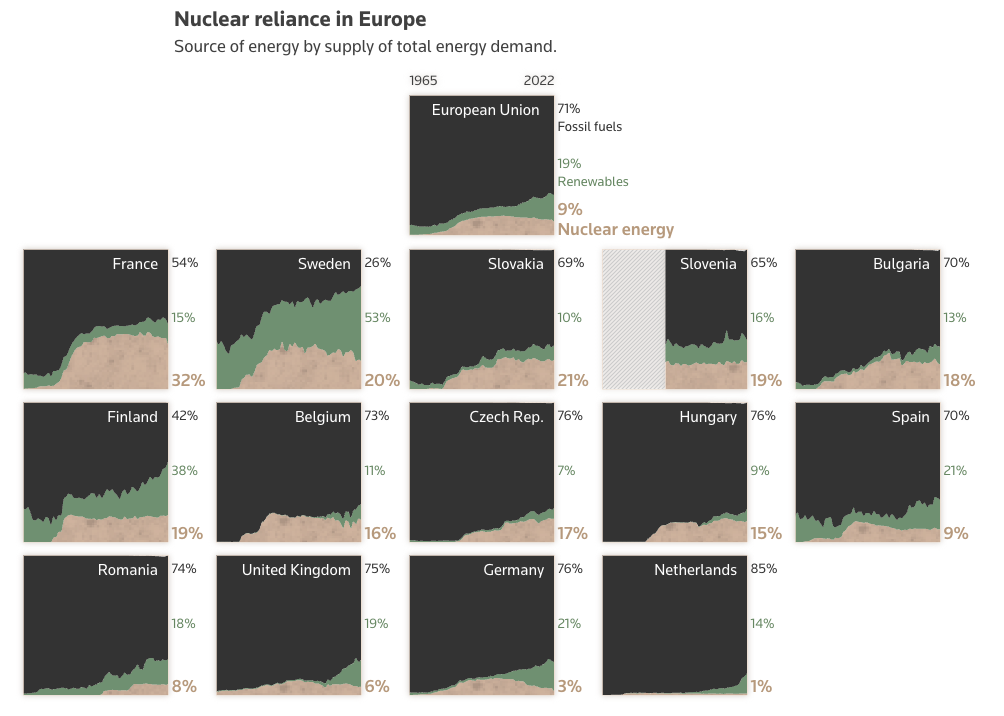
The Nuclear Aged
Reuters
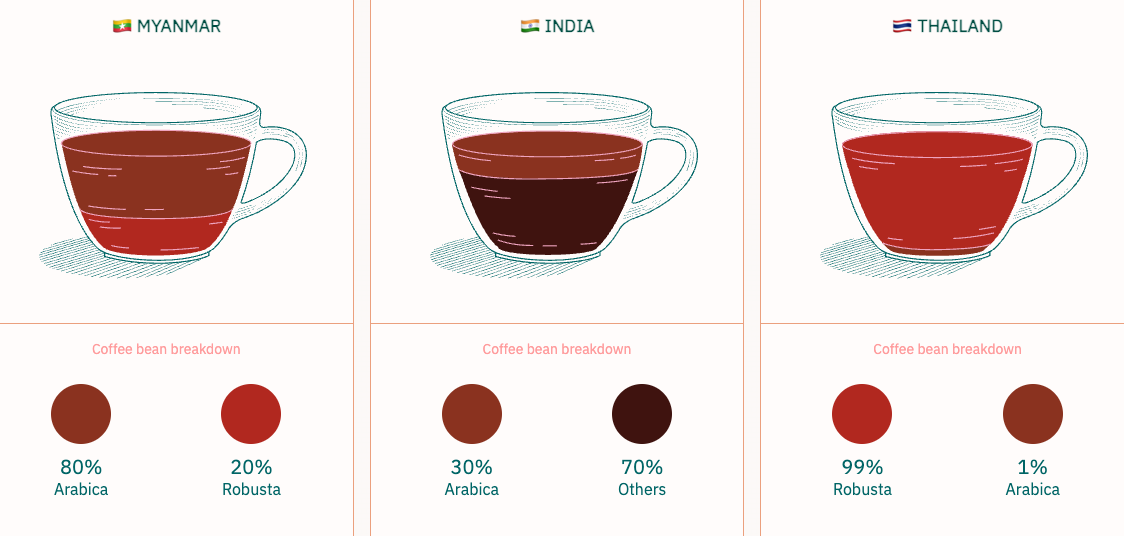
The Orgins of Coffee in Asia
Kontinentalist
The Perfect Storm
Reuters
The Problem with Plastics
The Rapid Spread of Measles
Reuters
The Refugee Project
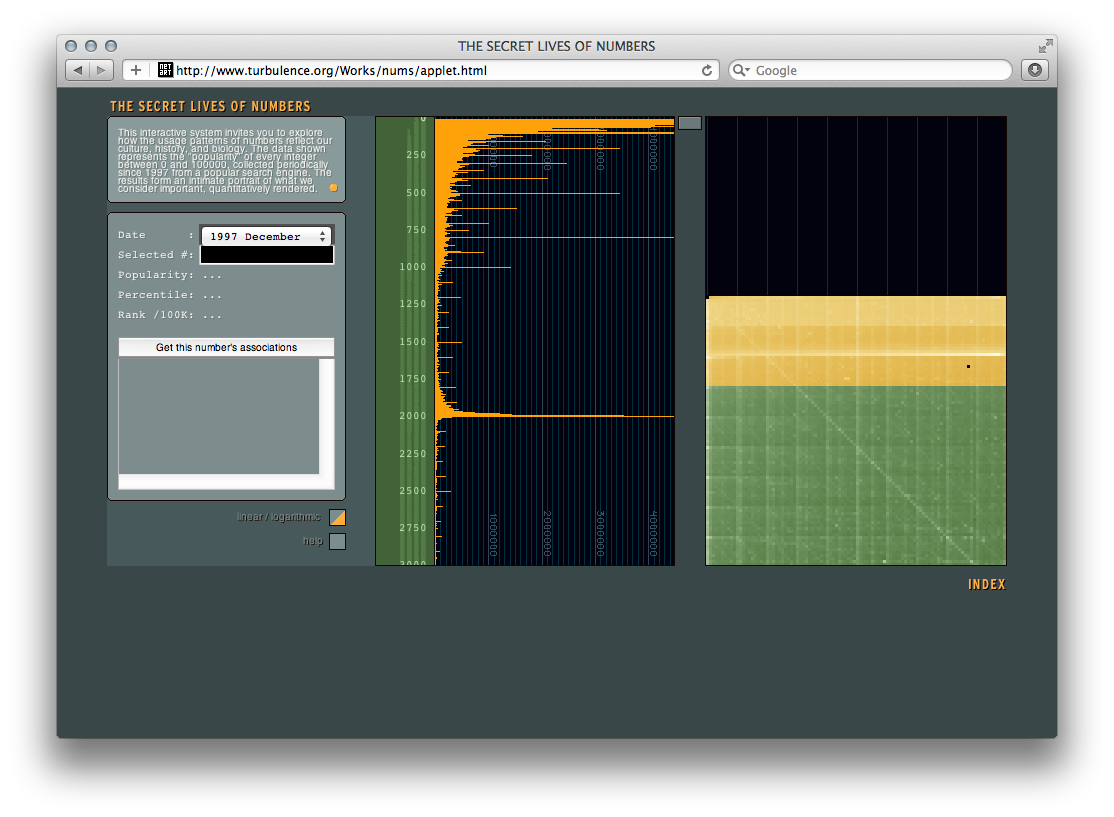
The Secret Lives of Numbers
Golan Levin
The Shape of Dreams, Federica Fragapane
The Shape of Song
Martin Wattenberg
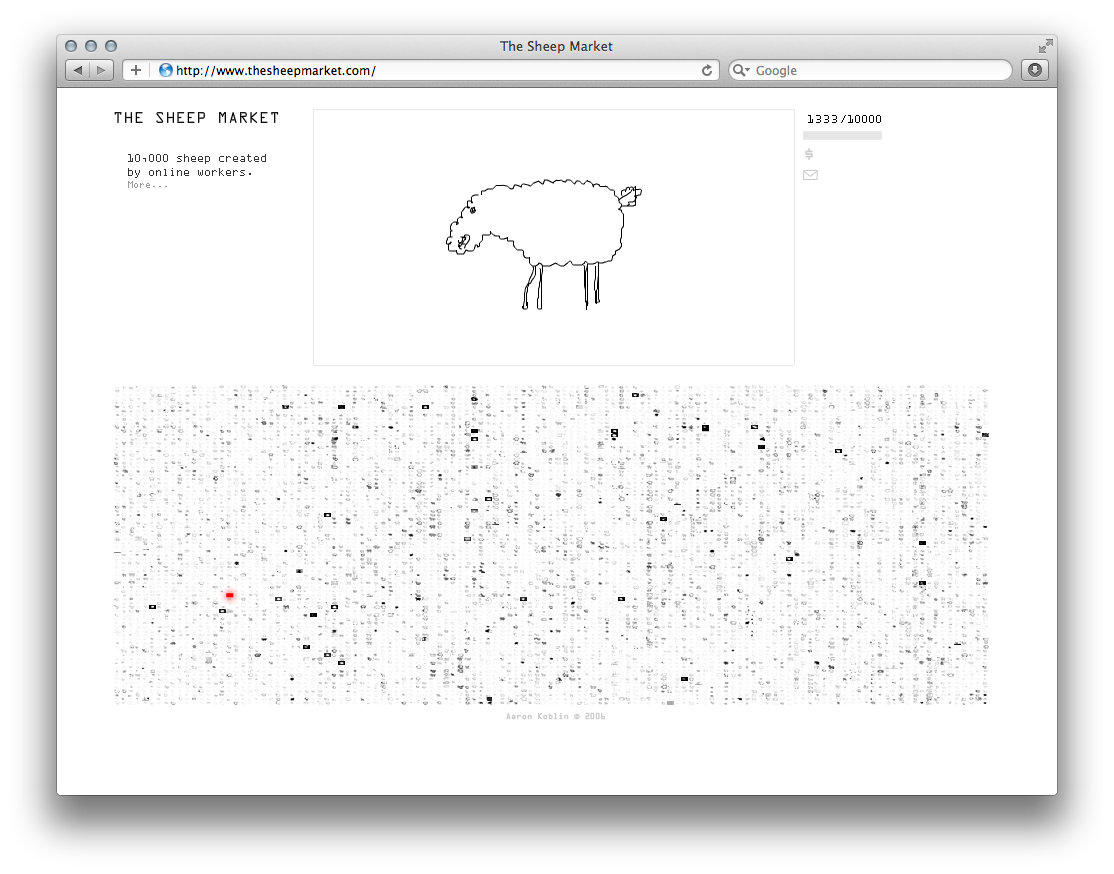
The Sheep Market
Aaron Koblin
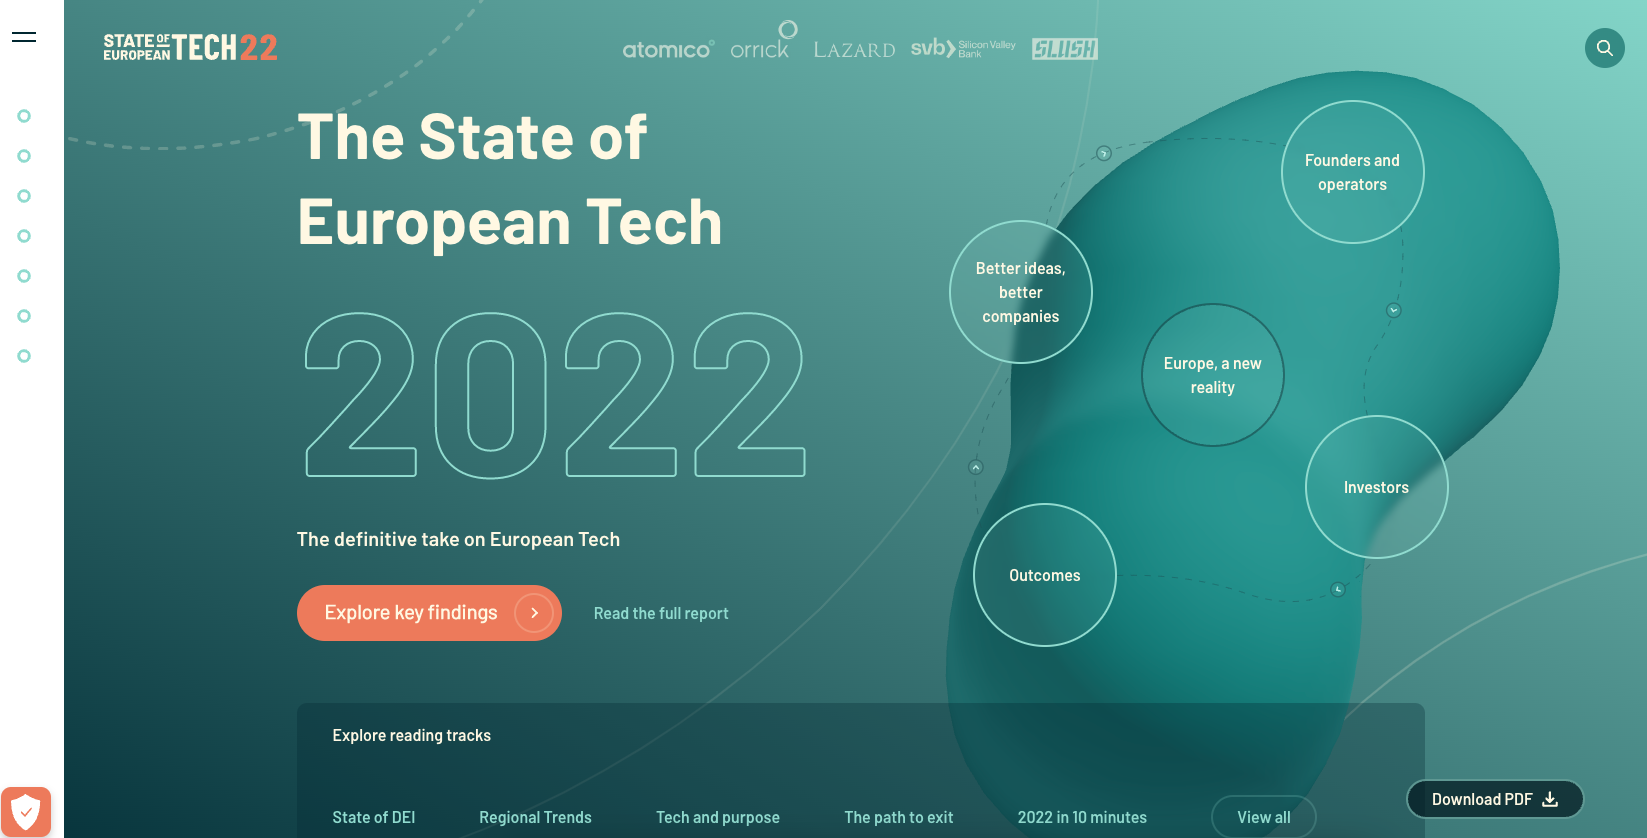
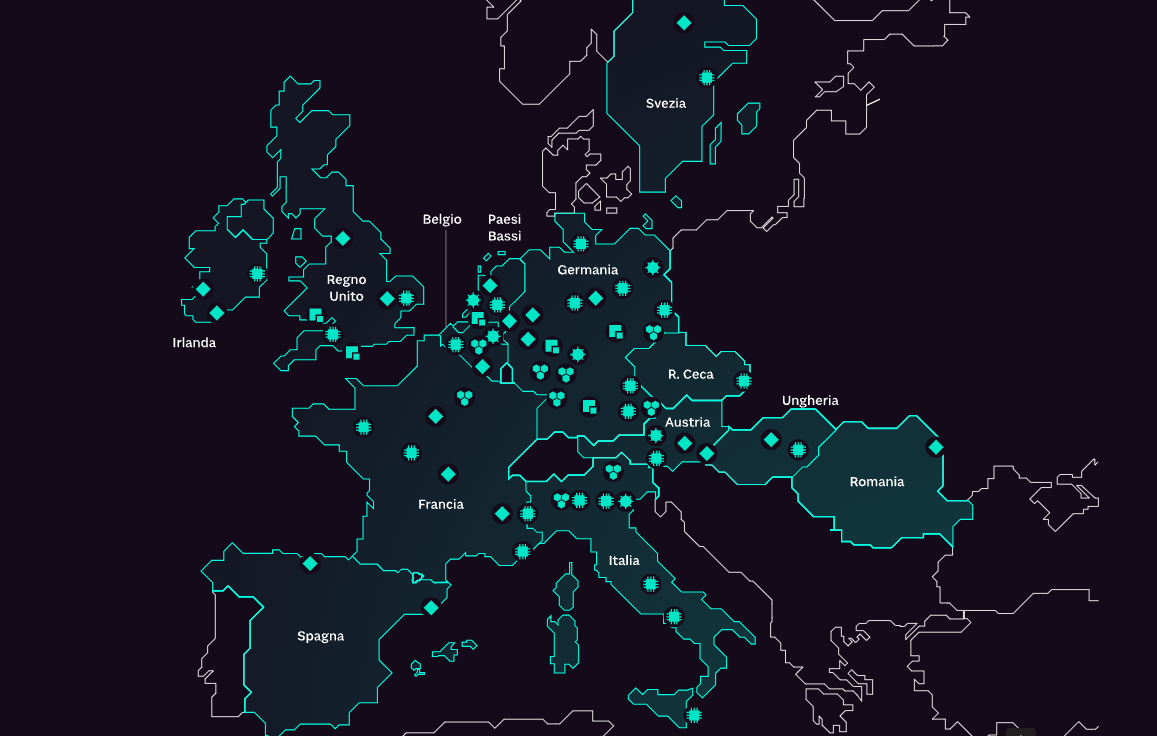
The State of European Tech, 2022
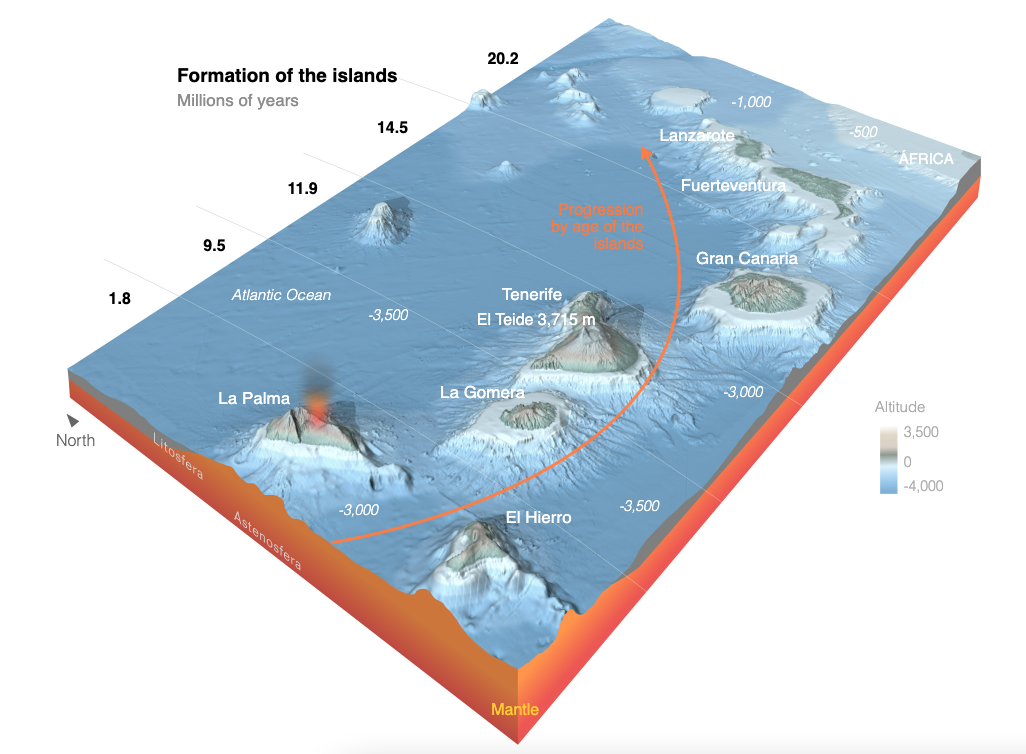
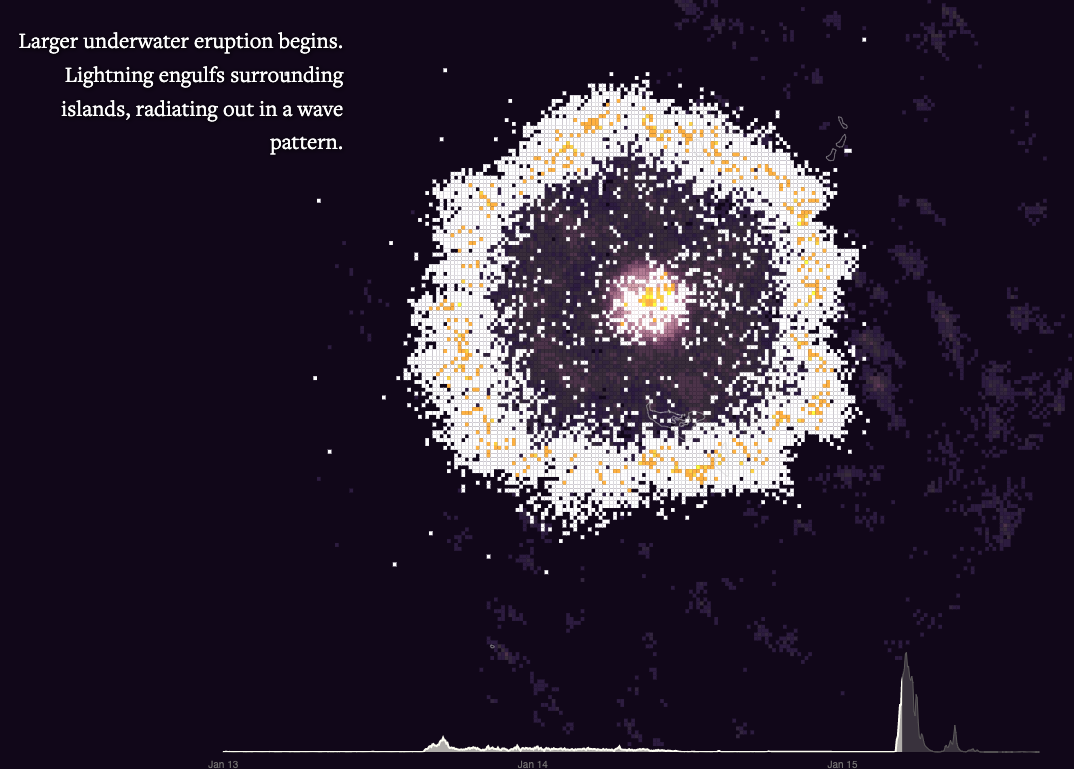
The Underwater ‘Hotspot’ Feeding LA Palma’s Volcano Will Create New Islands
The US-China FDI Project
Schema Design
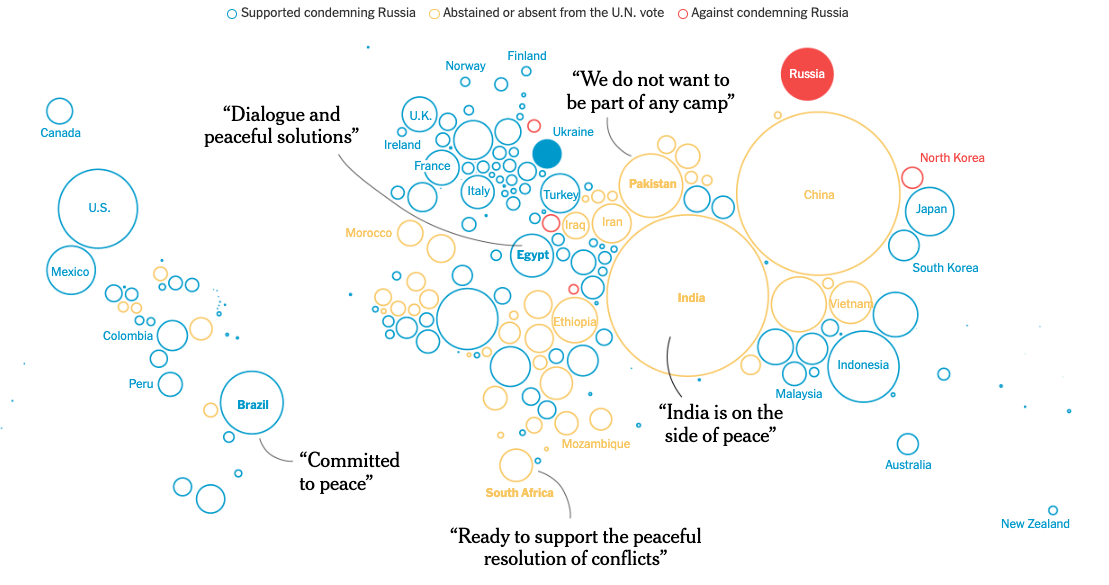
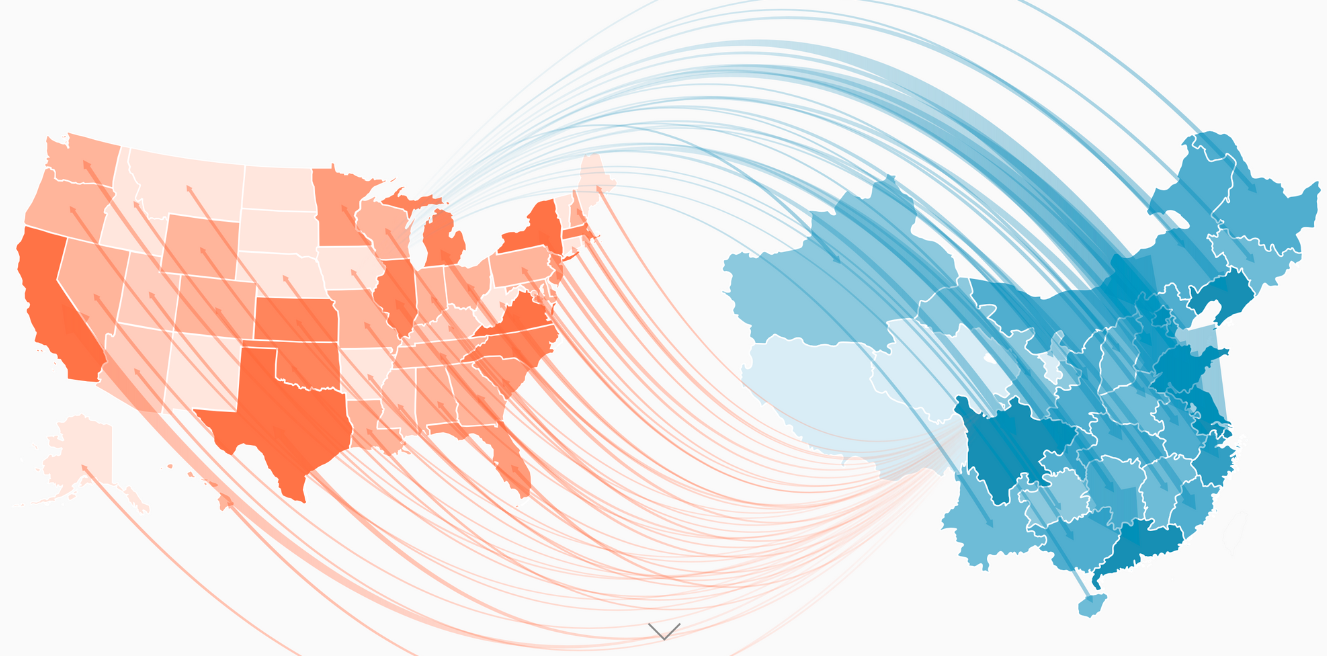
The West Tried to Isolate Russia. It Didn't Work
The New York Times
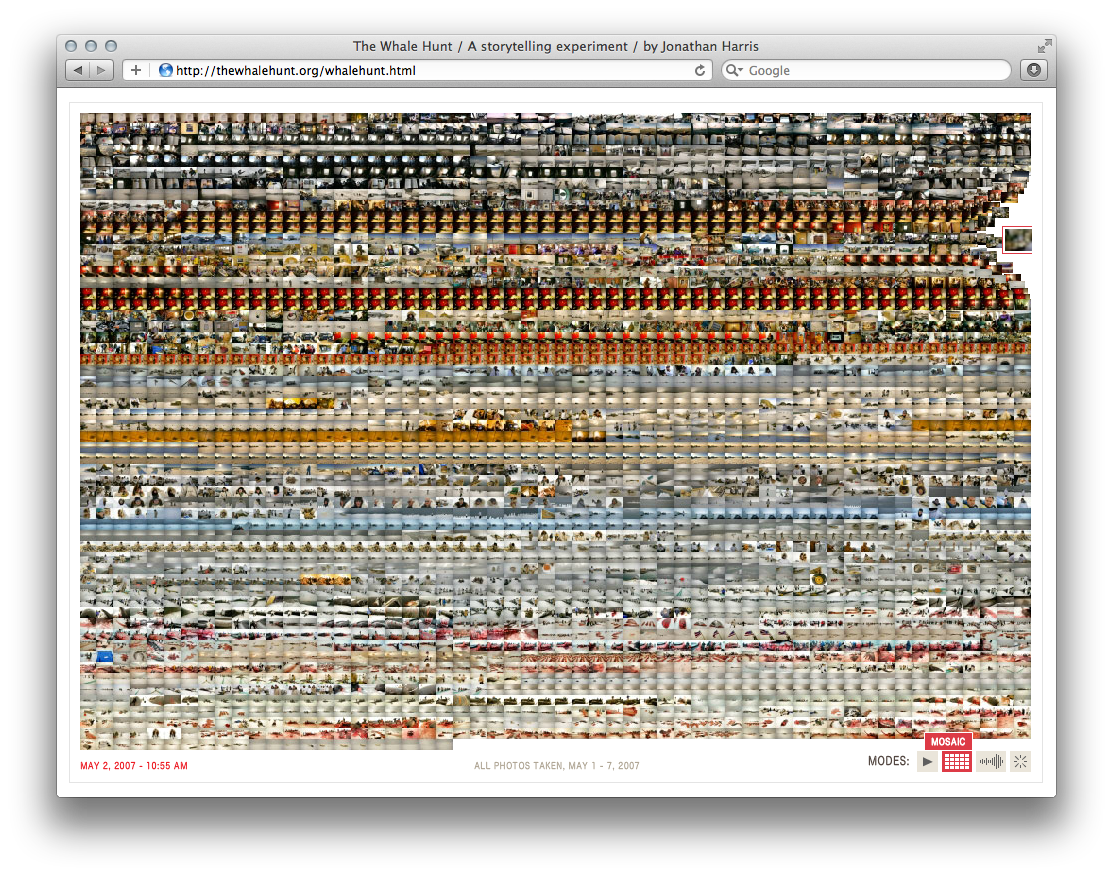
The Whale Hunt
Jonathan Harris
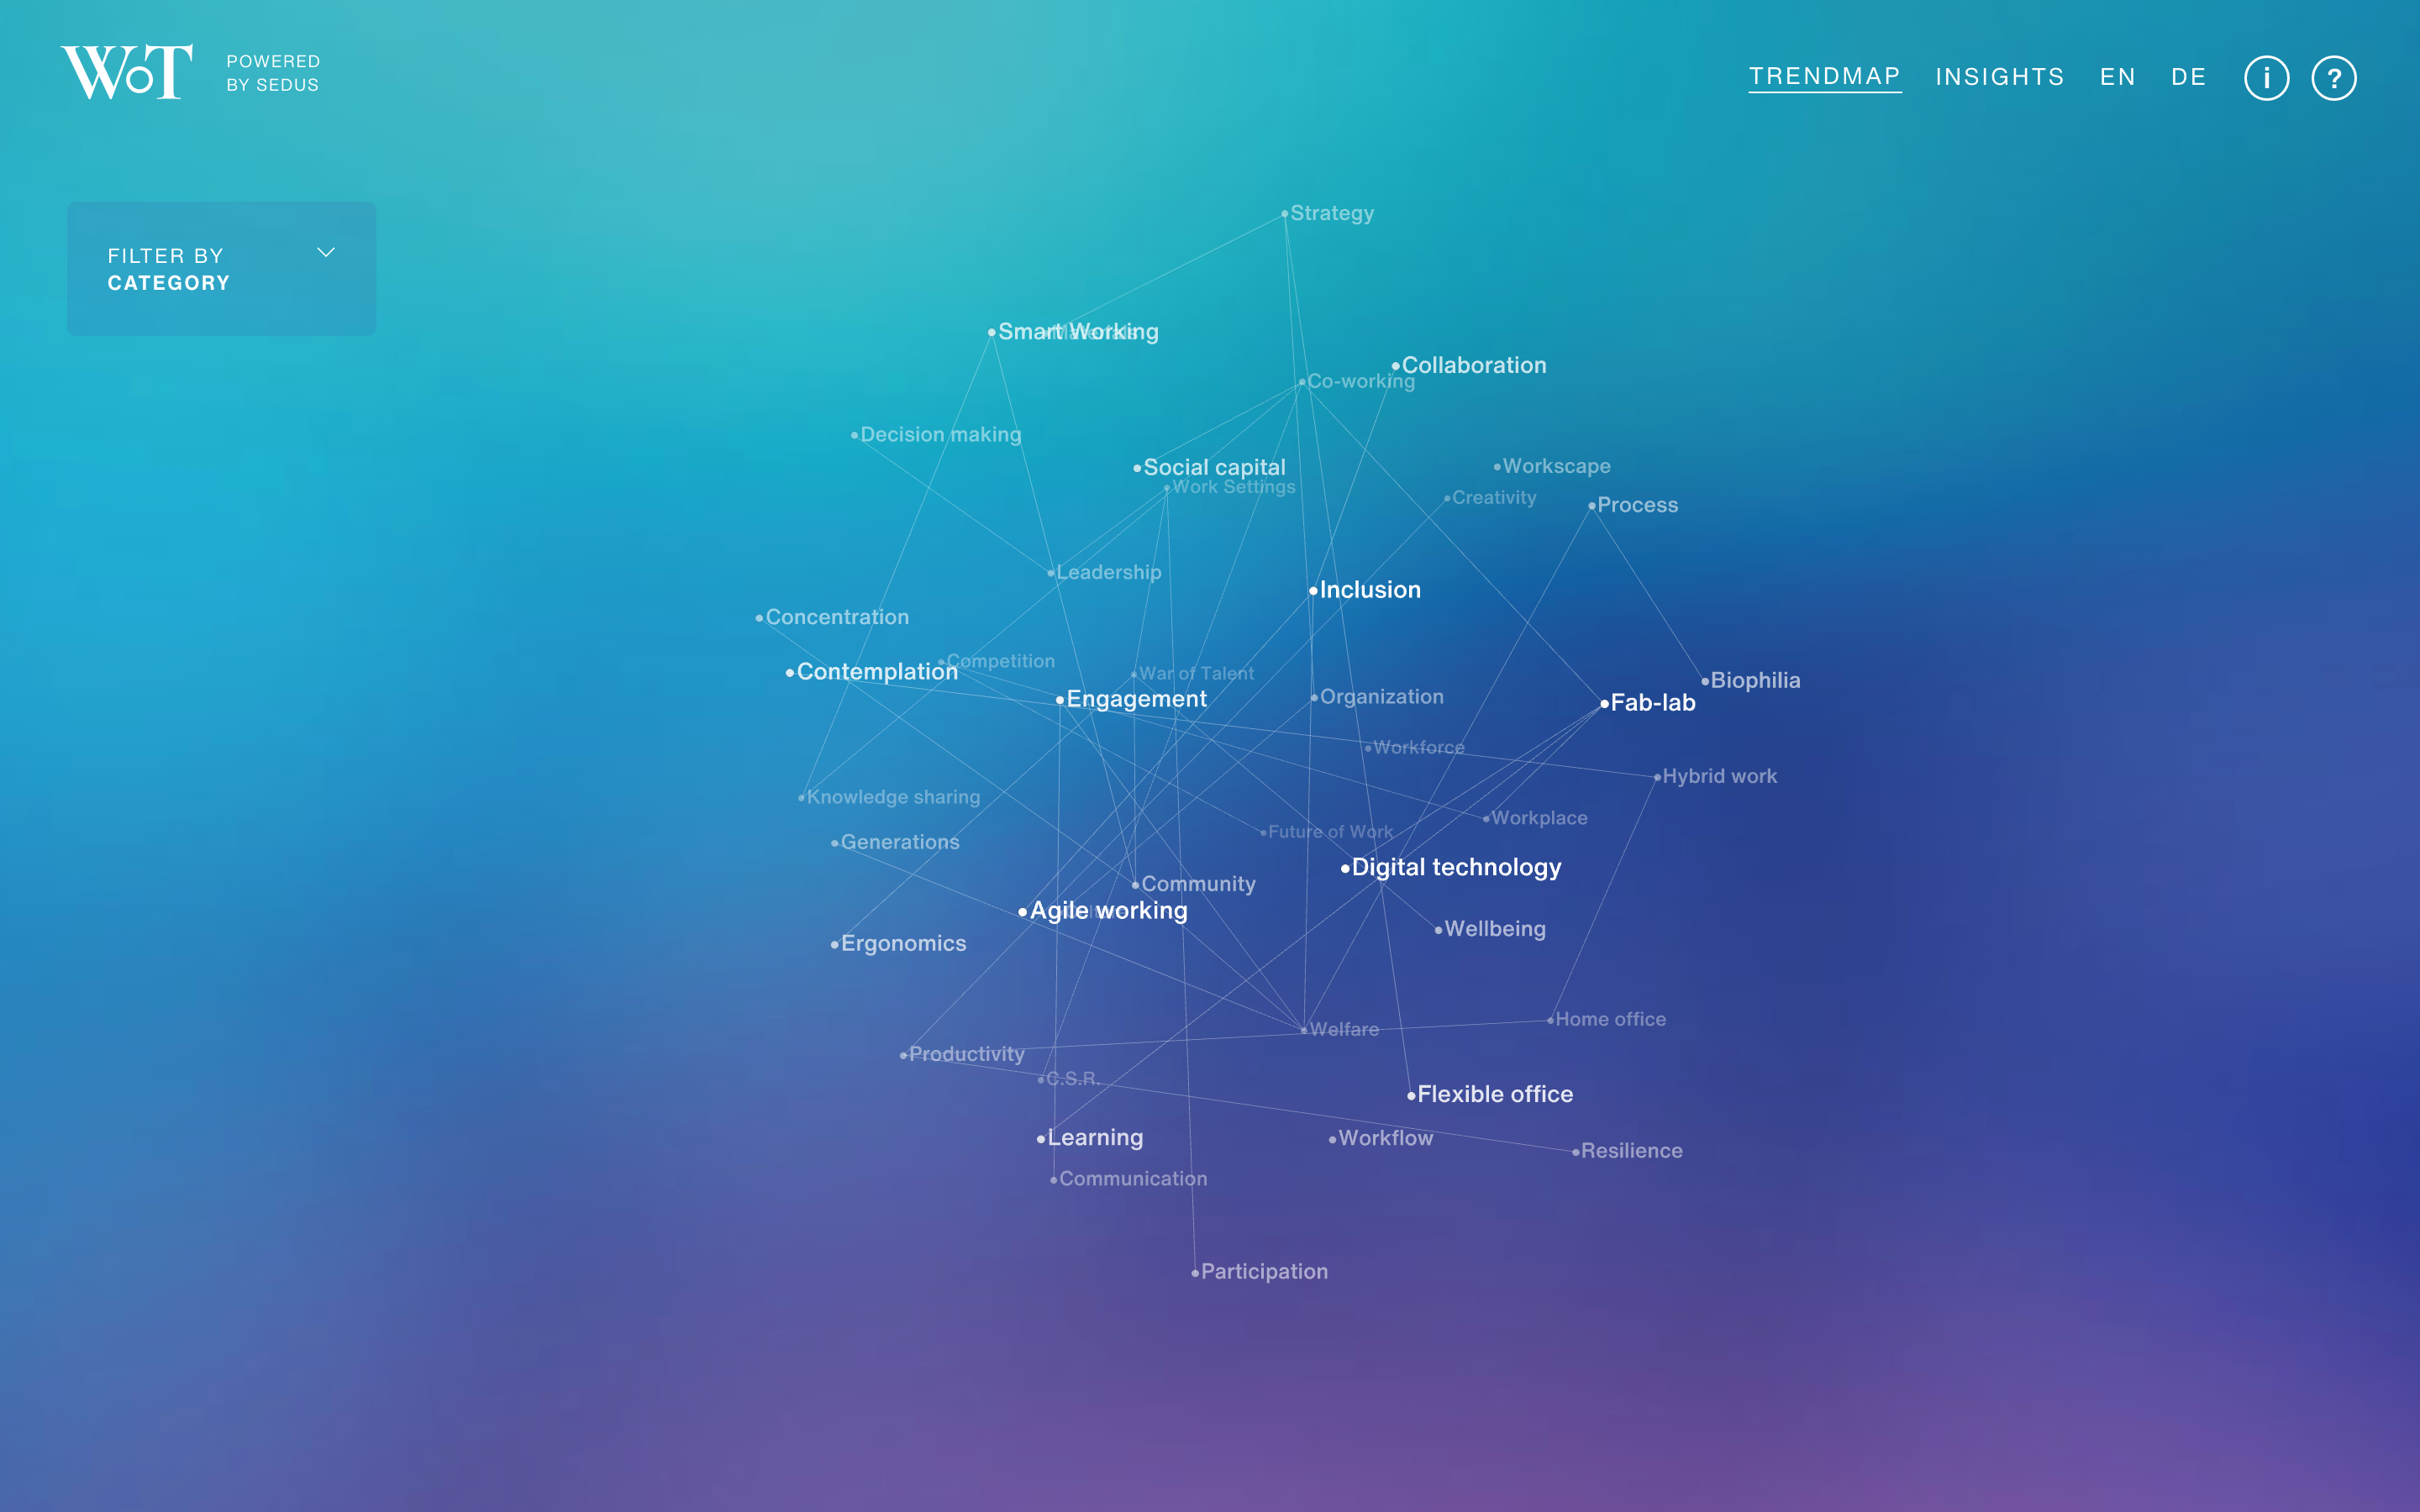
The Workscape of Tomorrow
Schema Design
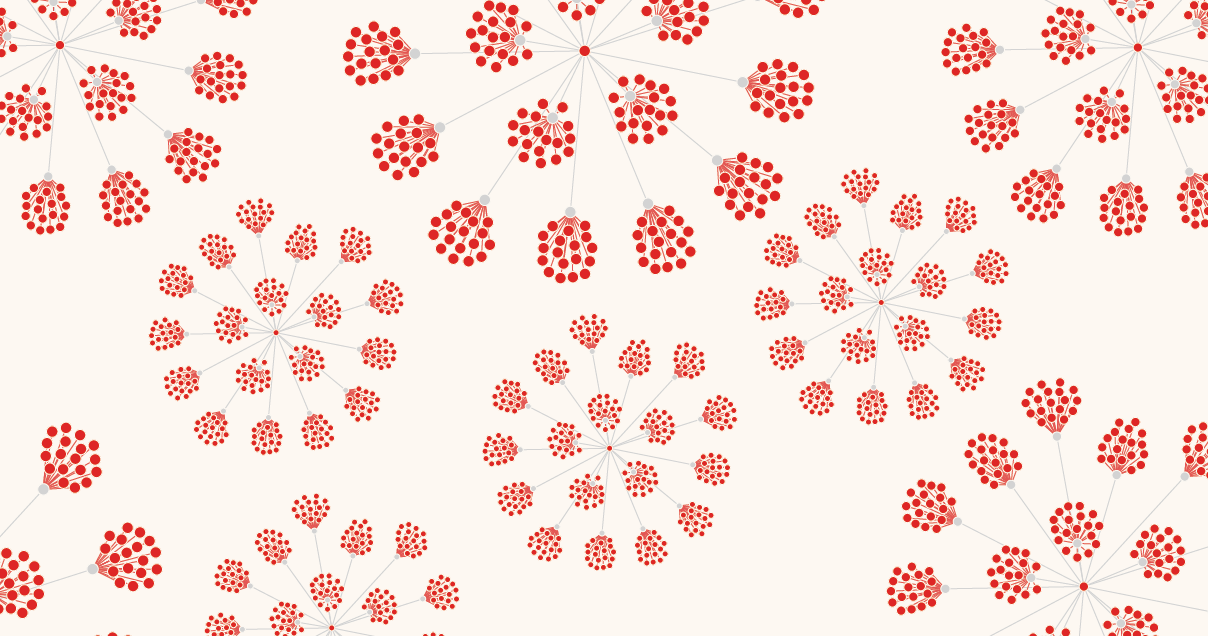
They Rule
Josh On
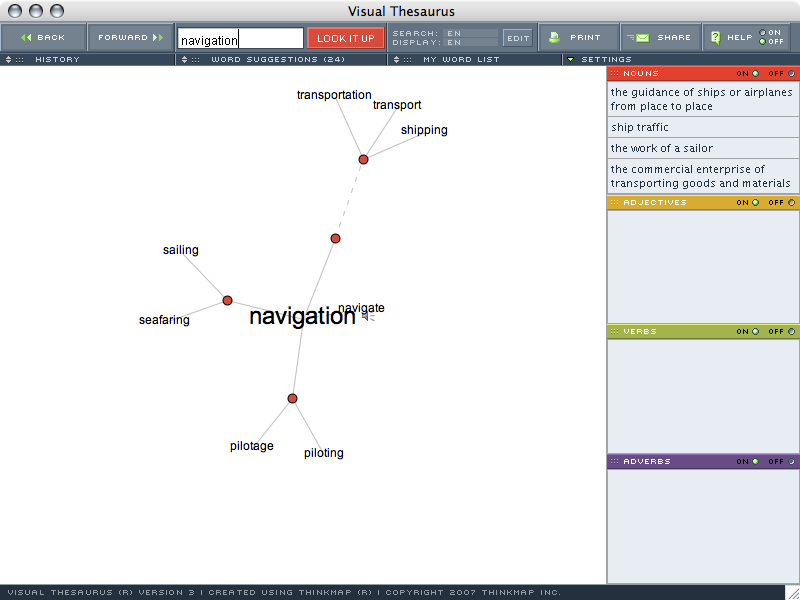
Think Map Visual Thesaurus
Thinkmap
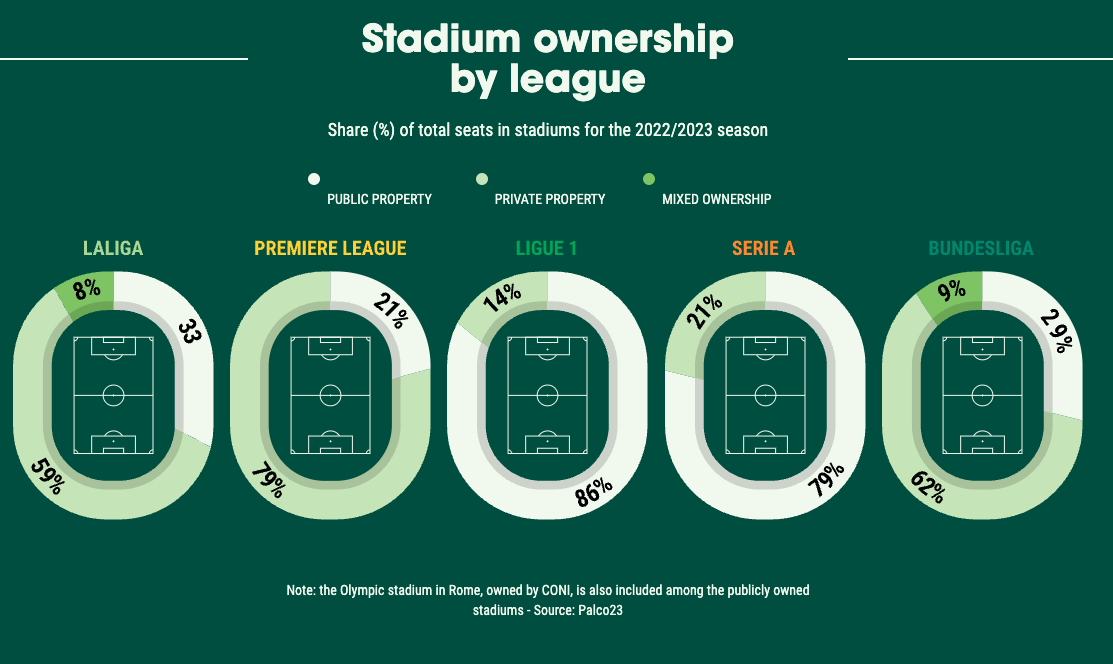
Thus the Saudi Takeover Bid for Football is Triggered
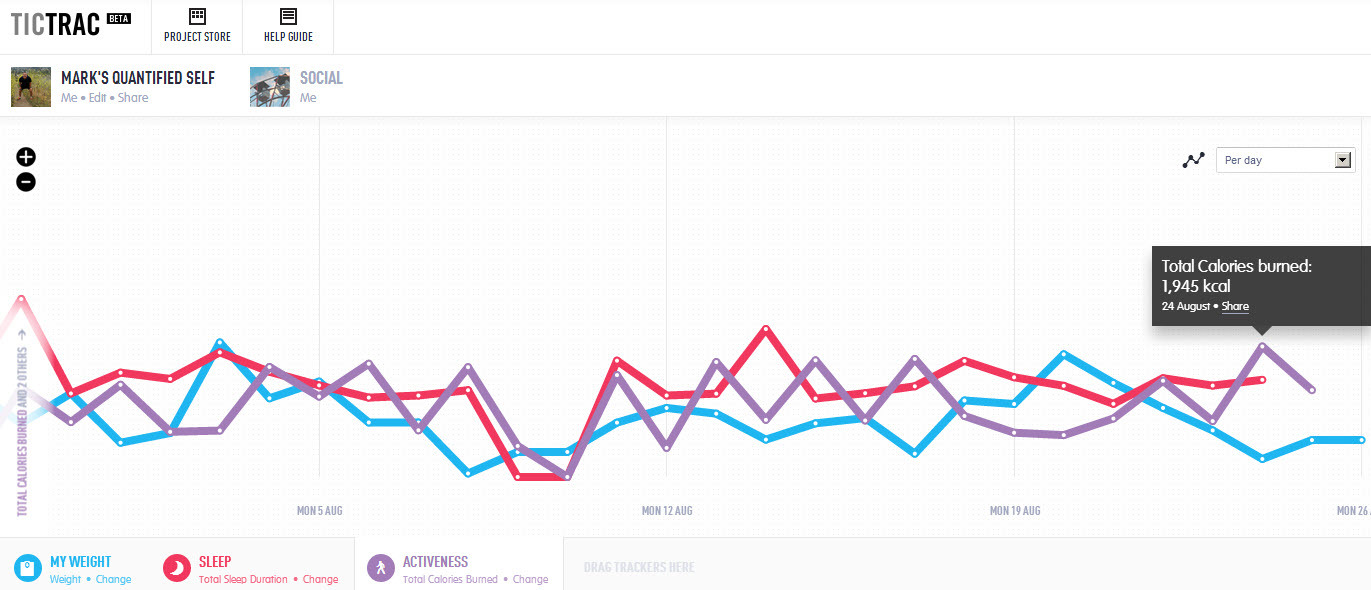
TicTrac
Mark Krynsky
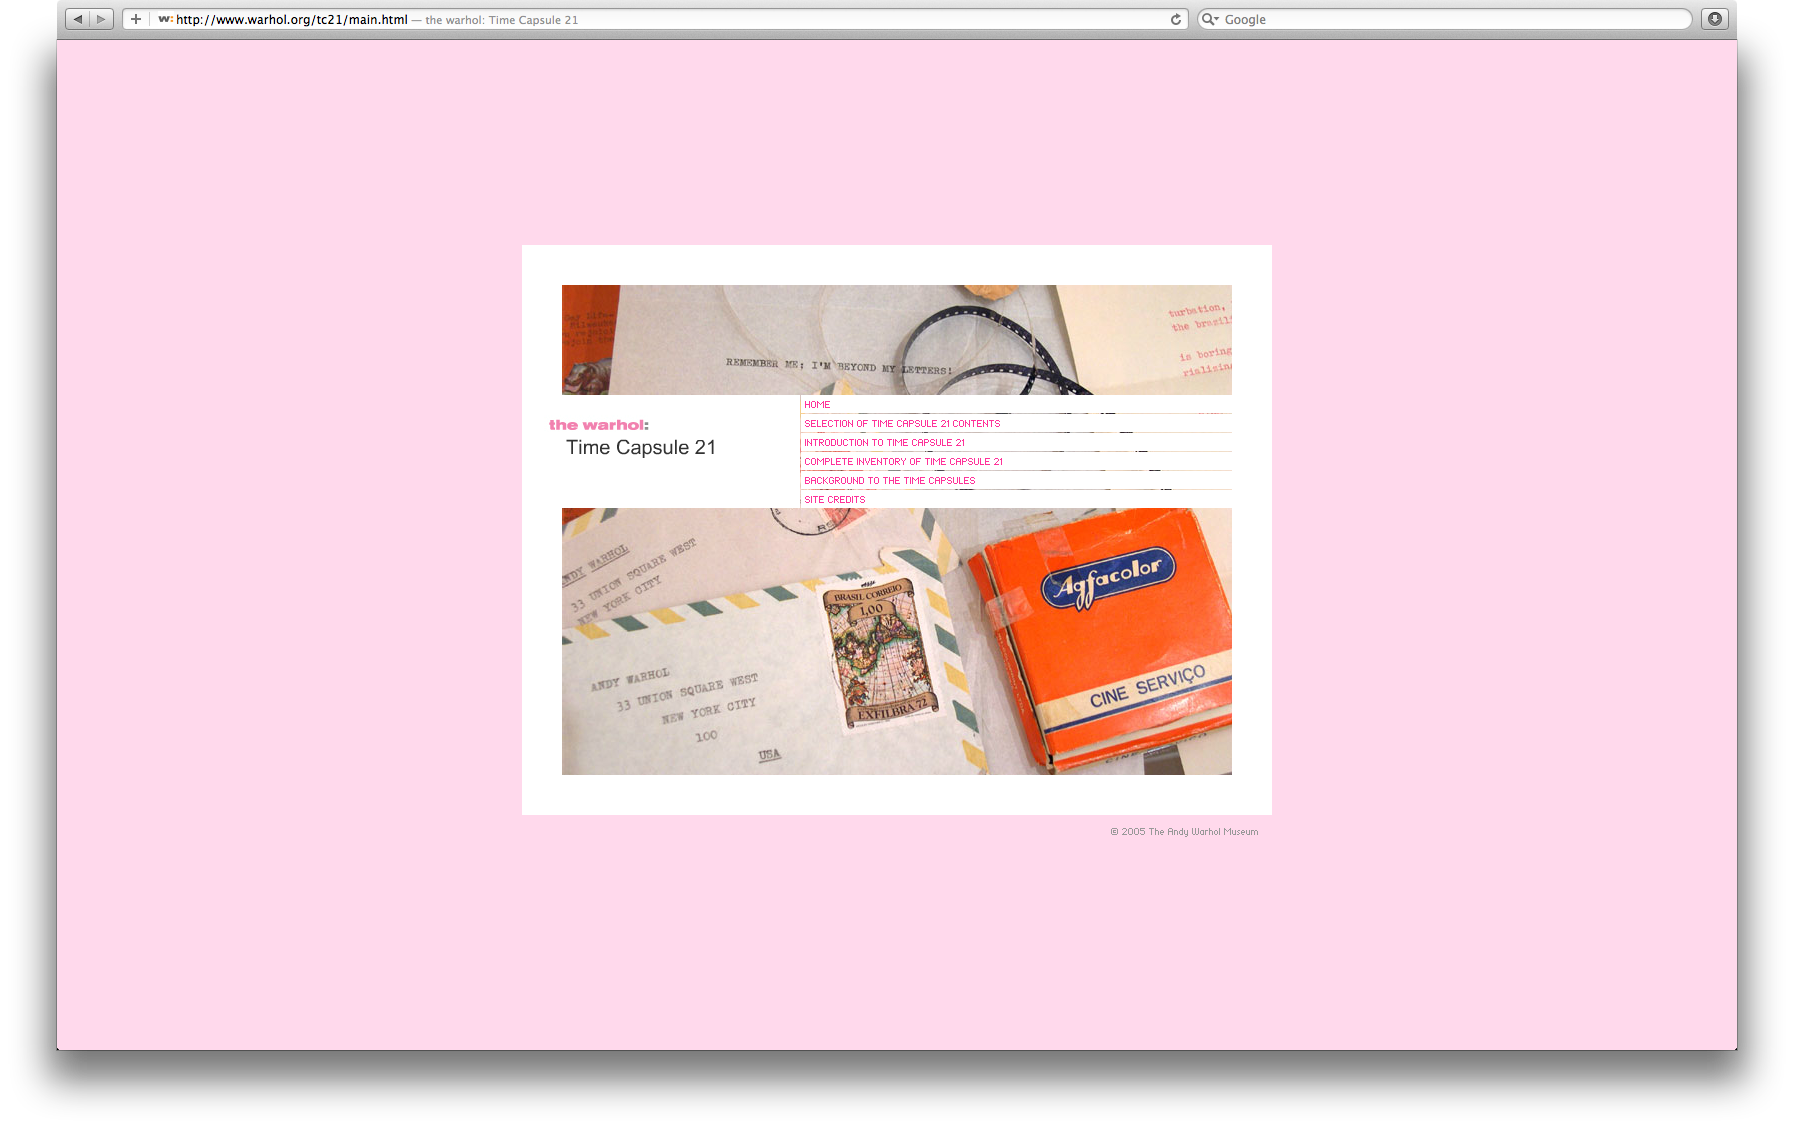
Time Capsules
Andy Warhol
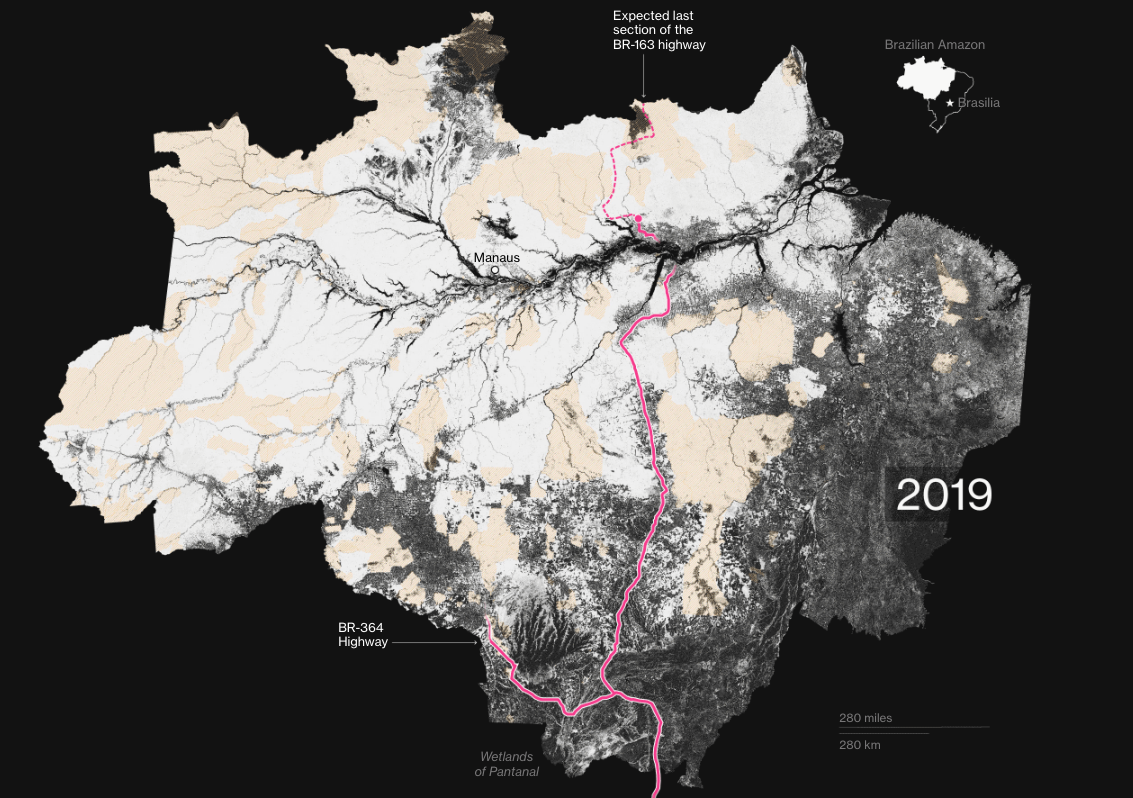
Time is Running Out to Save the Last of the World’s Rainforest
Bloomberg
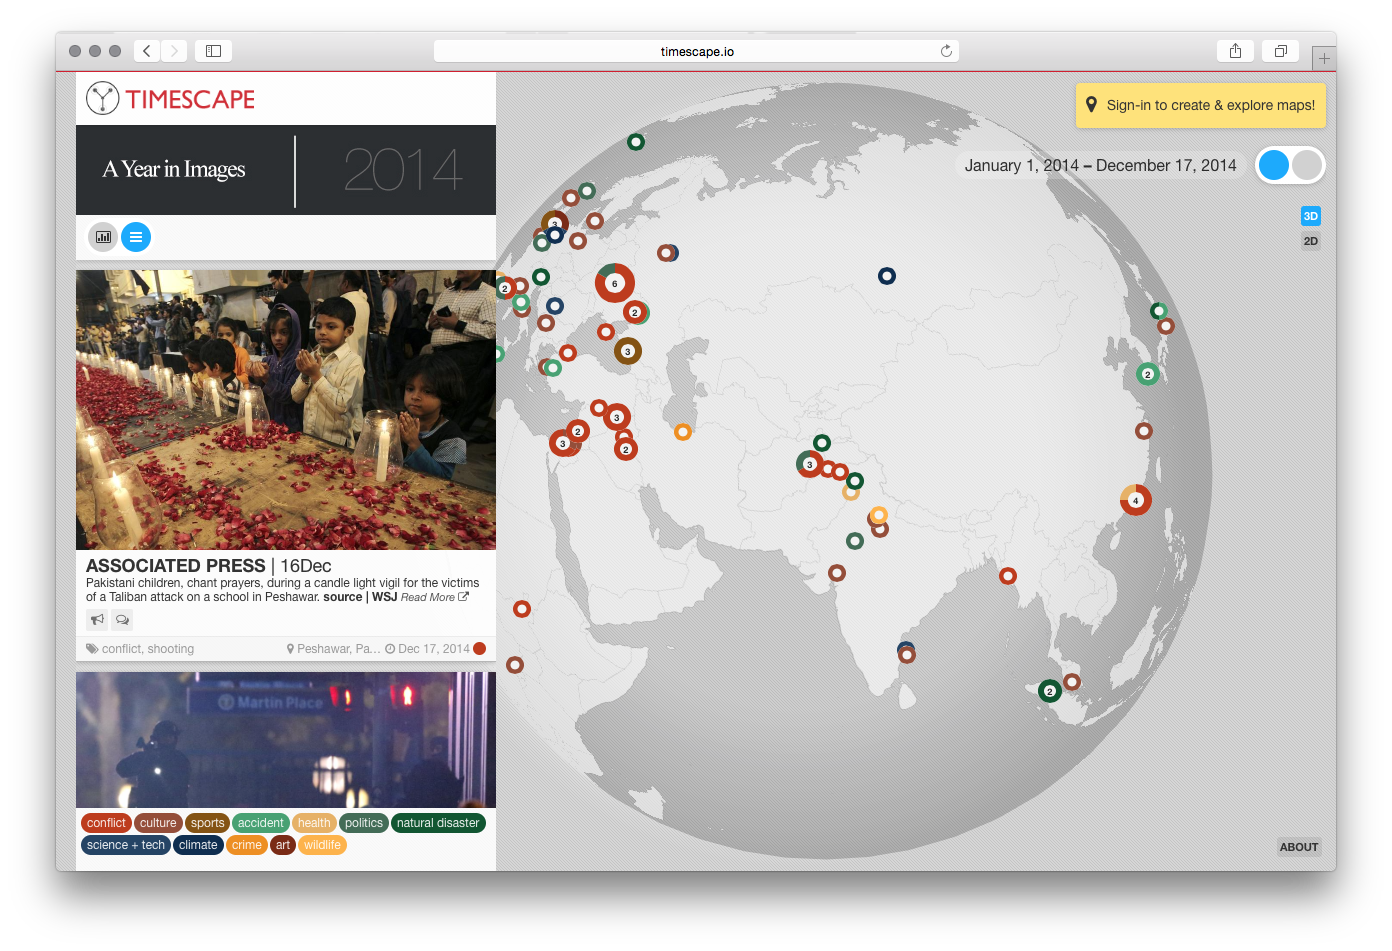
Timescape
Unknown
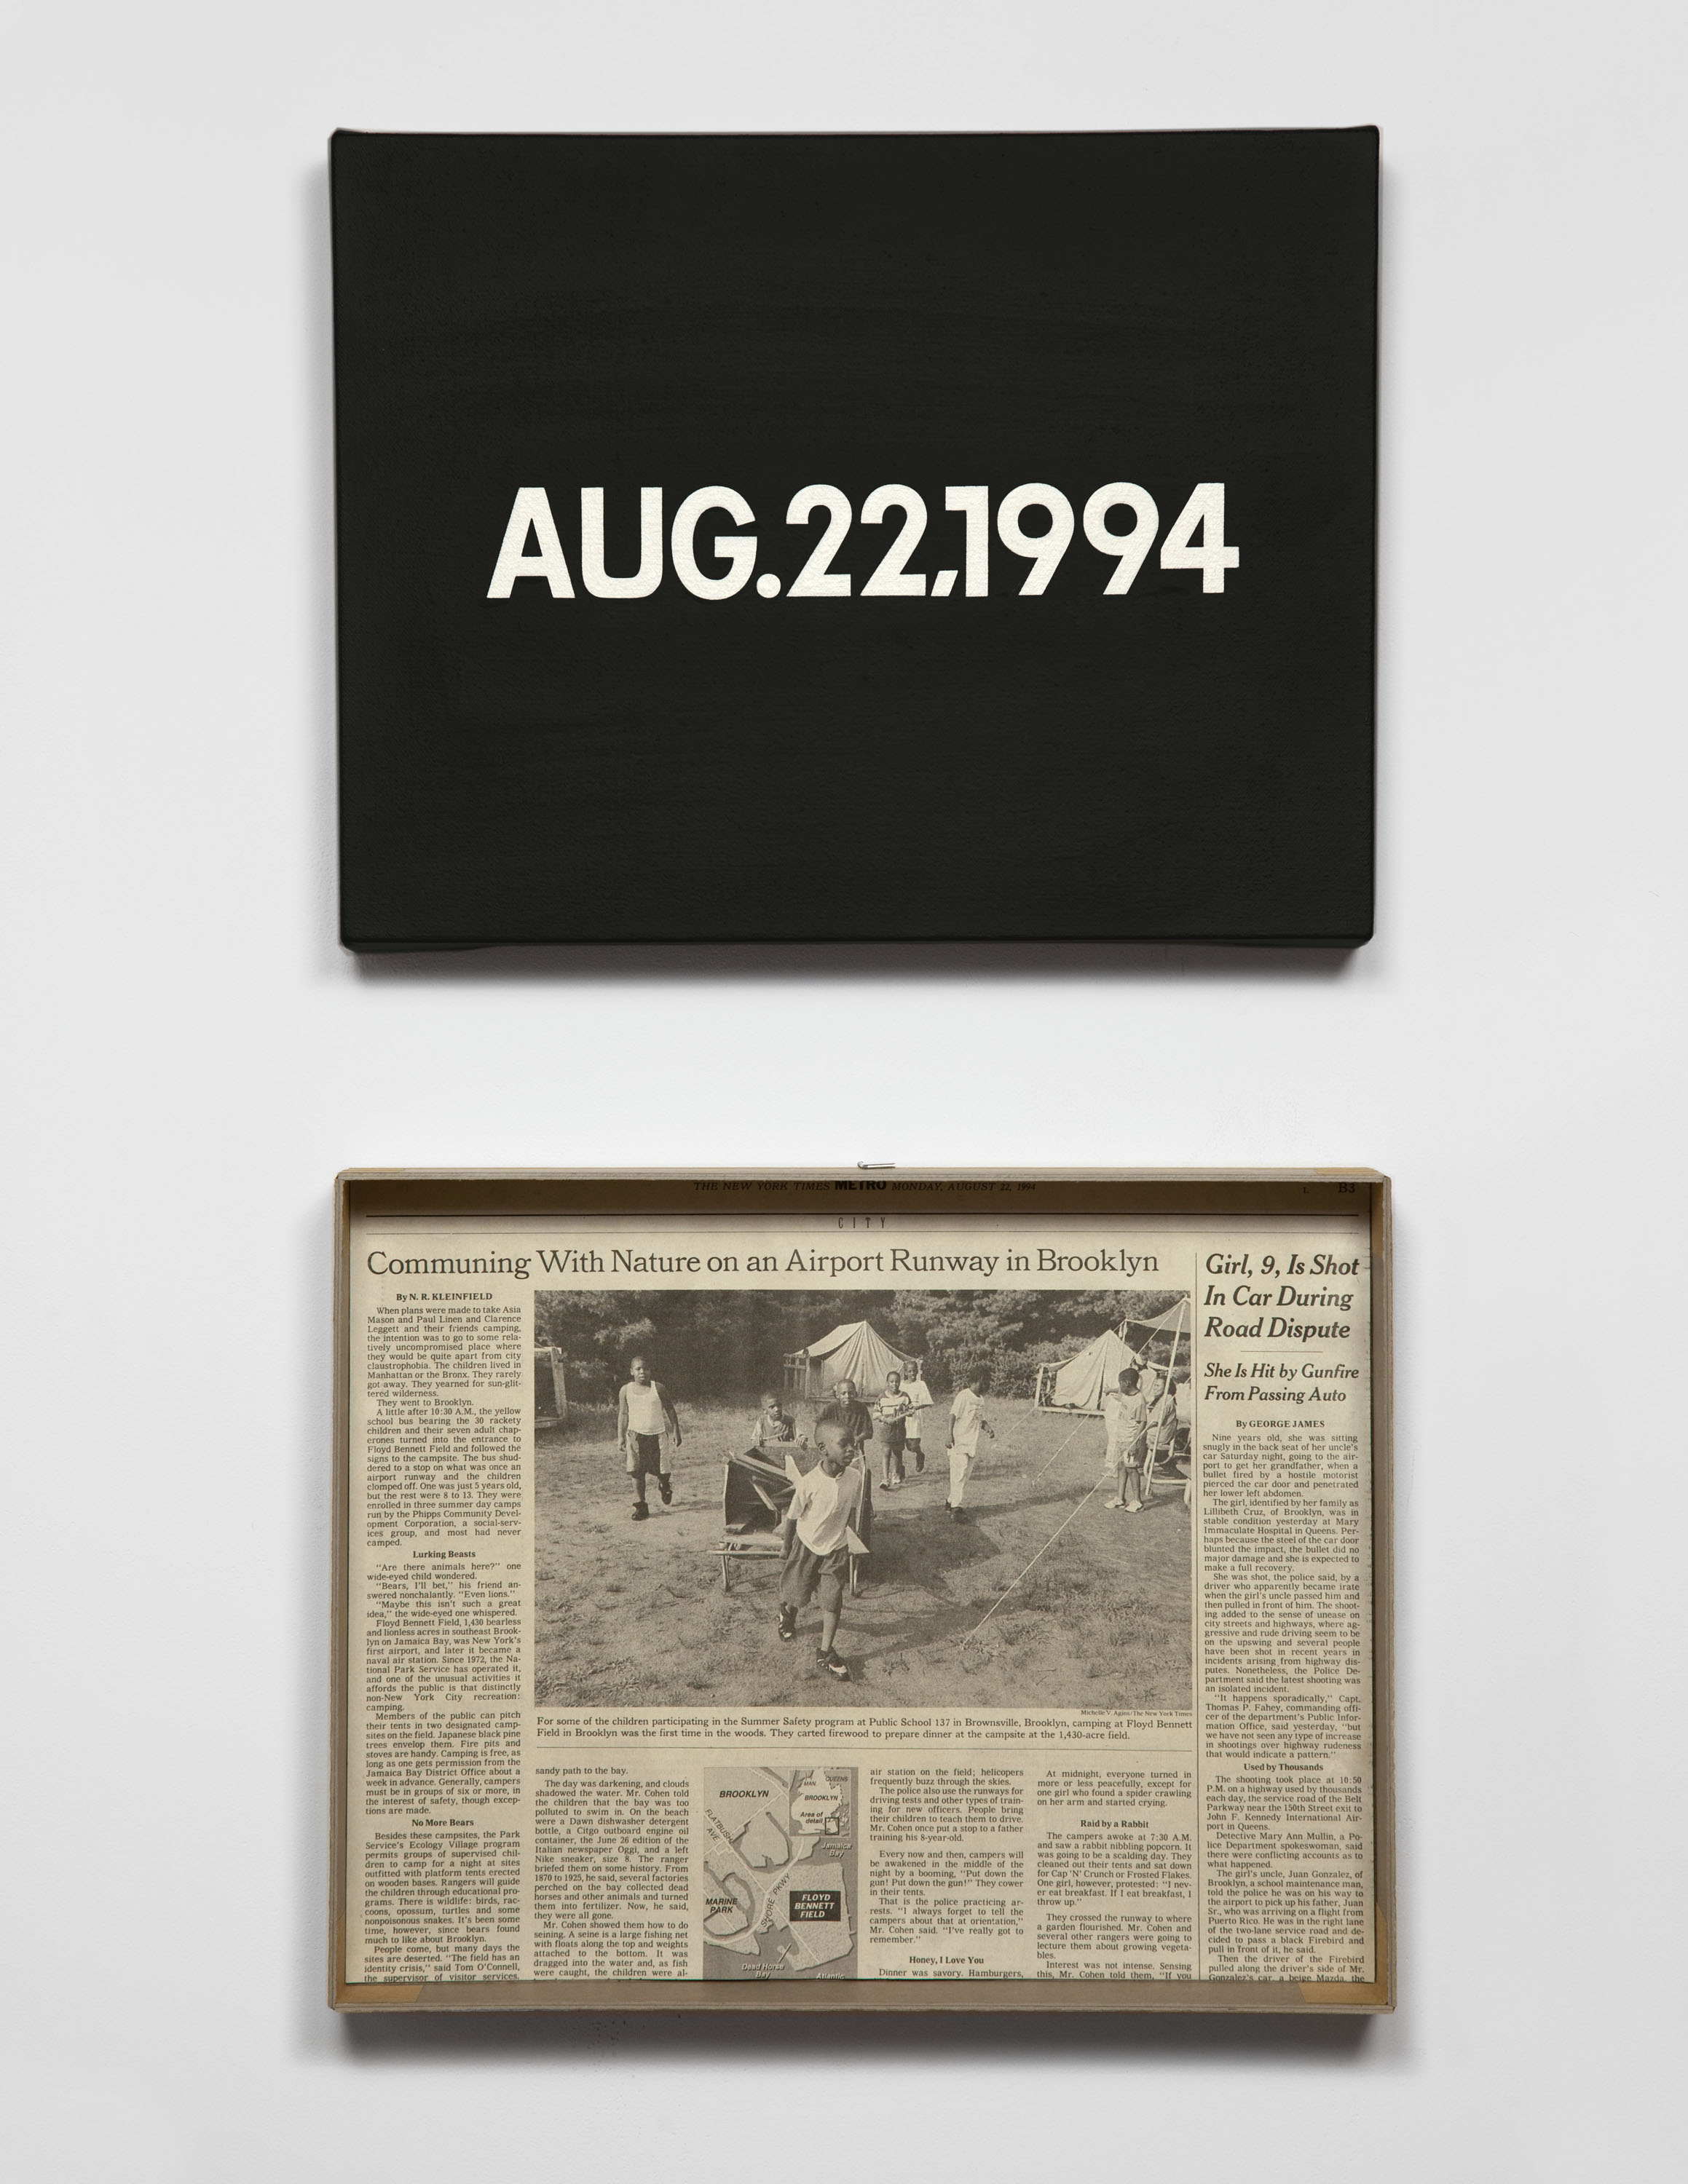
Today Series
On Kawara
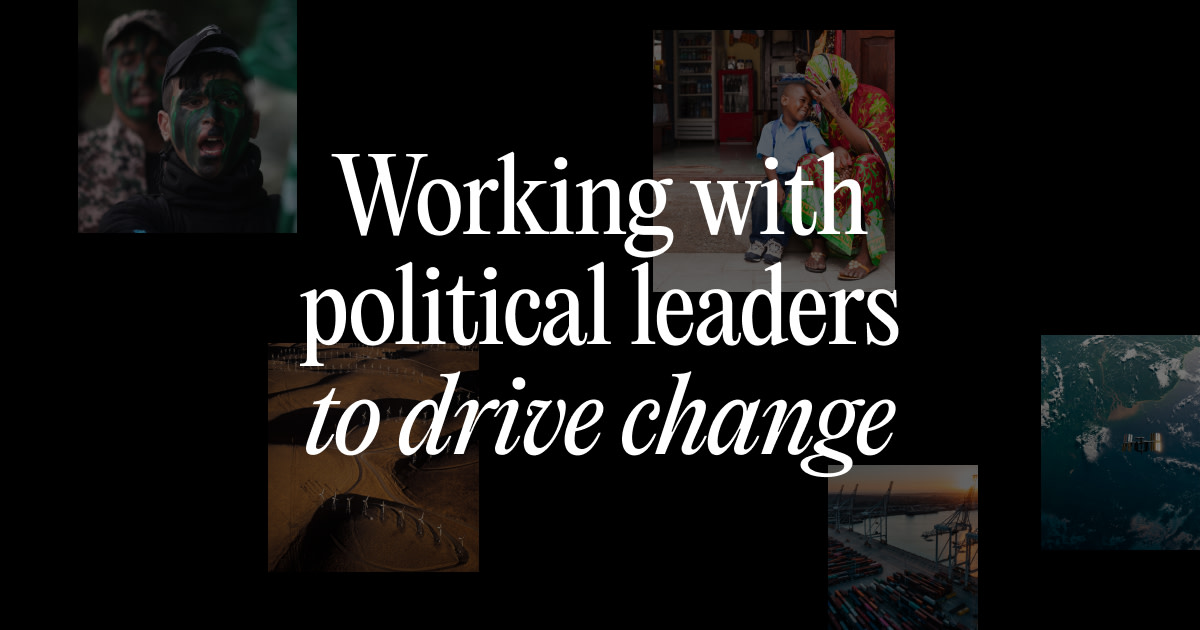
Tony Blair Institute for Global Change
TBI
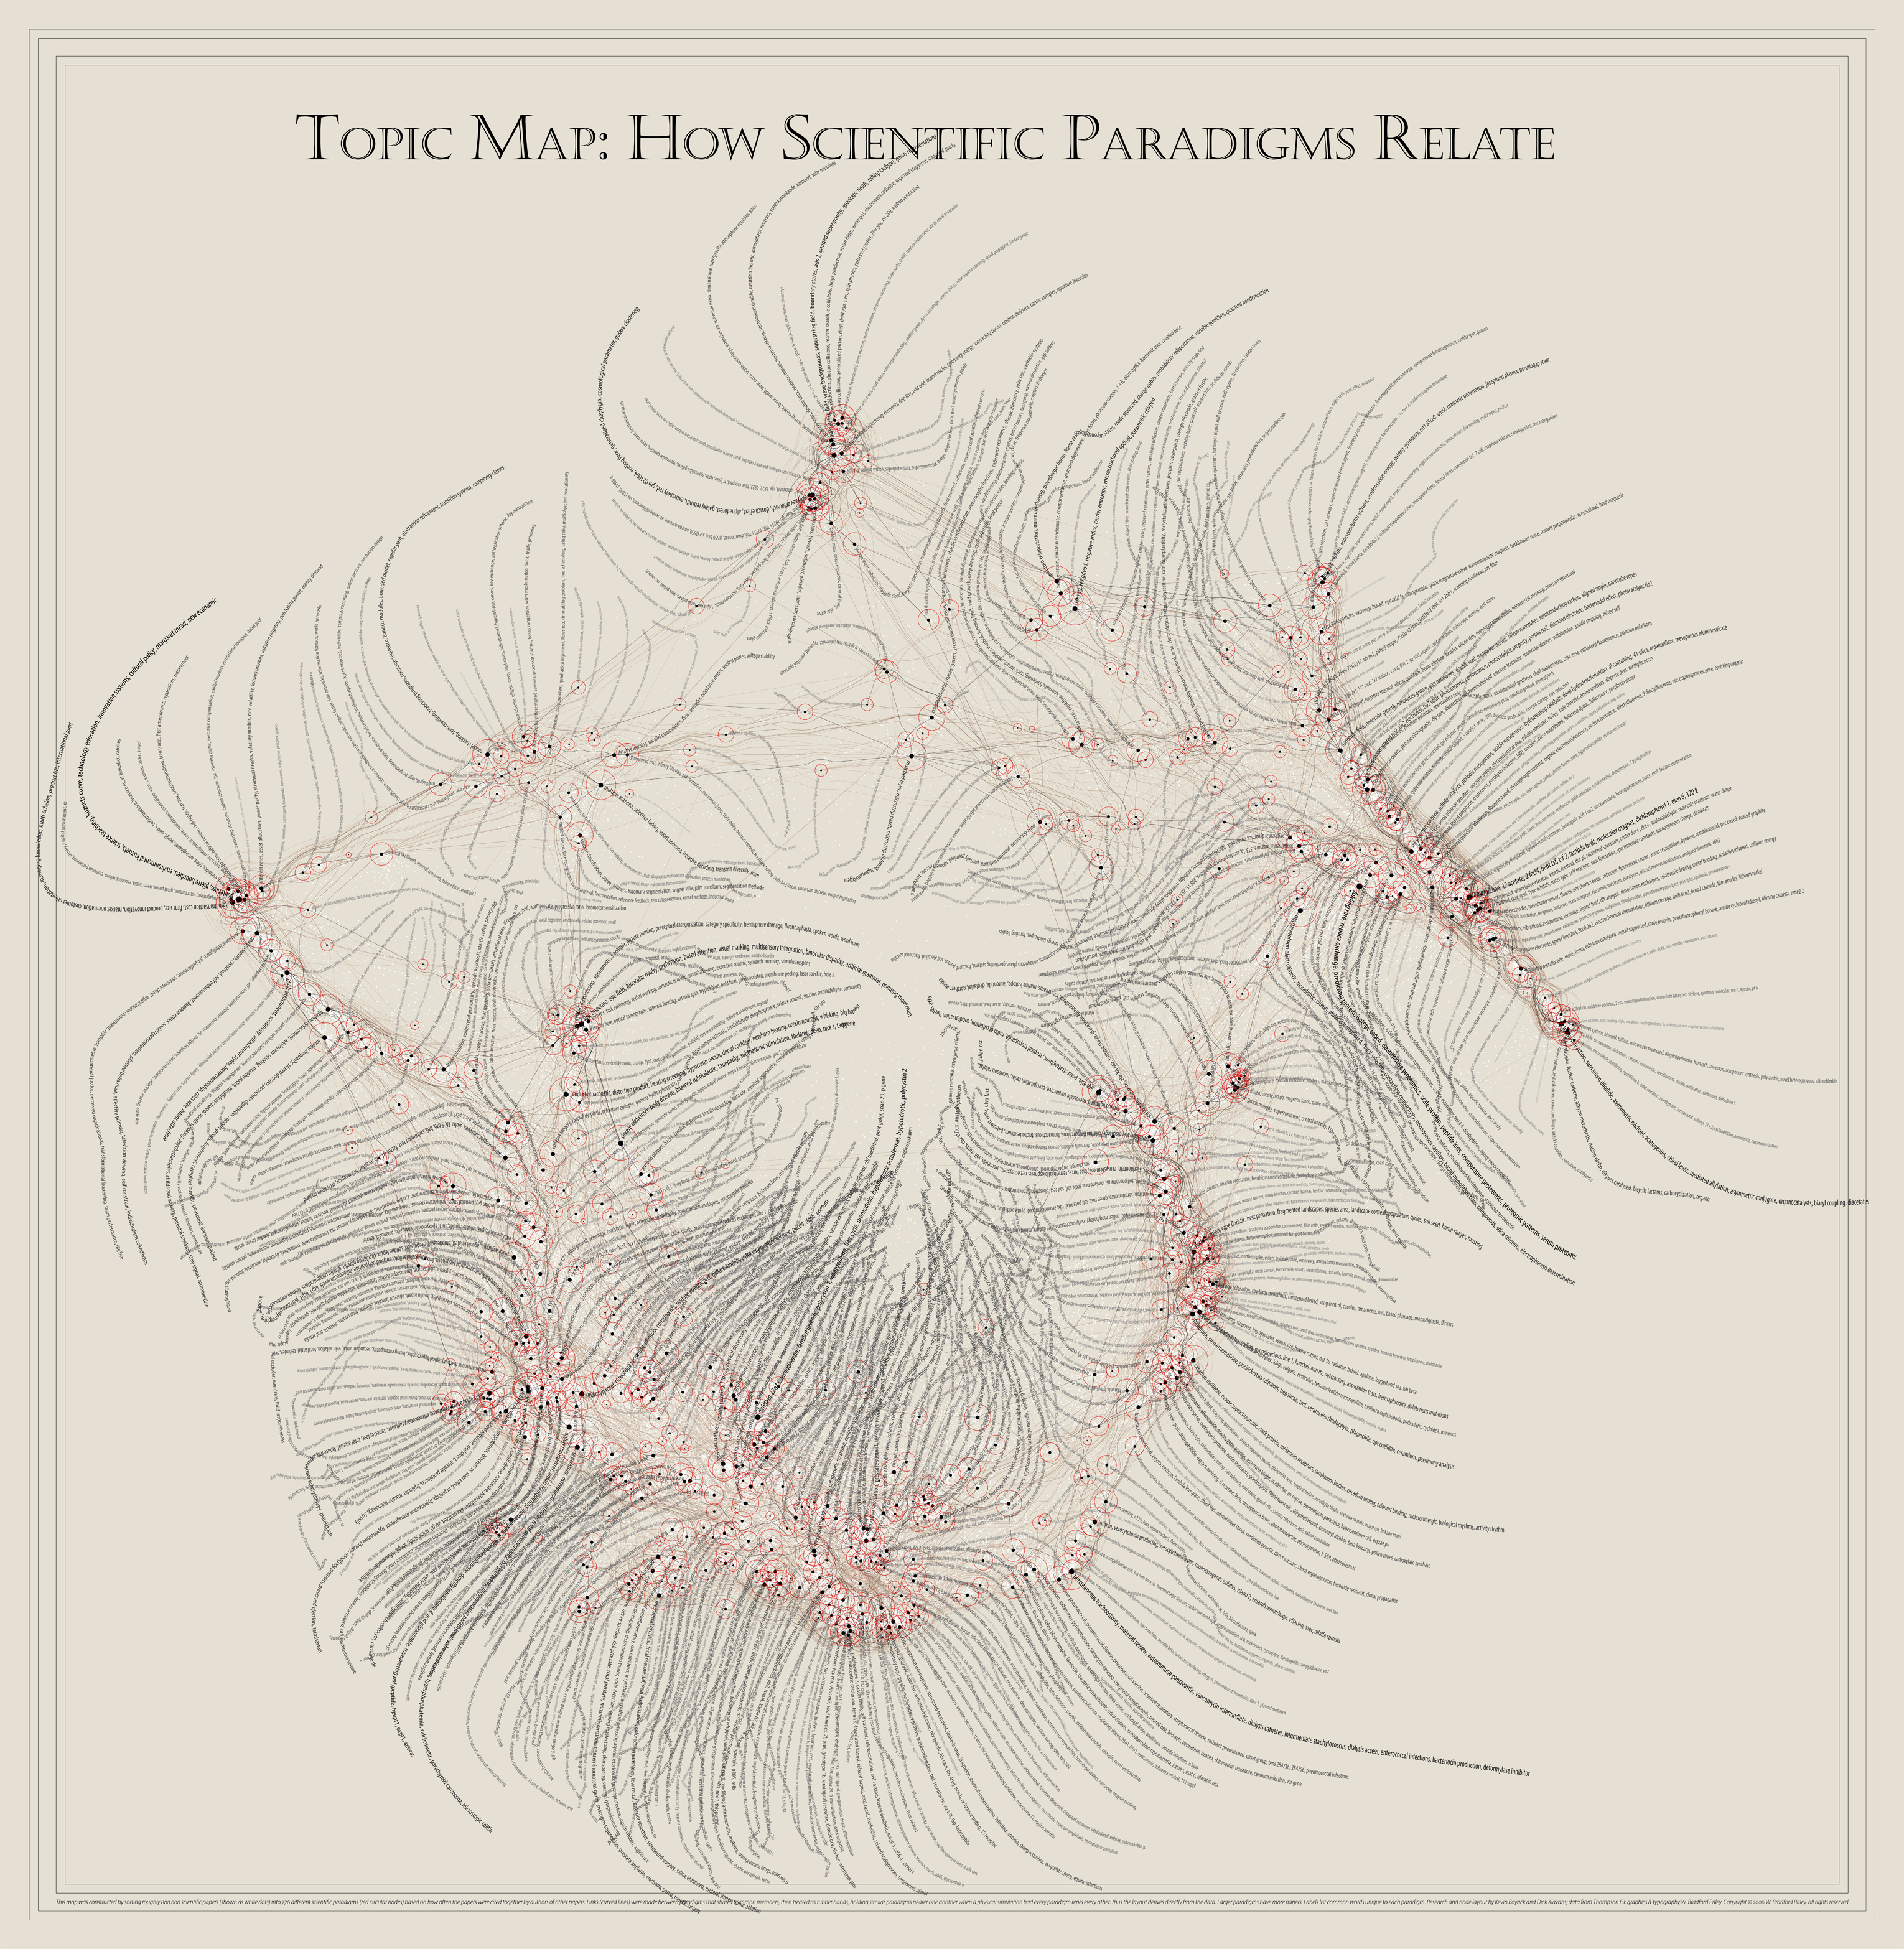
Topic Map
W. Bradford Paley
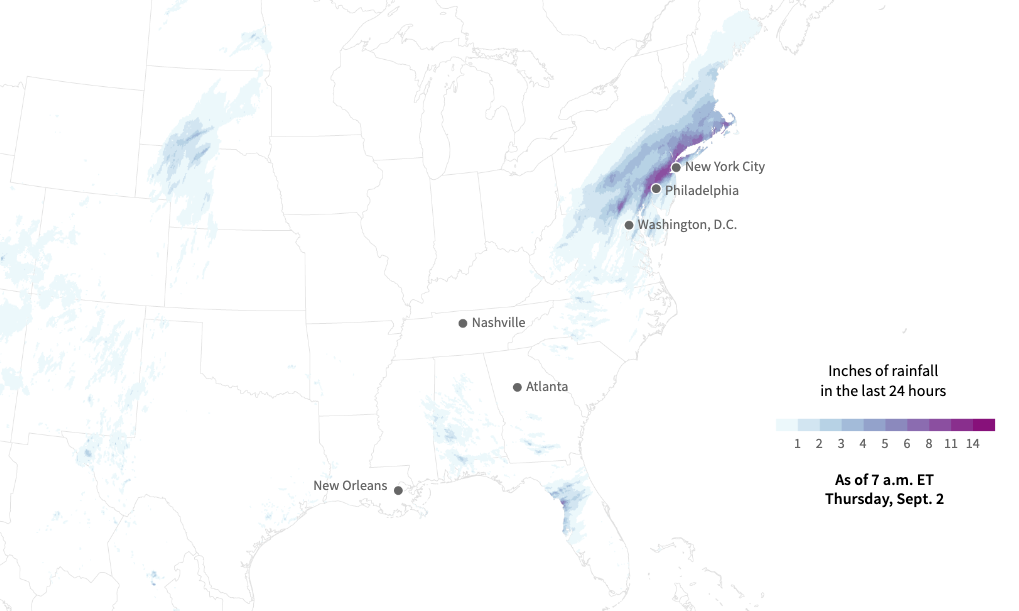
Torrential Rains
Reuters
Tourisms: suitCase Studies
Diller Scofidio + Renfro
Trace
Stamen Design
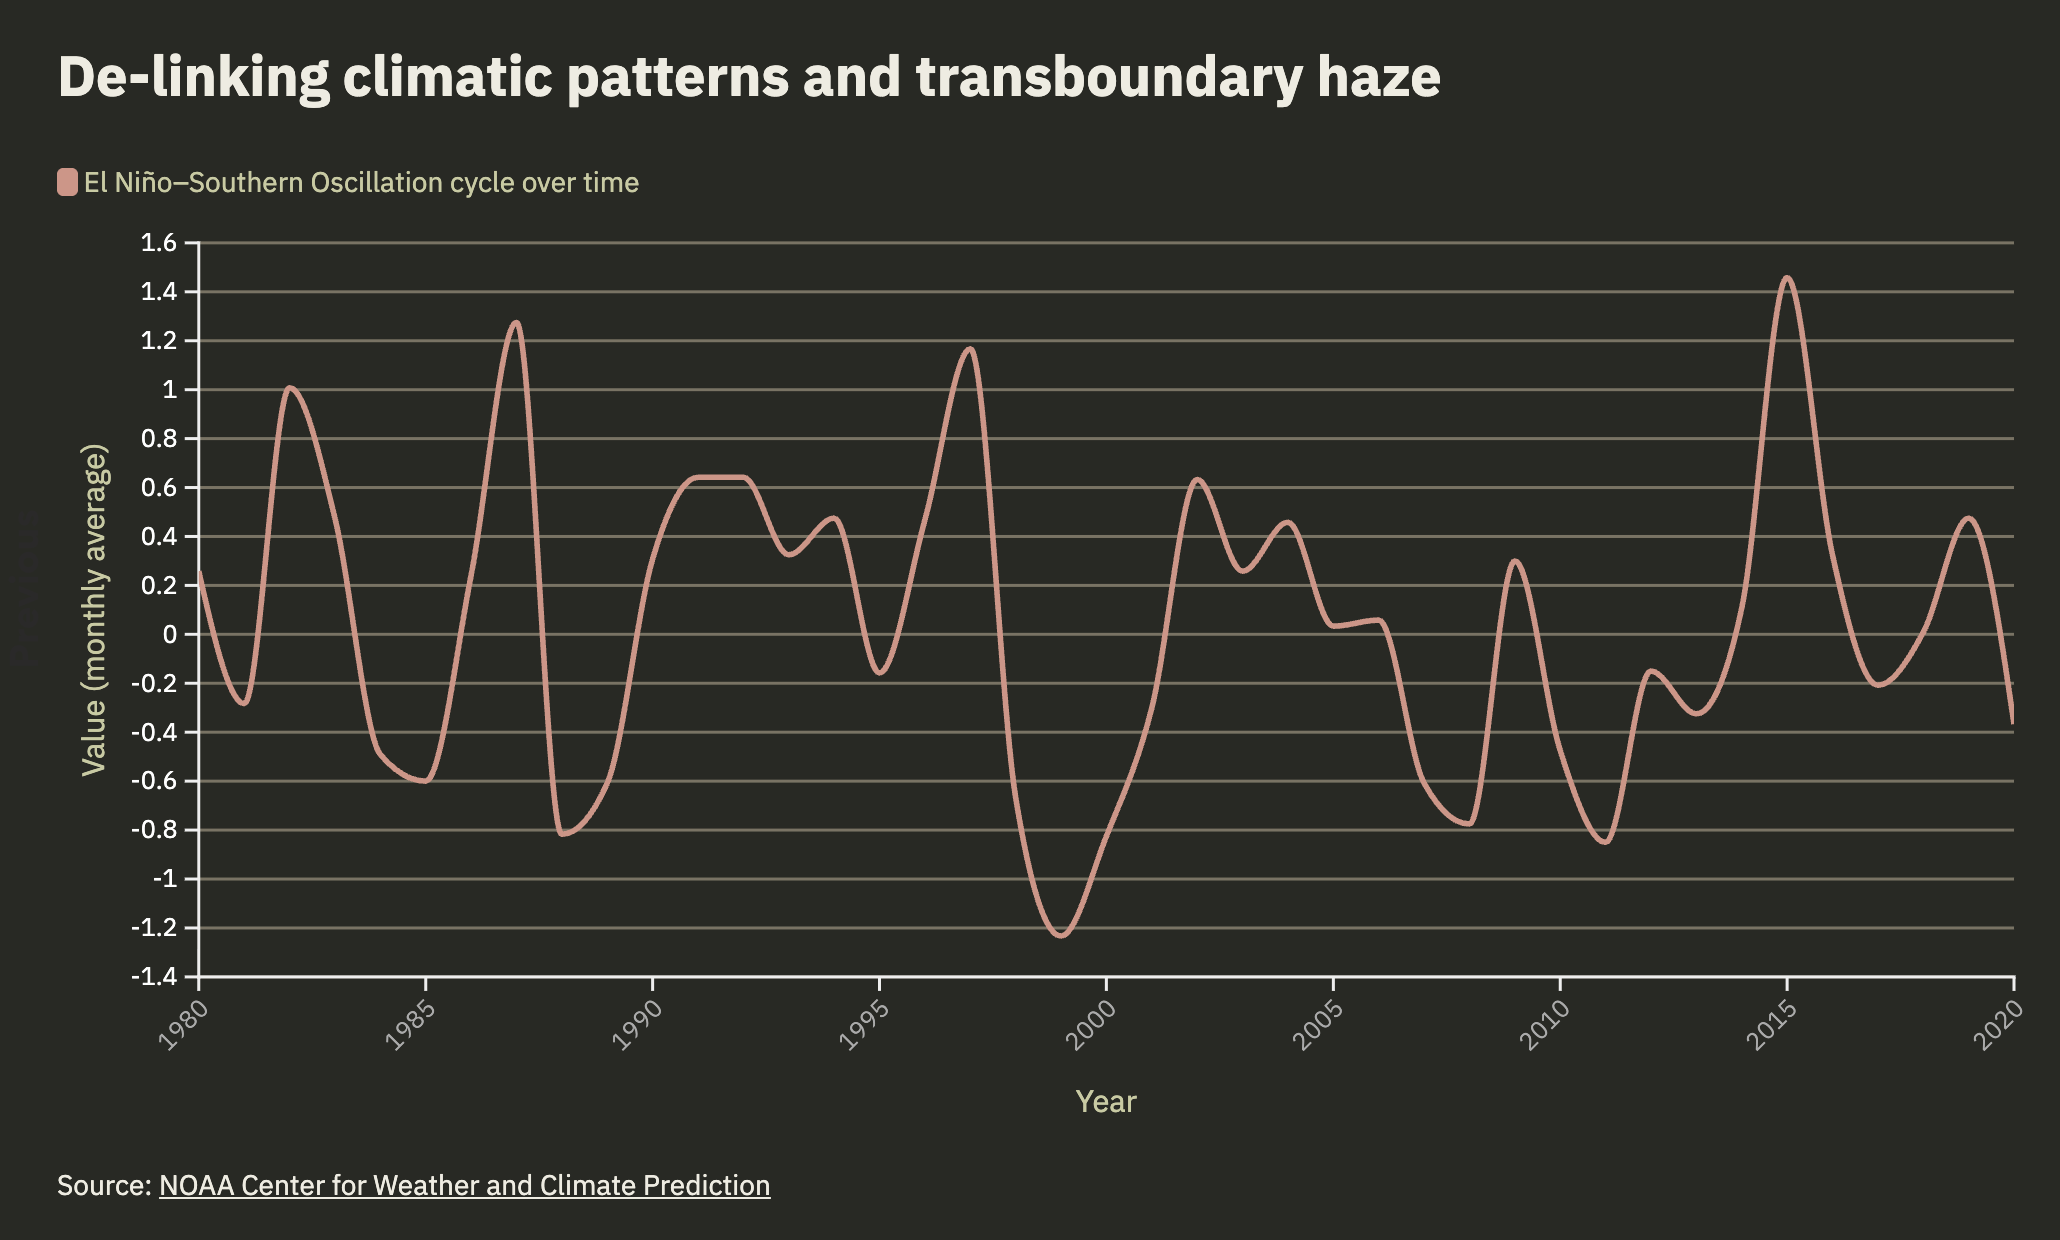
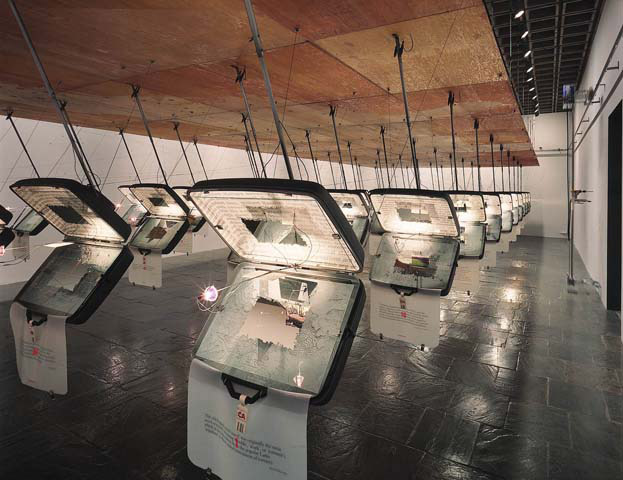
Transboundary Haze in Southeast Asia
Kontinentalist
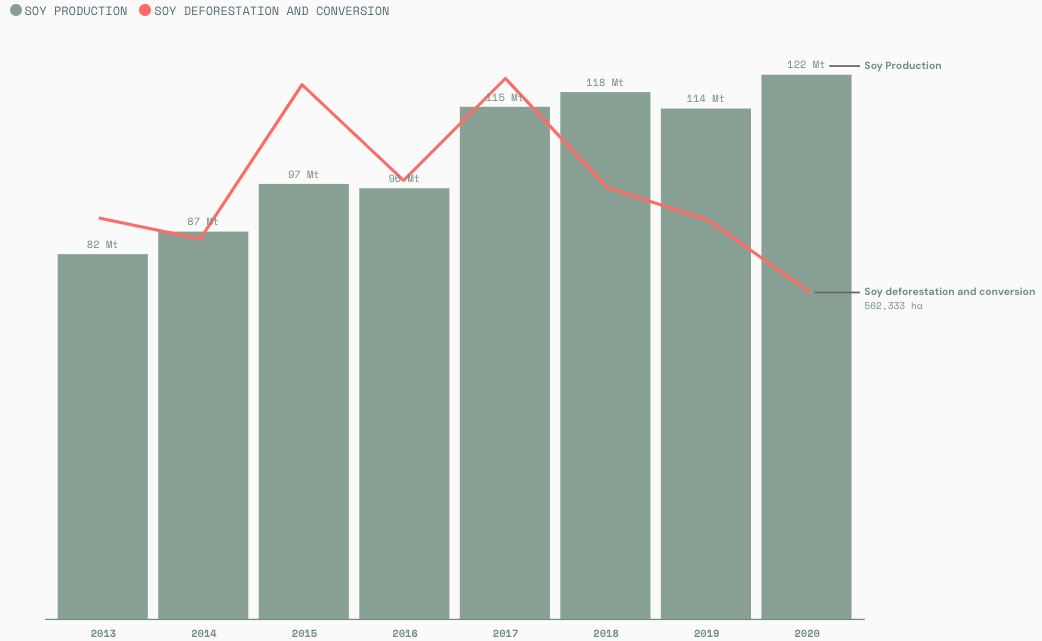
Trase Insights + Yearbook
Trase Insights
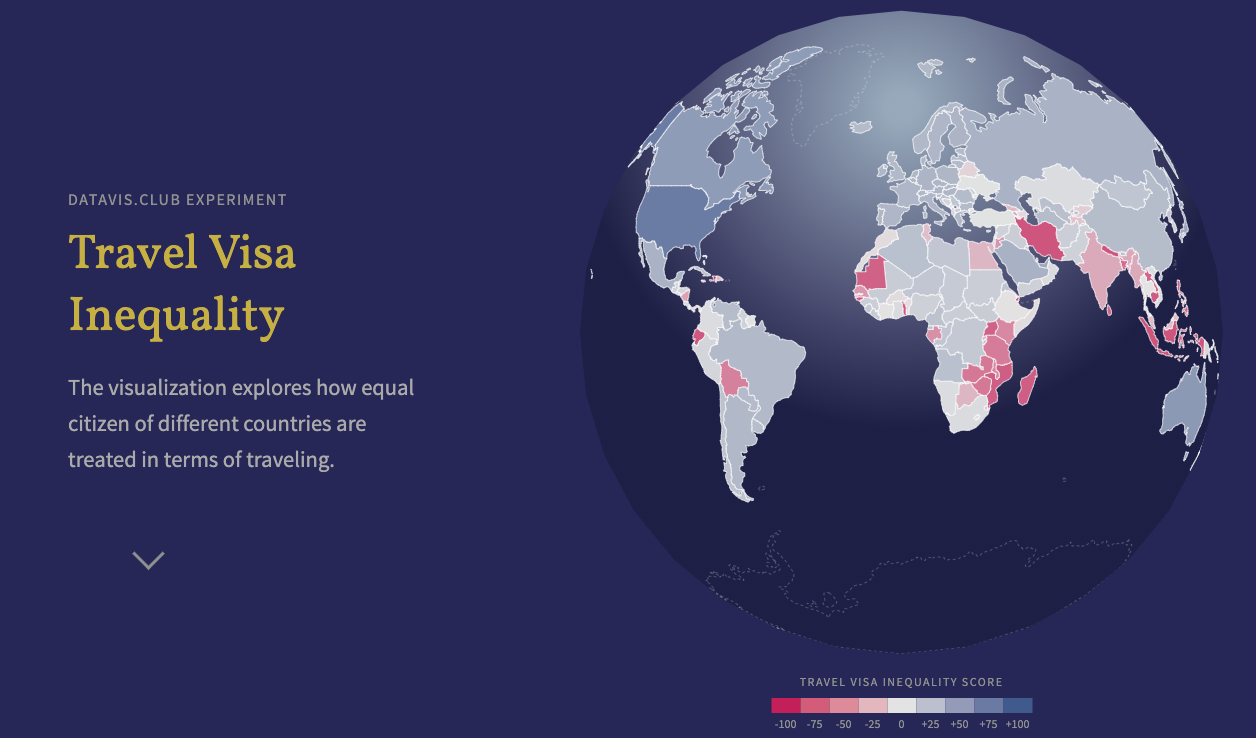
Travel Visa Inequality
Christian Laesser
Treepedia
MIT

TRON: Legacy
GMUNK
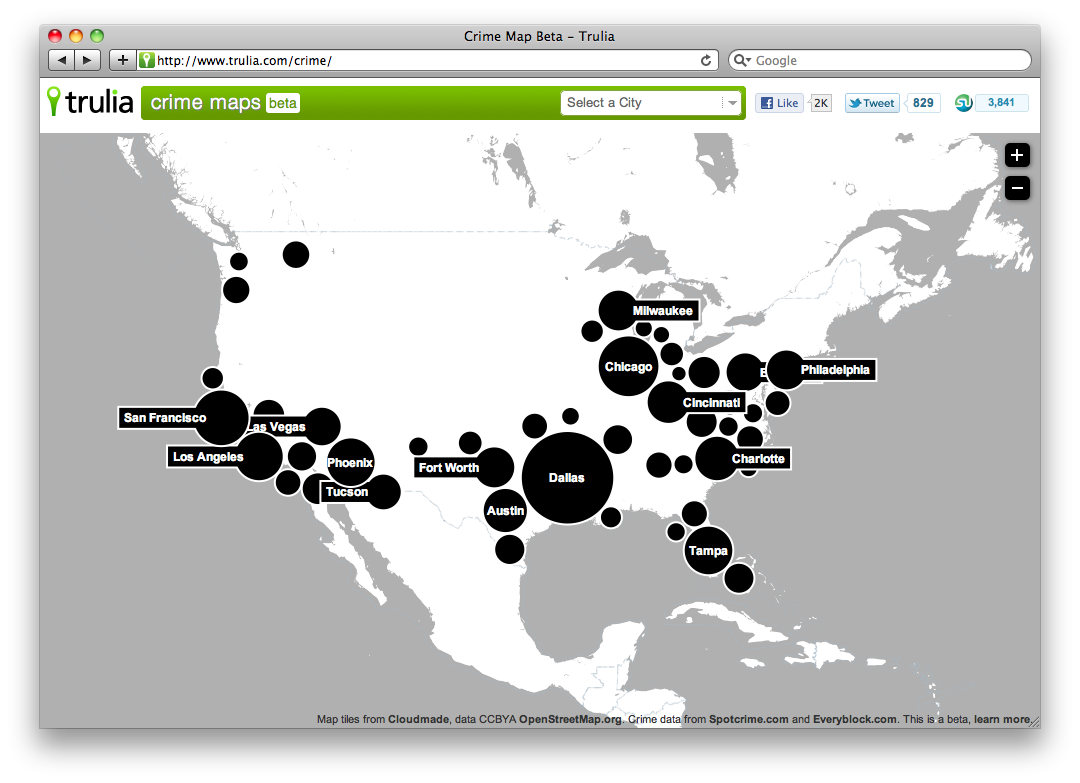
Trulia Maps
Trulia
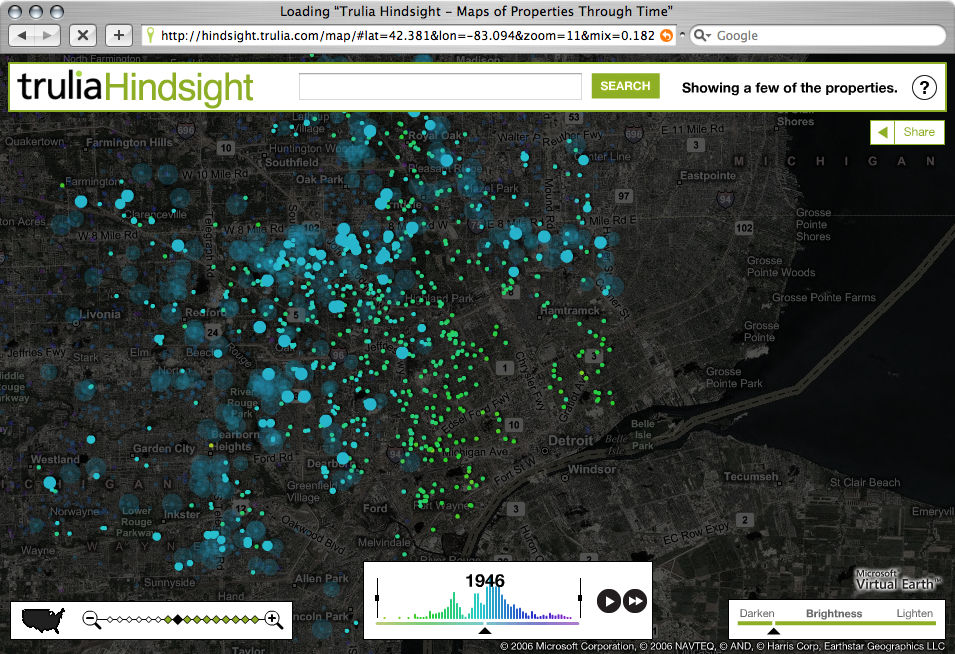
Trulia Visualizations
Stamen Design
Twitter + Flickr
Eric Fischer
Twitter New Years
Aaron Koblin
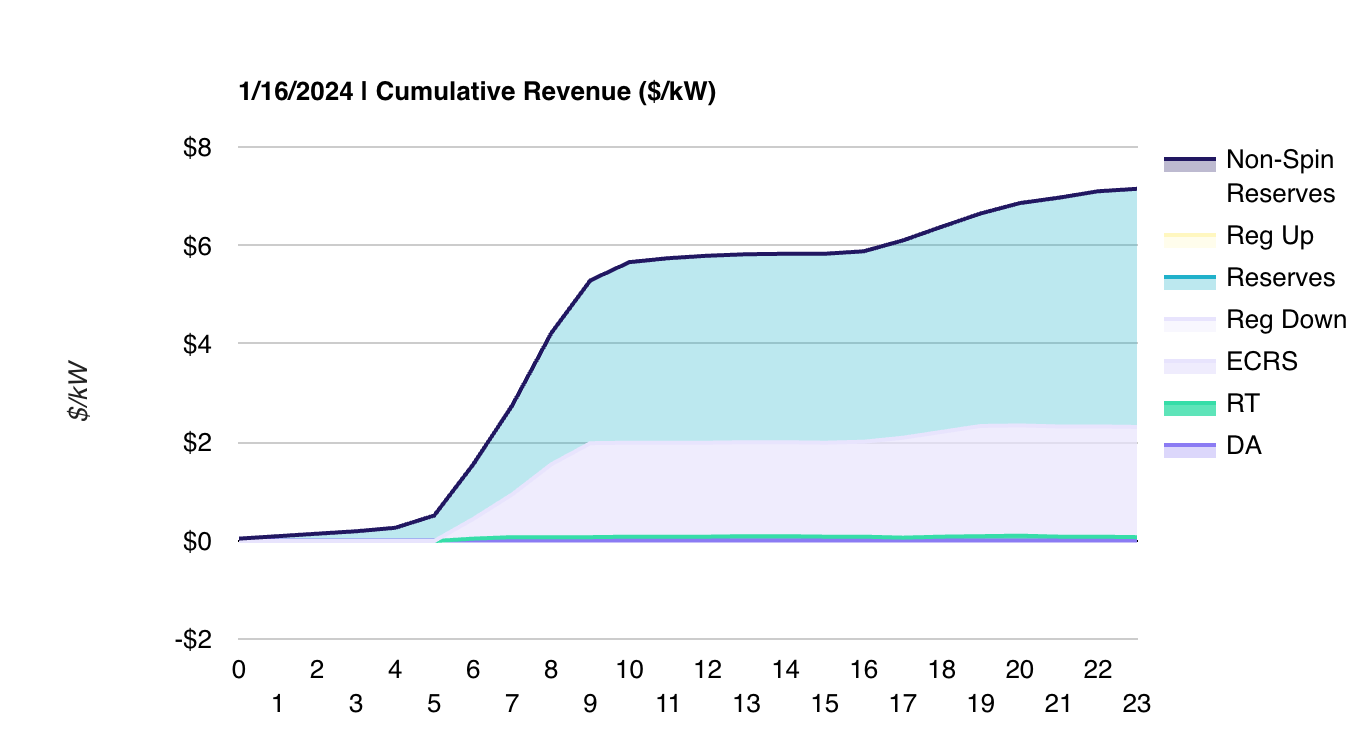
Tyba Energy
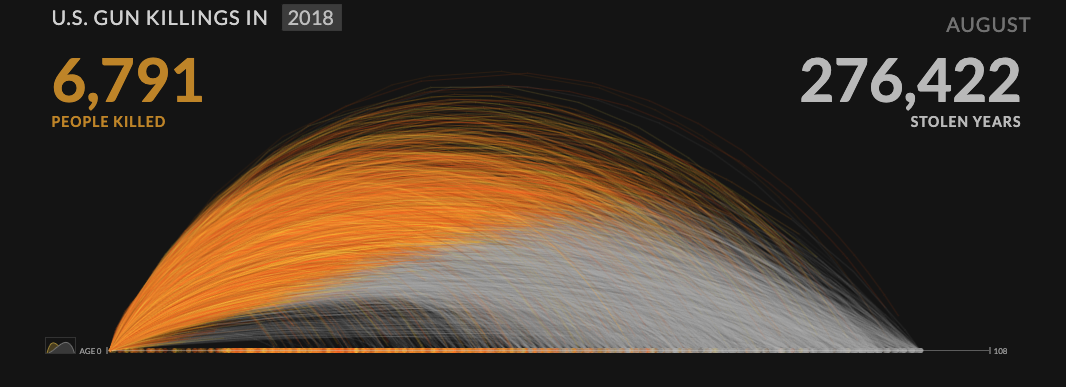
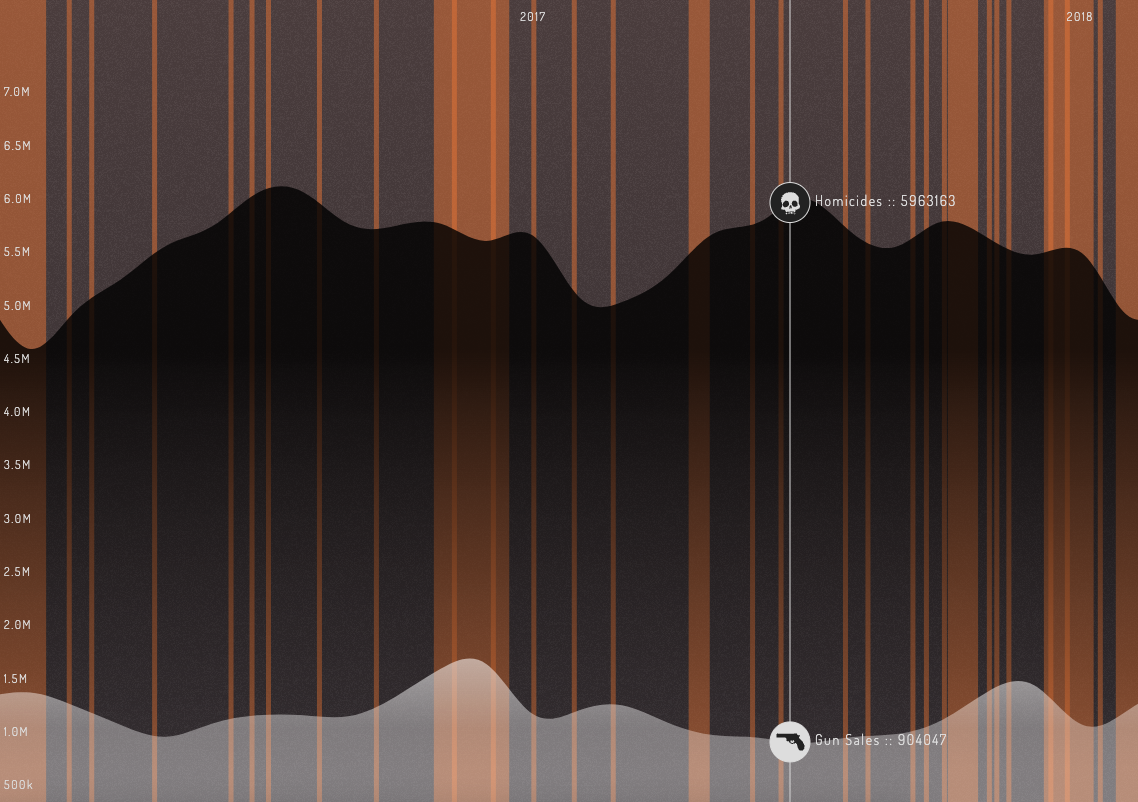
U.S. Gun Deaths
Under the Influence
ABC News
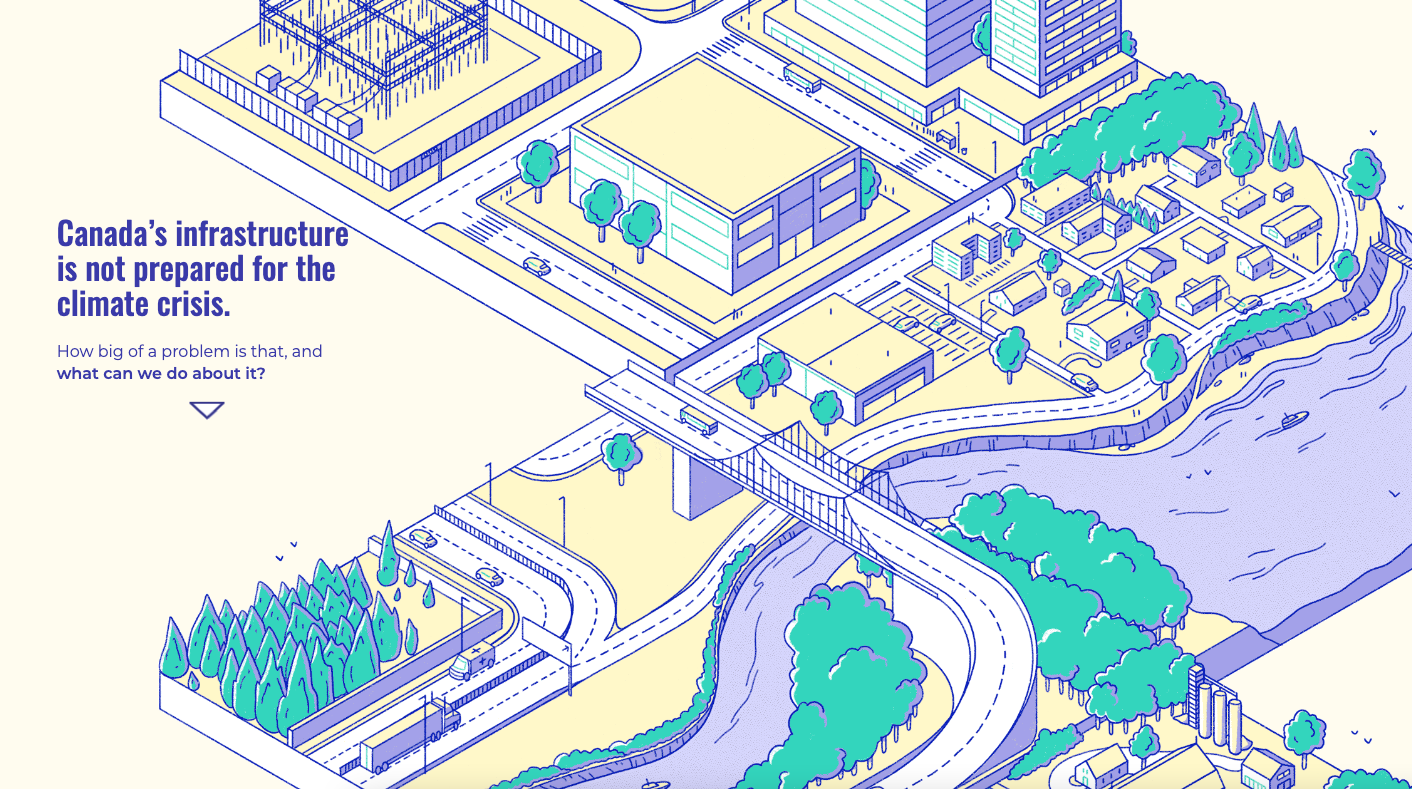
Under Water: the Costs of Climate Change for Canada’s Infrastructure
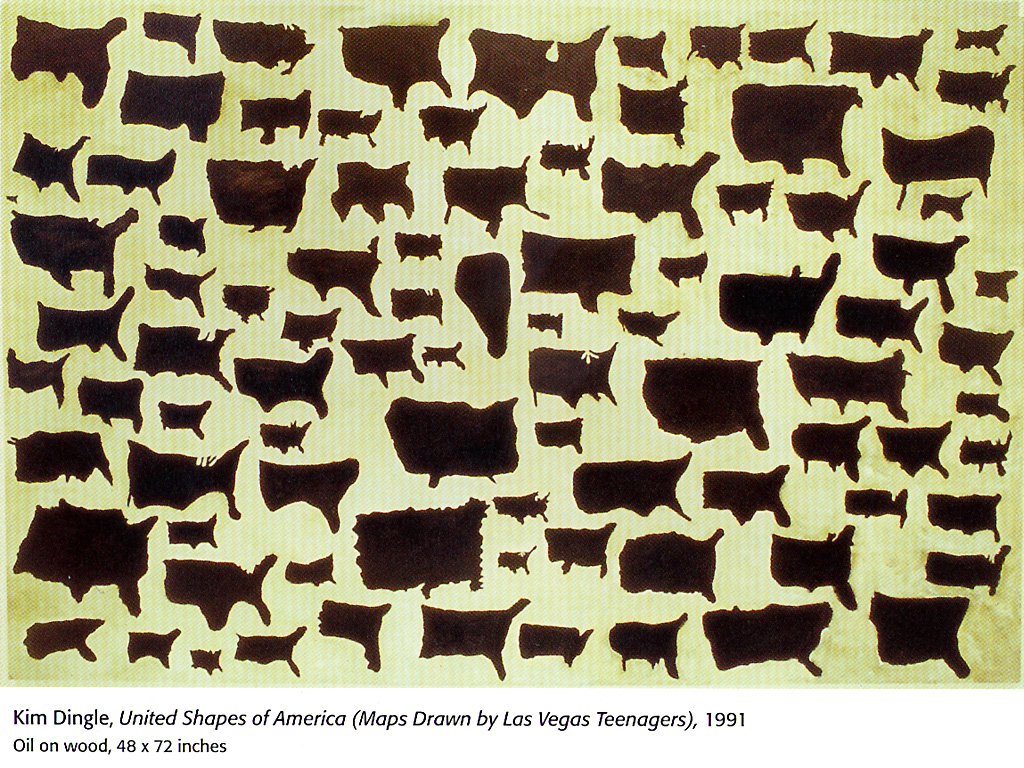
United Shapes of America
Neil Freeman
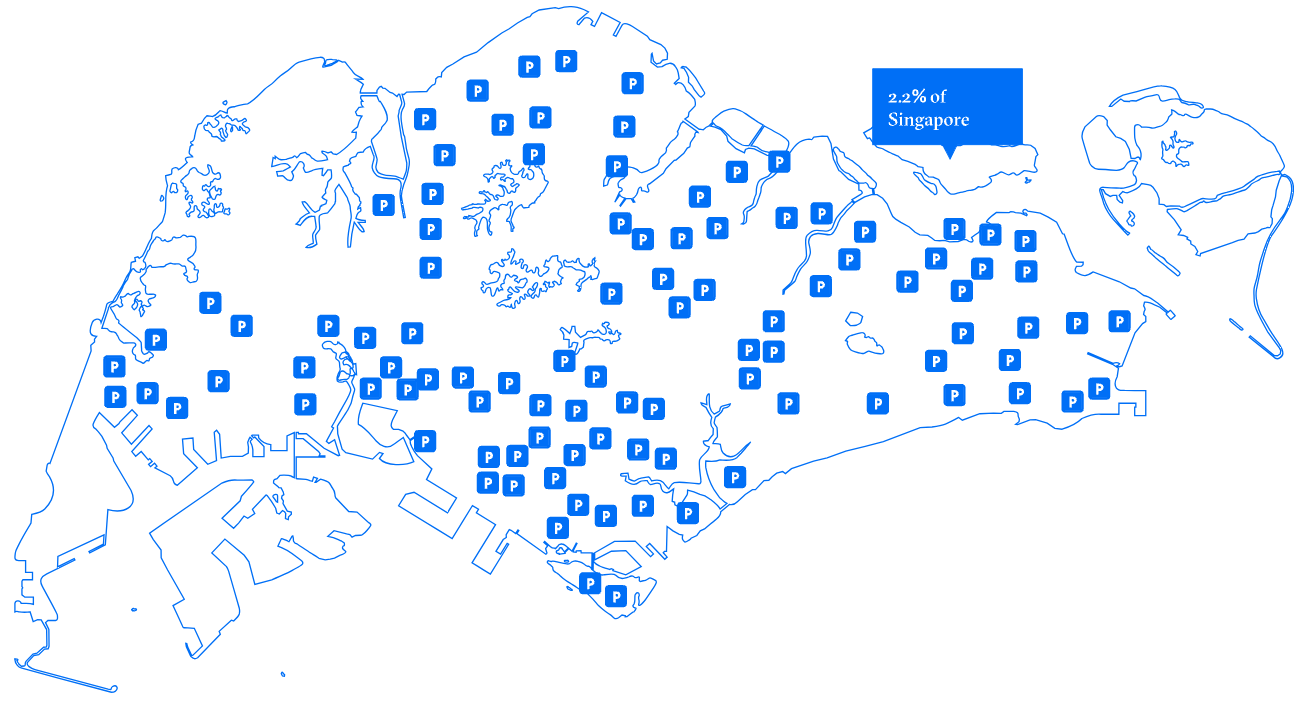
Unparking
MIT
Up in Flames
Reuters
Urbagram Archipelago
Urbagram
Urban Data Visualizations
Bill Rankin

Usps Delivers
V&a Collection Site
V&A
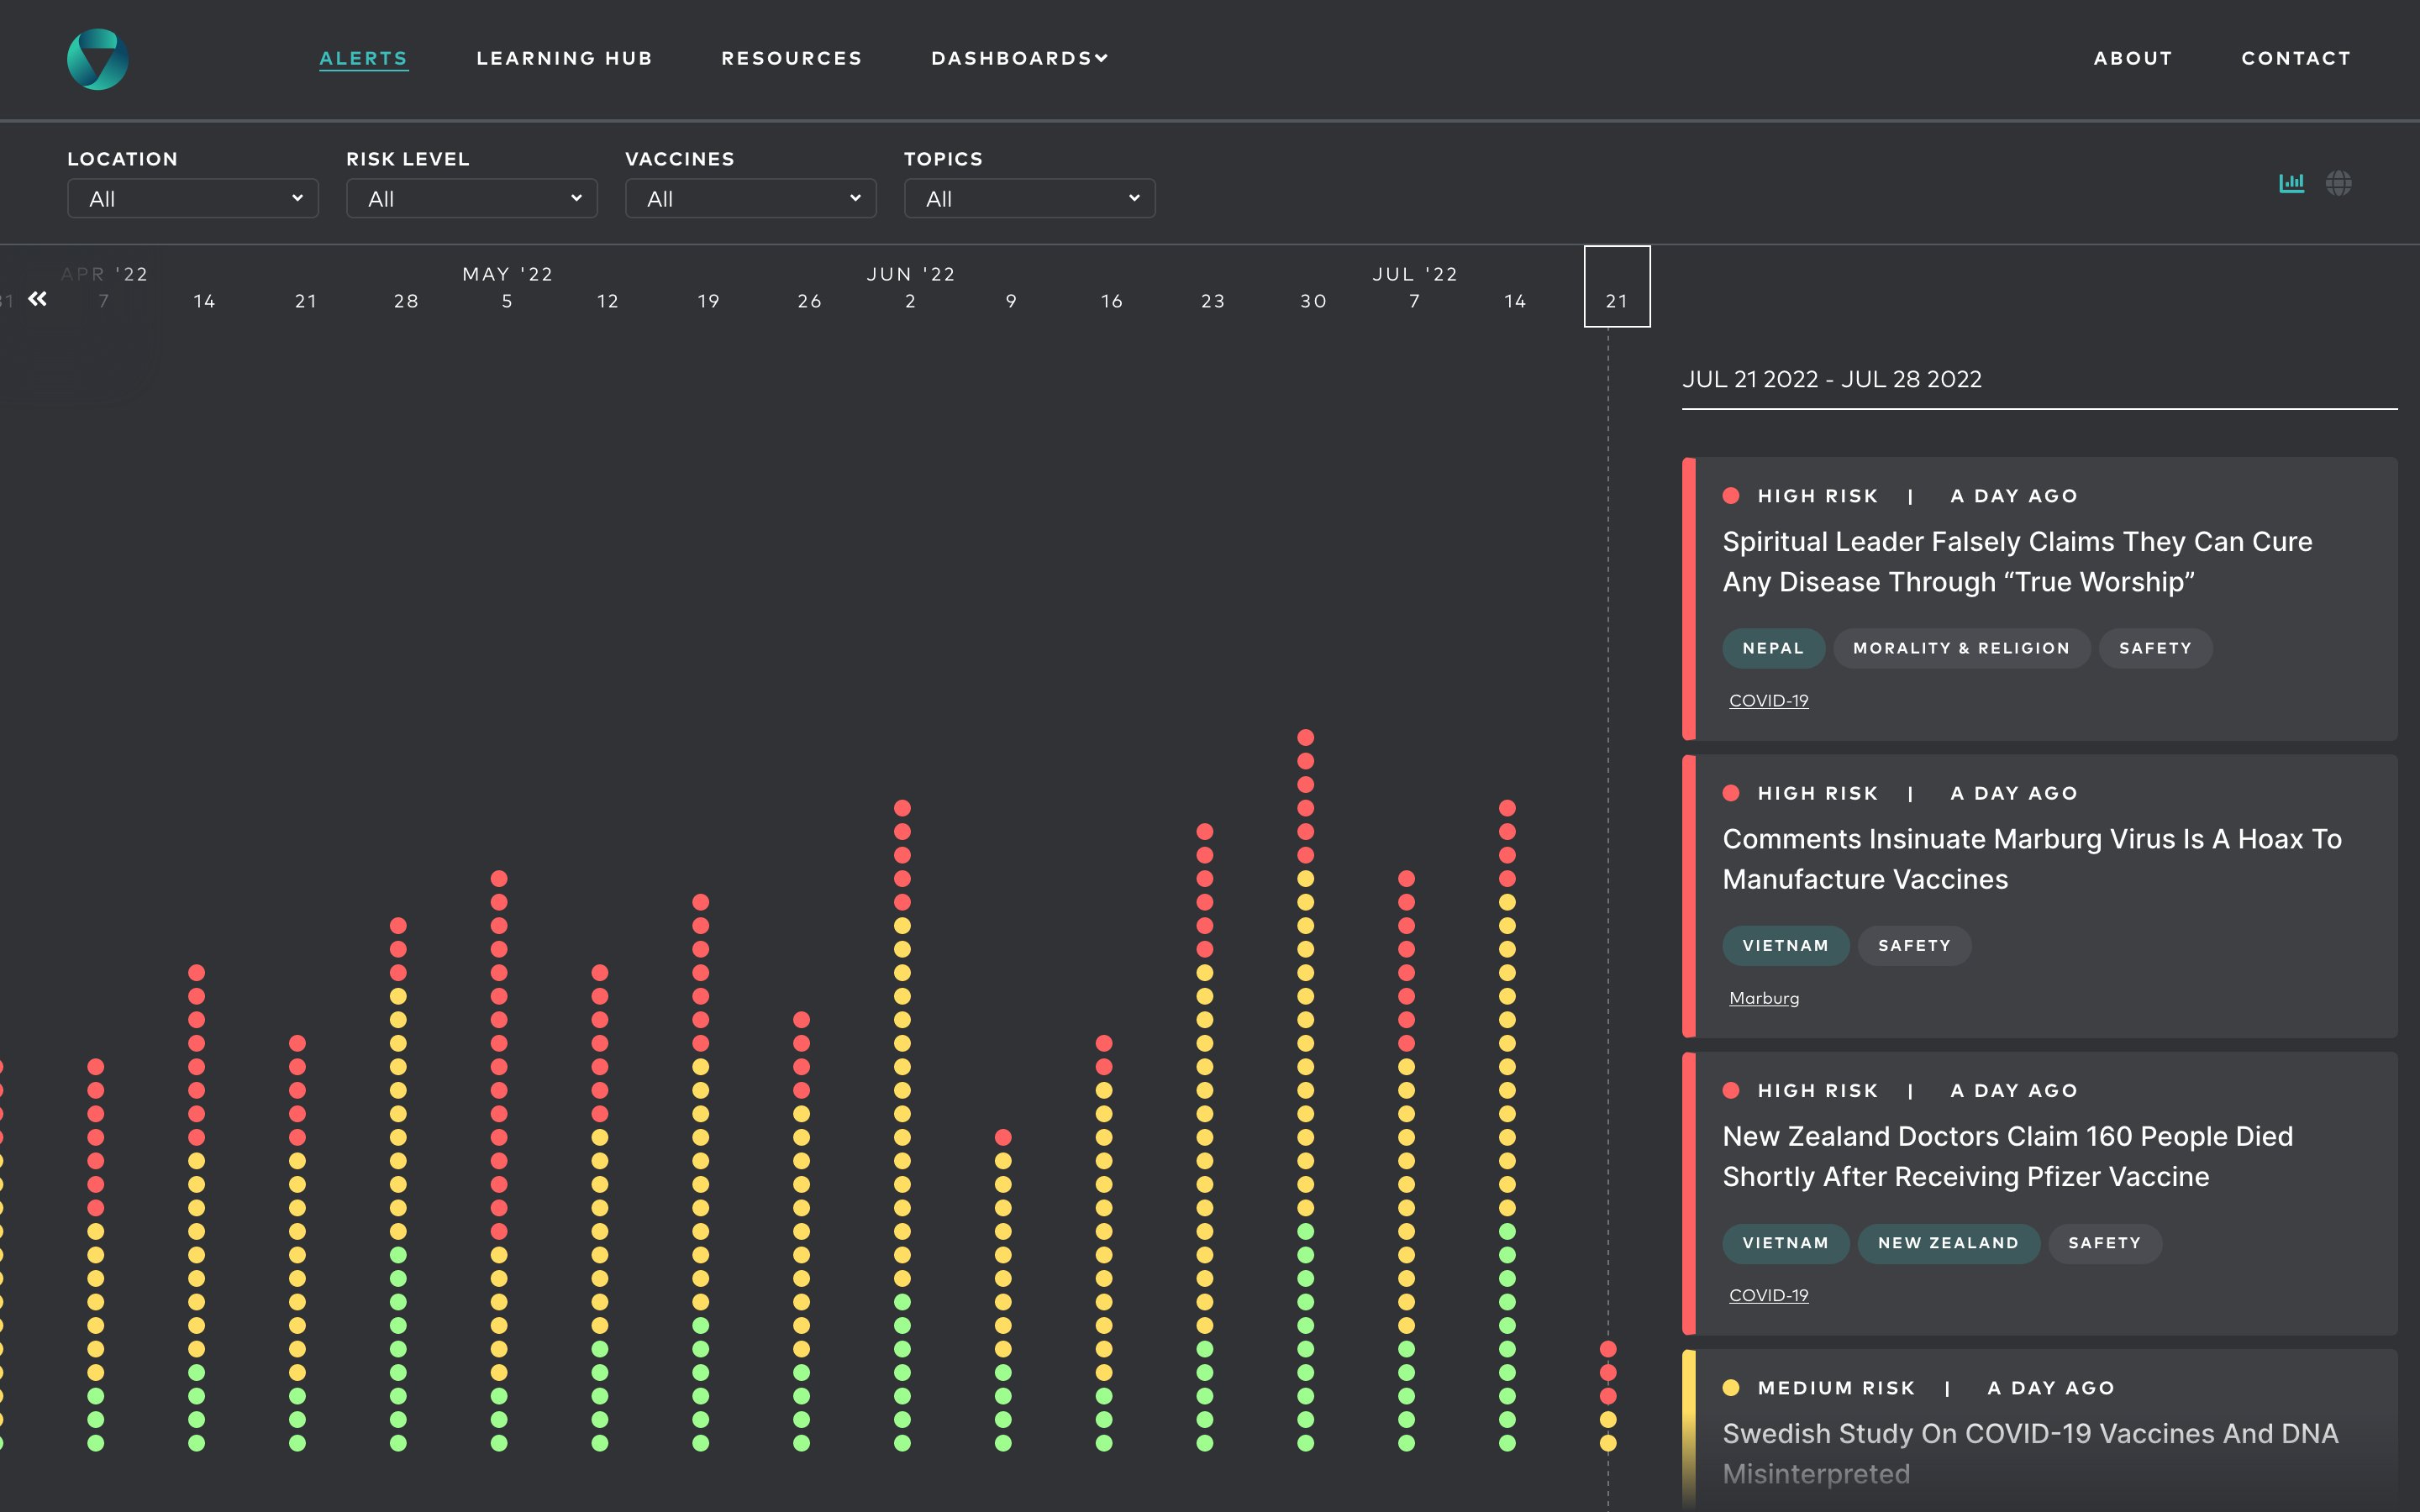
Vaccination Demand Observatory

Valence
Ben Fry
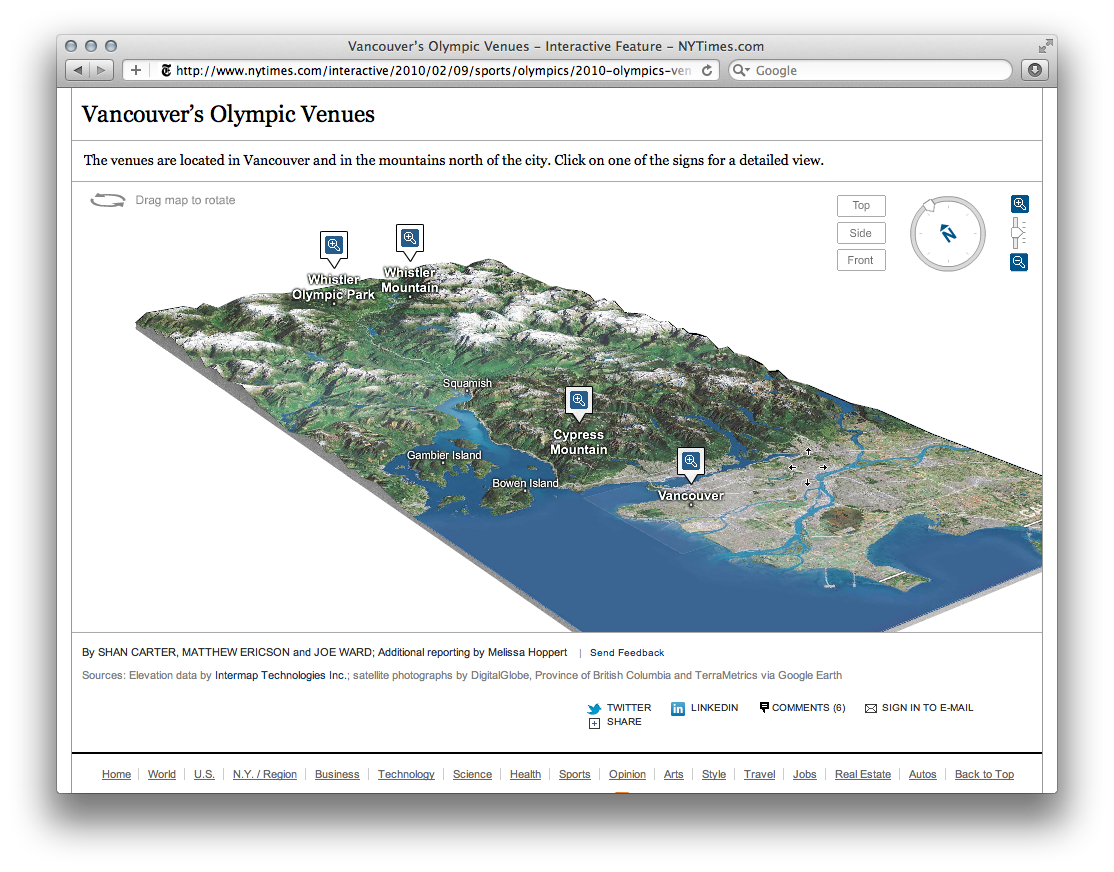
Vancouver Olympics Venues
New York Times Graphics
Video Averages
Jason Salavon
Visualizing Censorship in Iran
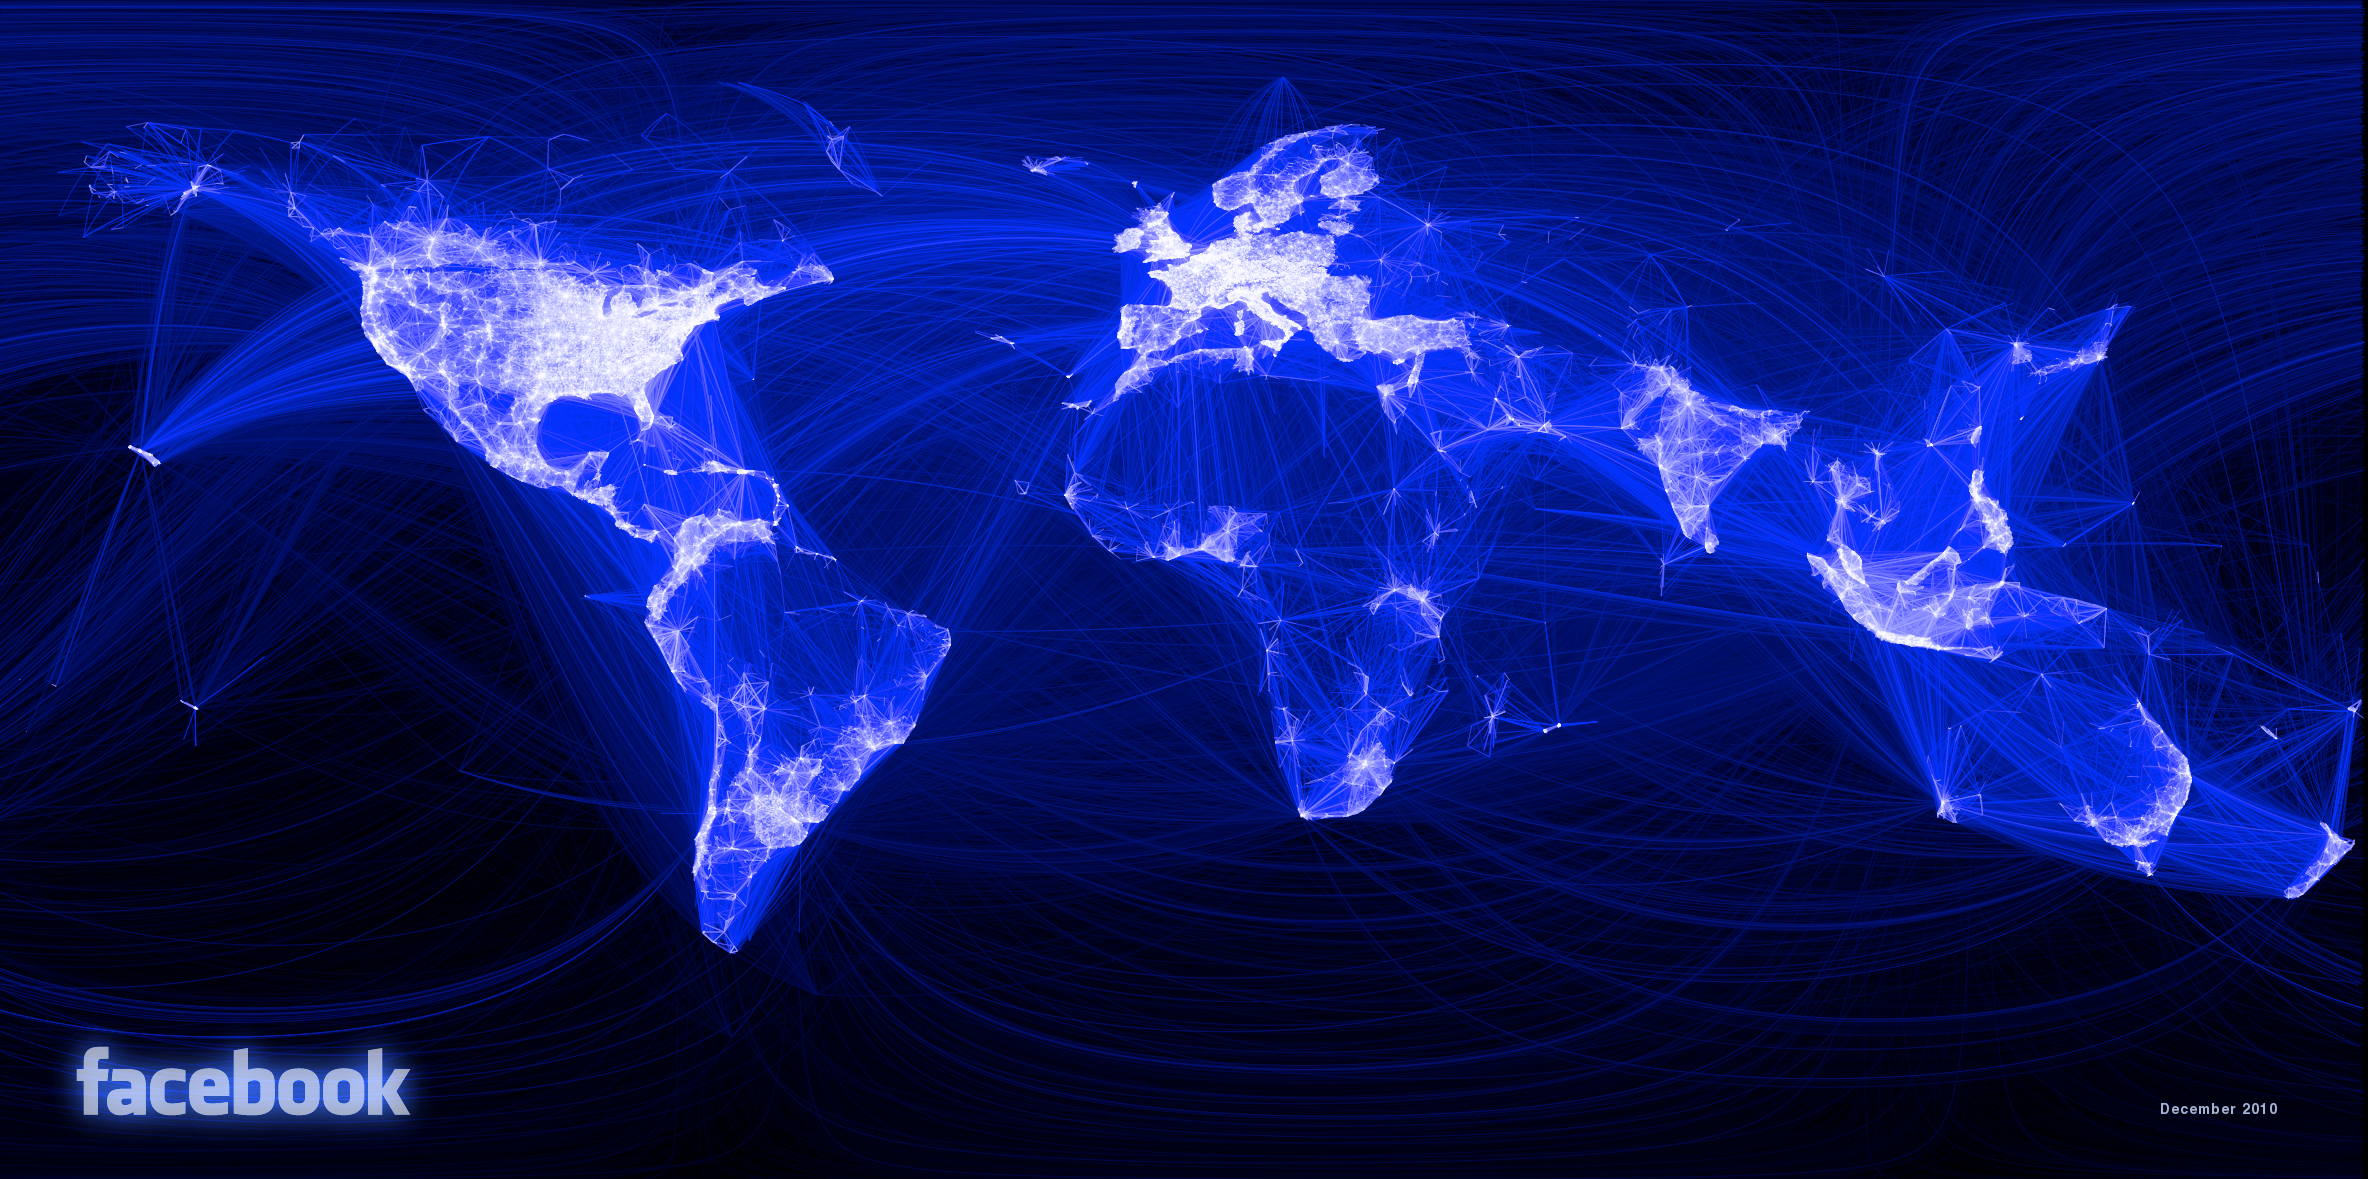
Visualizing Friendships
Paul Butler / Facebook
Vitra Design Museum Collection
Voices from the Front Lines
Voronoi Diagrams
Various
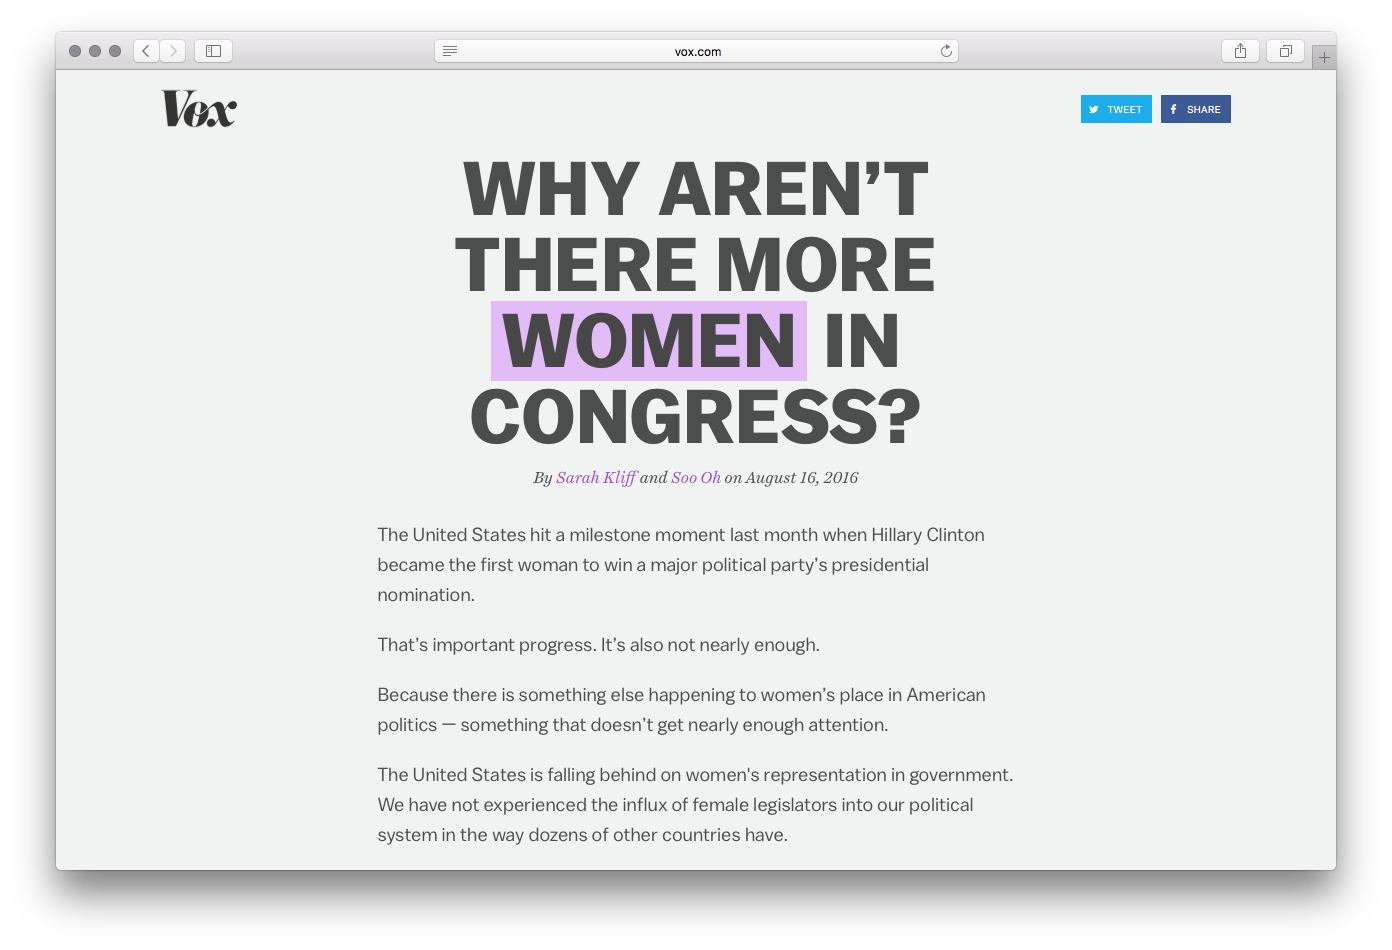
Vox Interactives
Vox Media
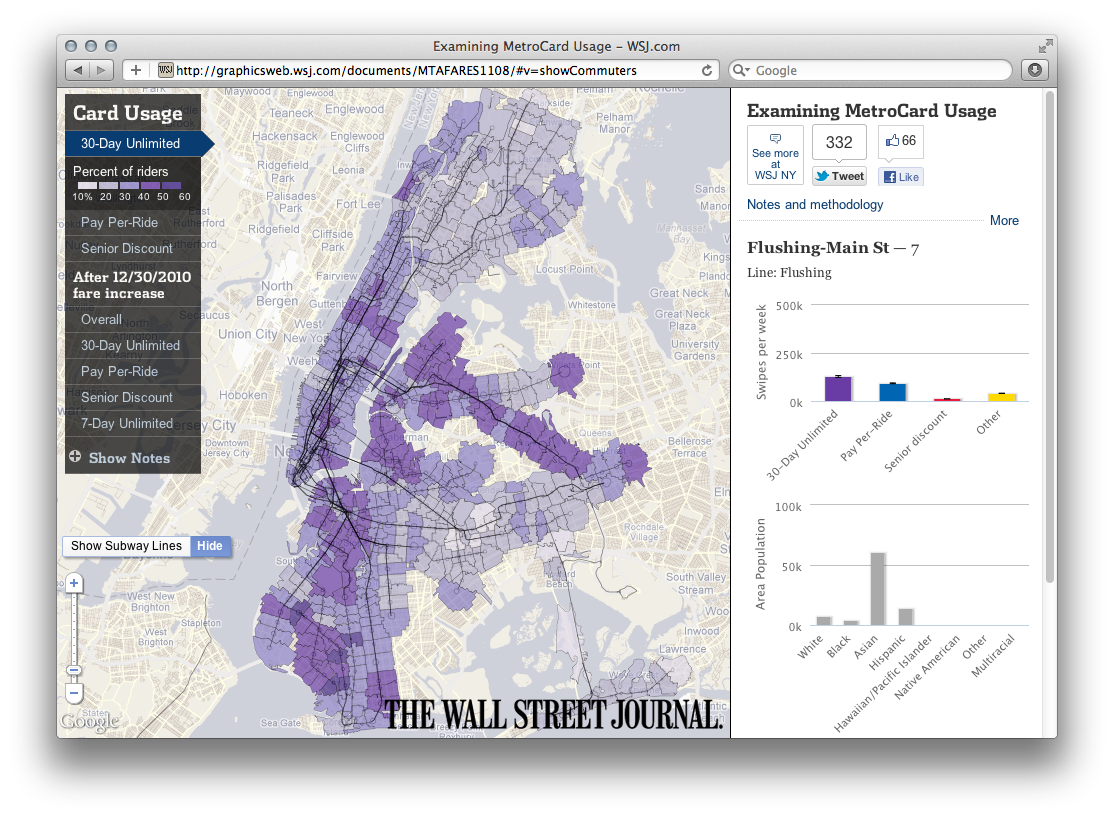
Wall Street Journal Graphics
Wall Street Journal
Walrus Graph Visualization
CAIDA
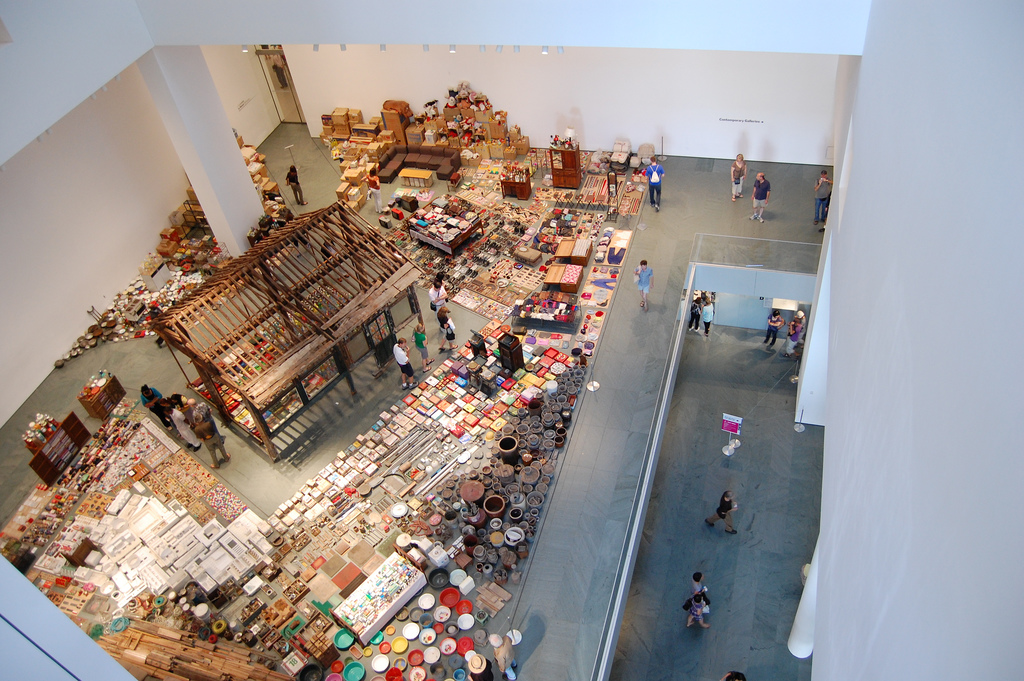
Waste Not
Song Dong
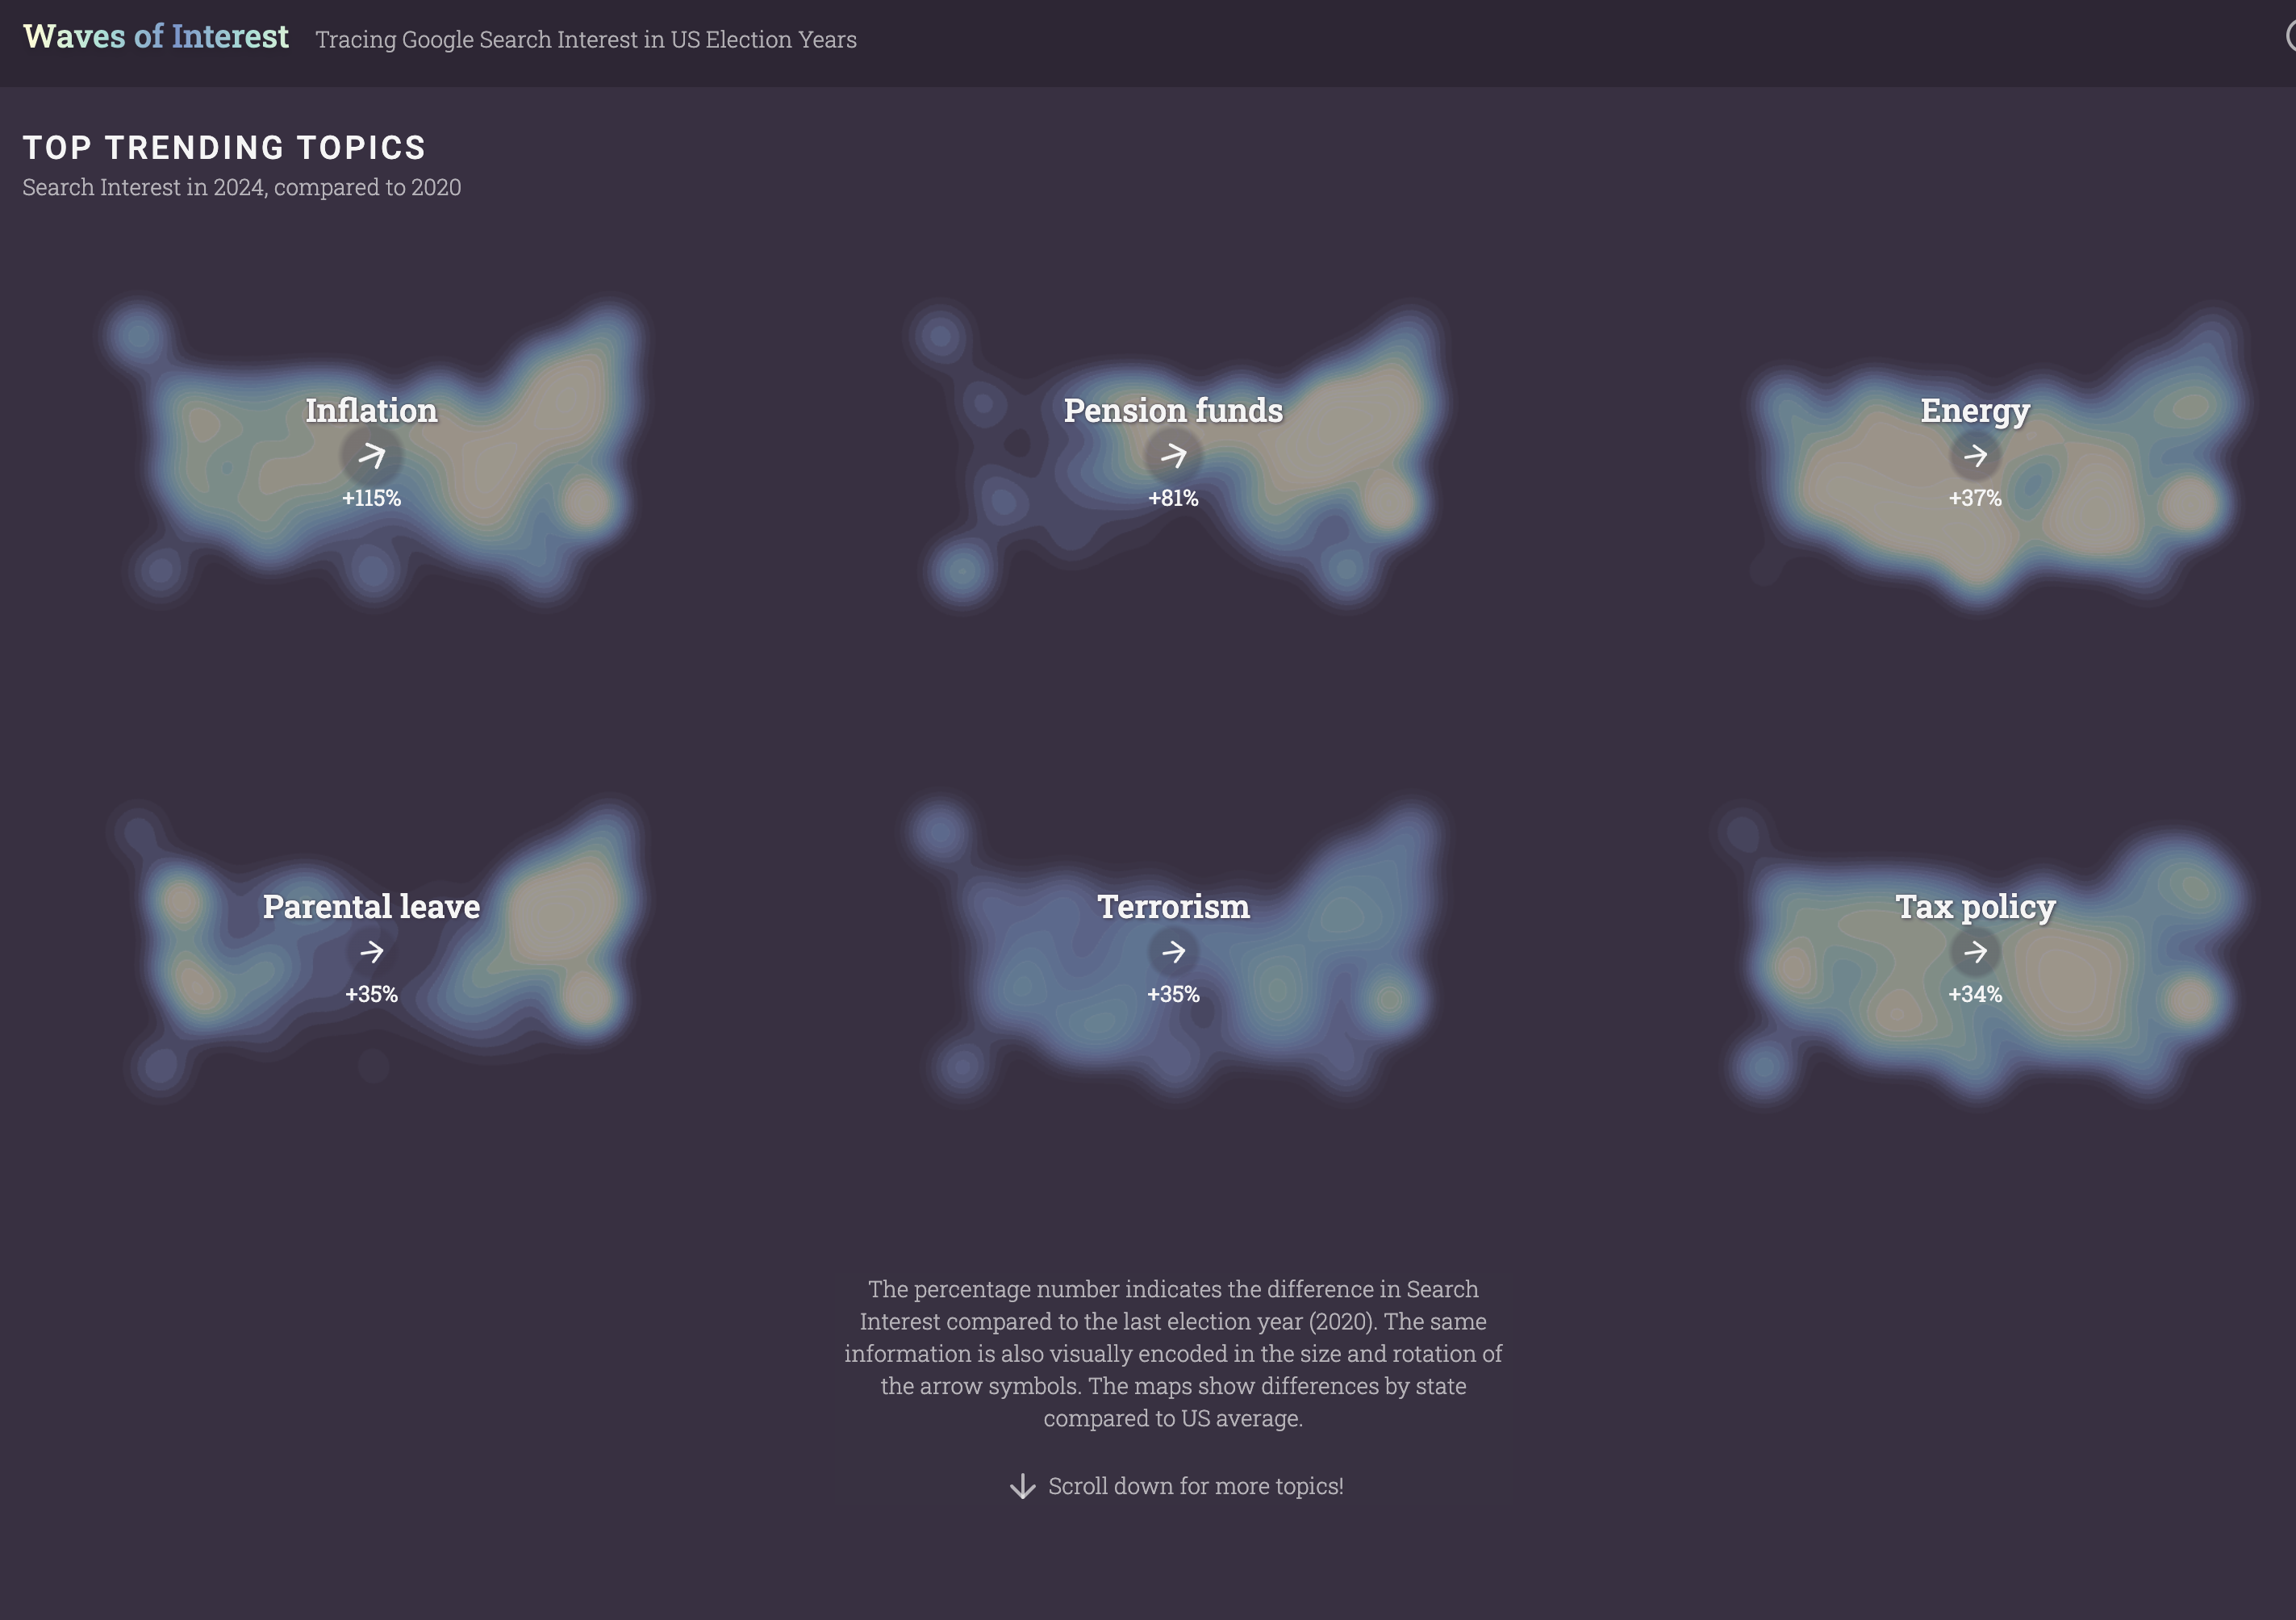
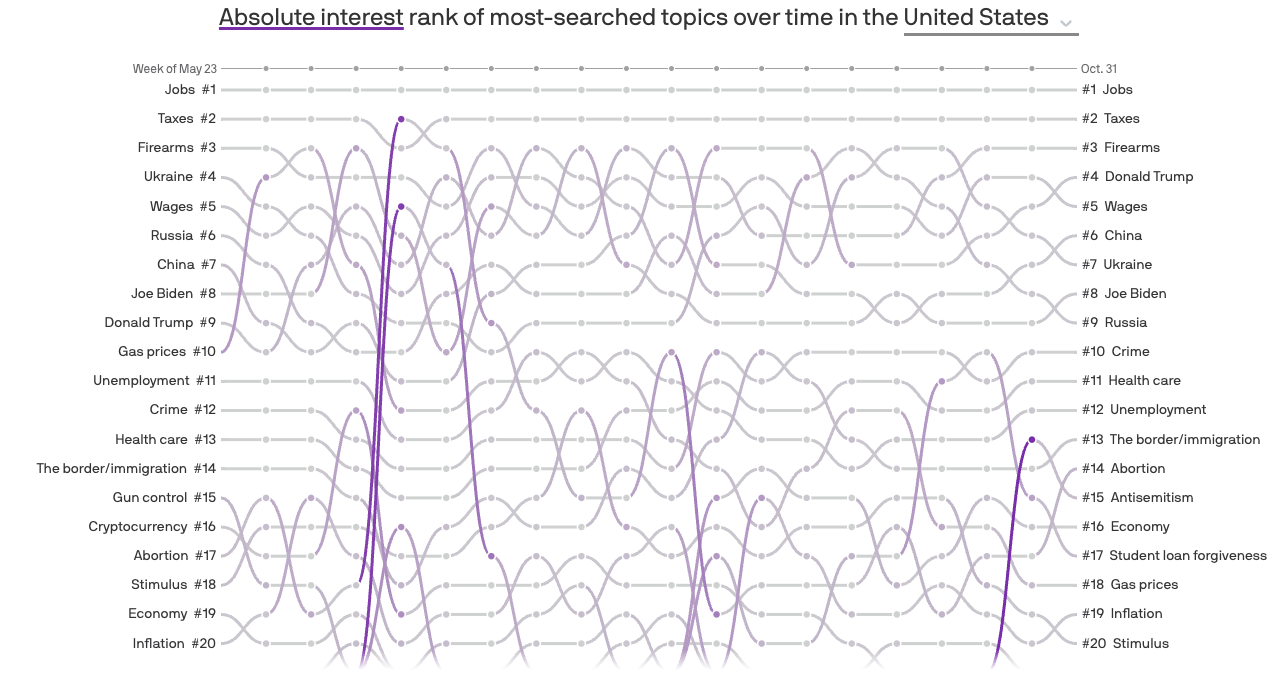
Waves of Interest
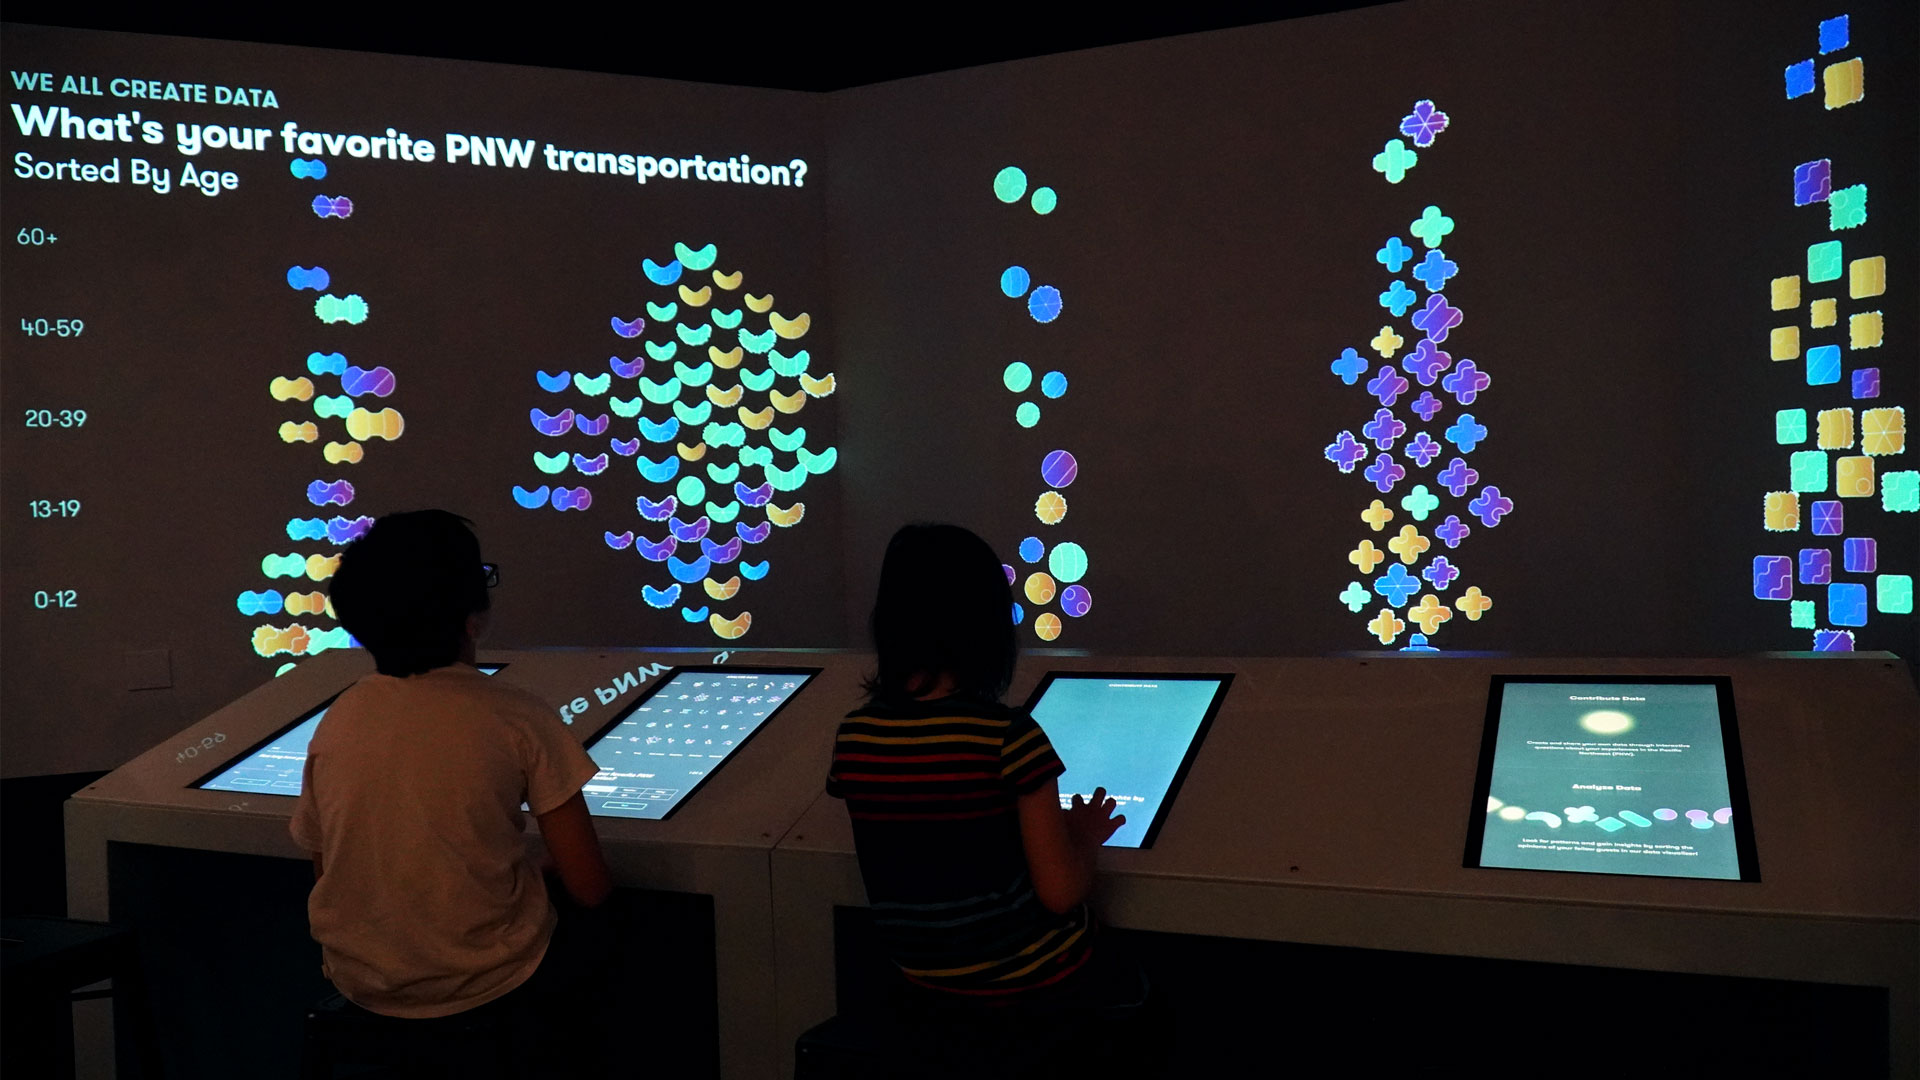
We Are Data Pacific Science Center Installation
Schema Design
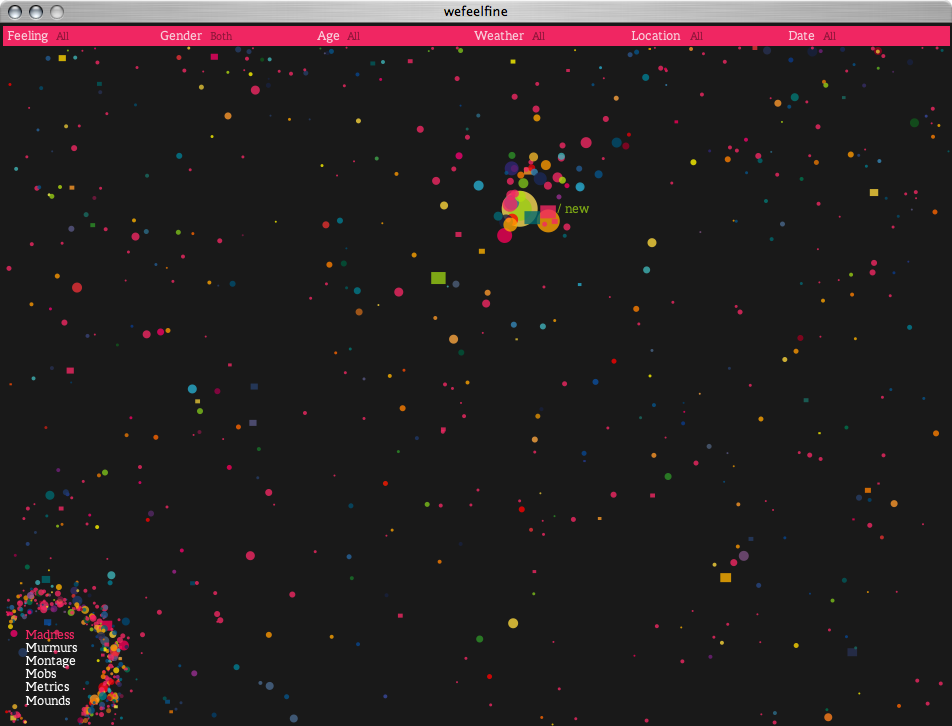
We Feel Fine
Jonathan Harris & Sep Kamvar
We Need to Tackle Five Grand Challenges
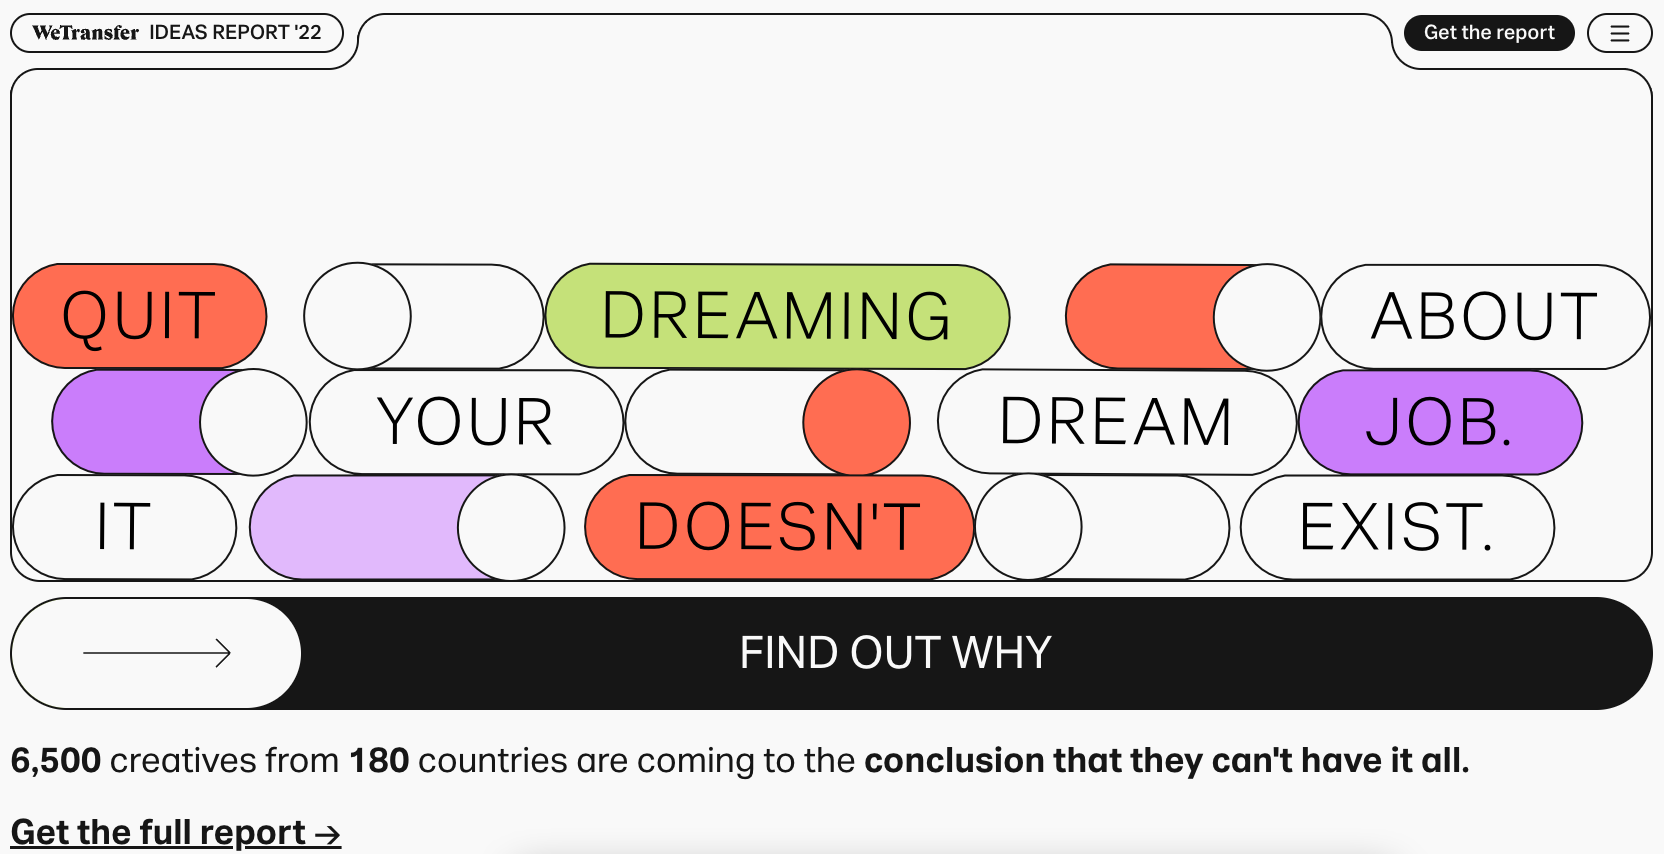
We Transfer Ideas Report 2022
Weapons of Mass Injustice
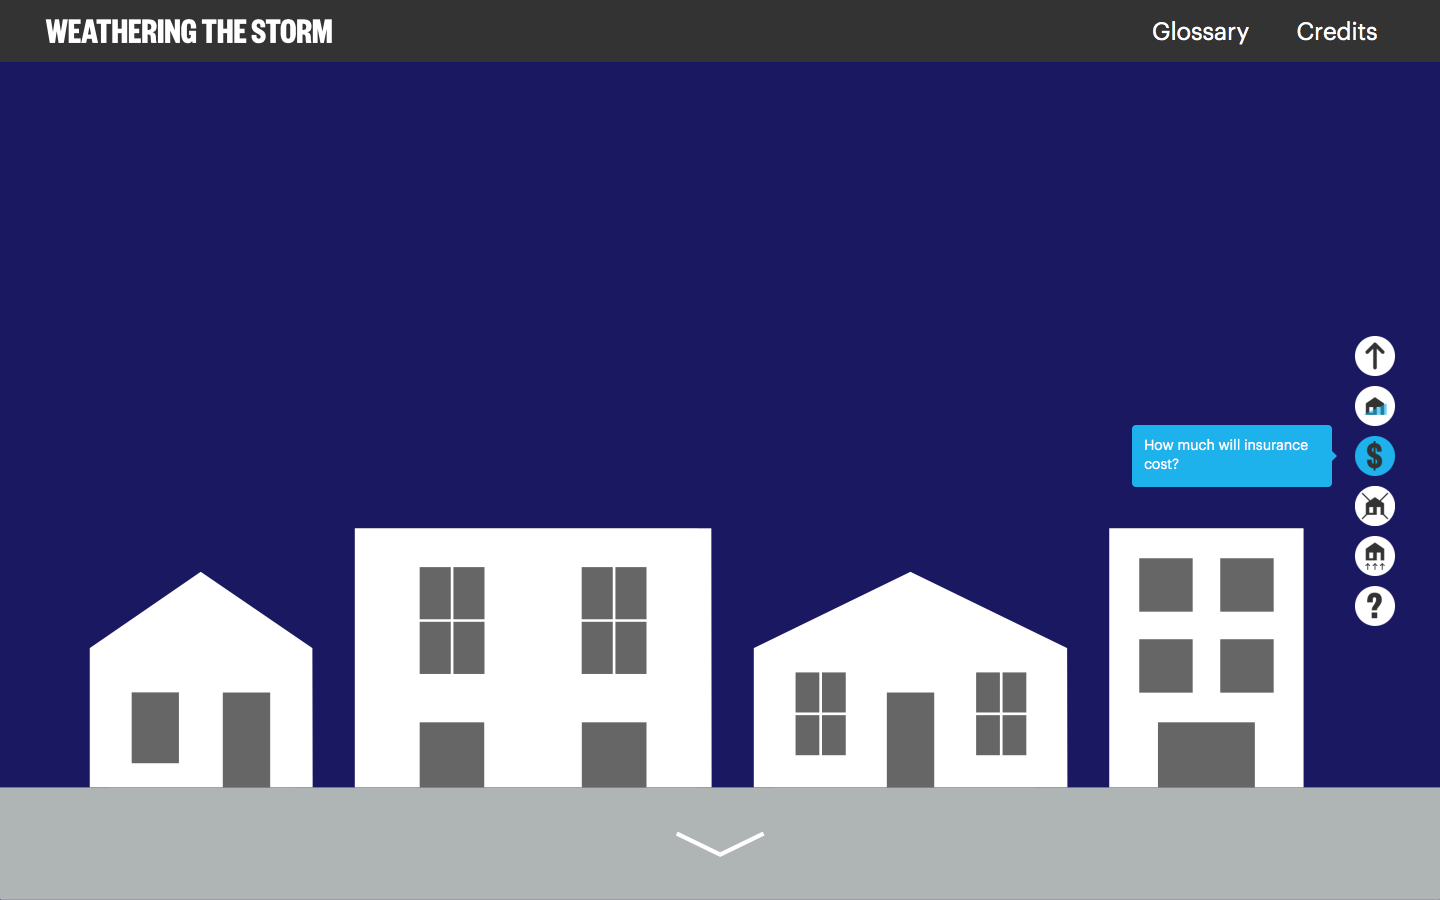
Weathering the Storm (Cup Flood Insurance Infographic)
Schema Design
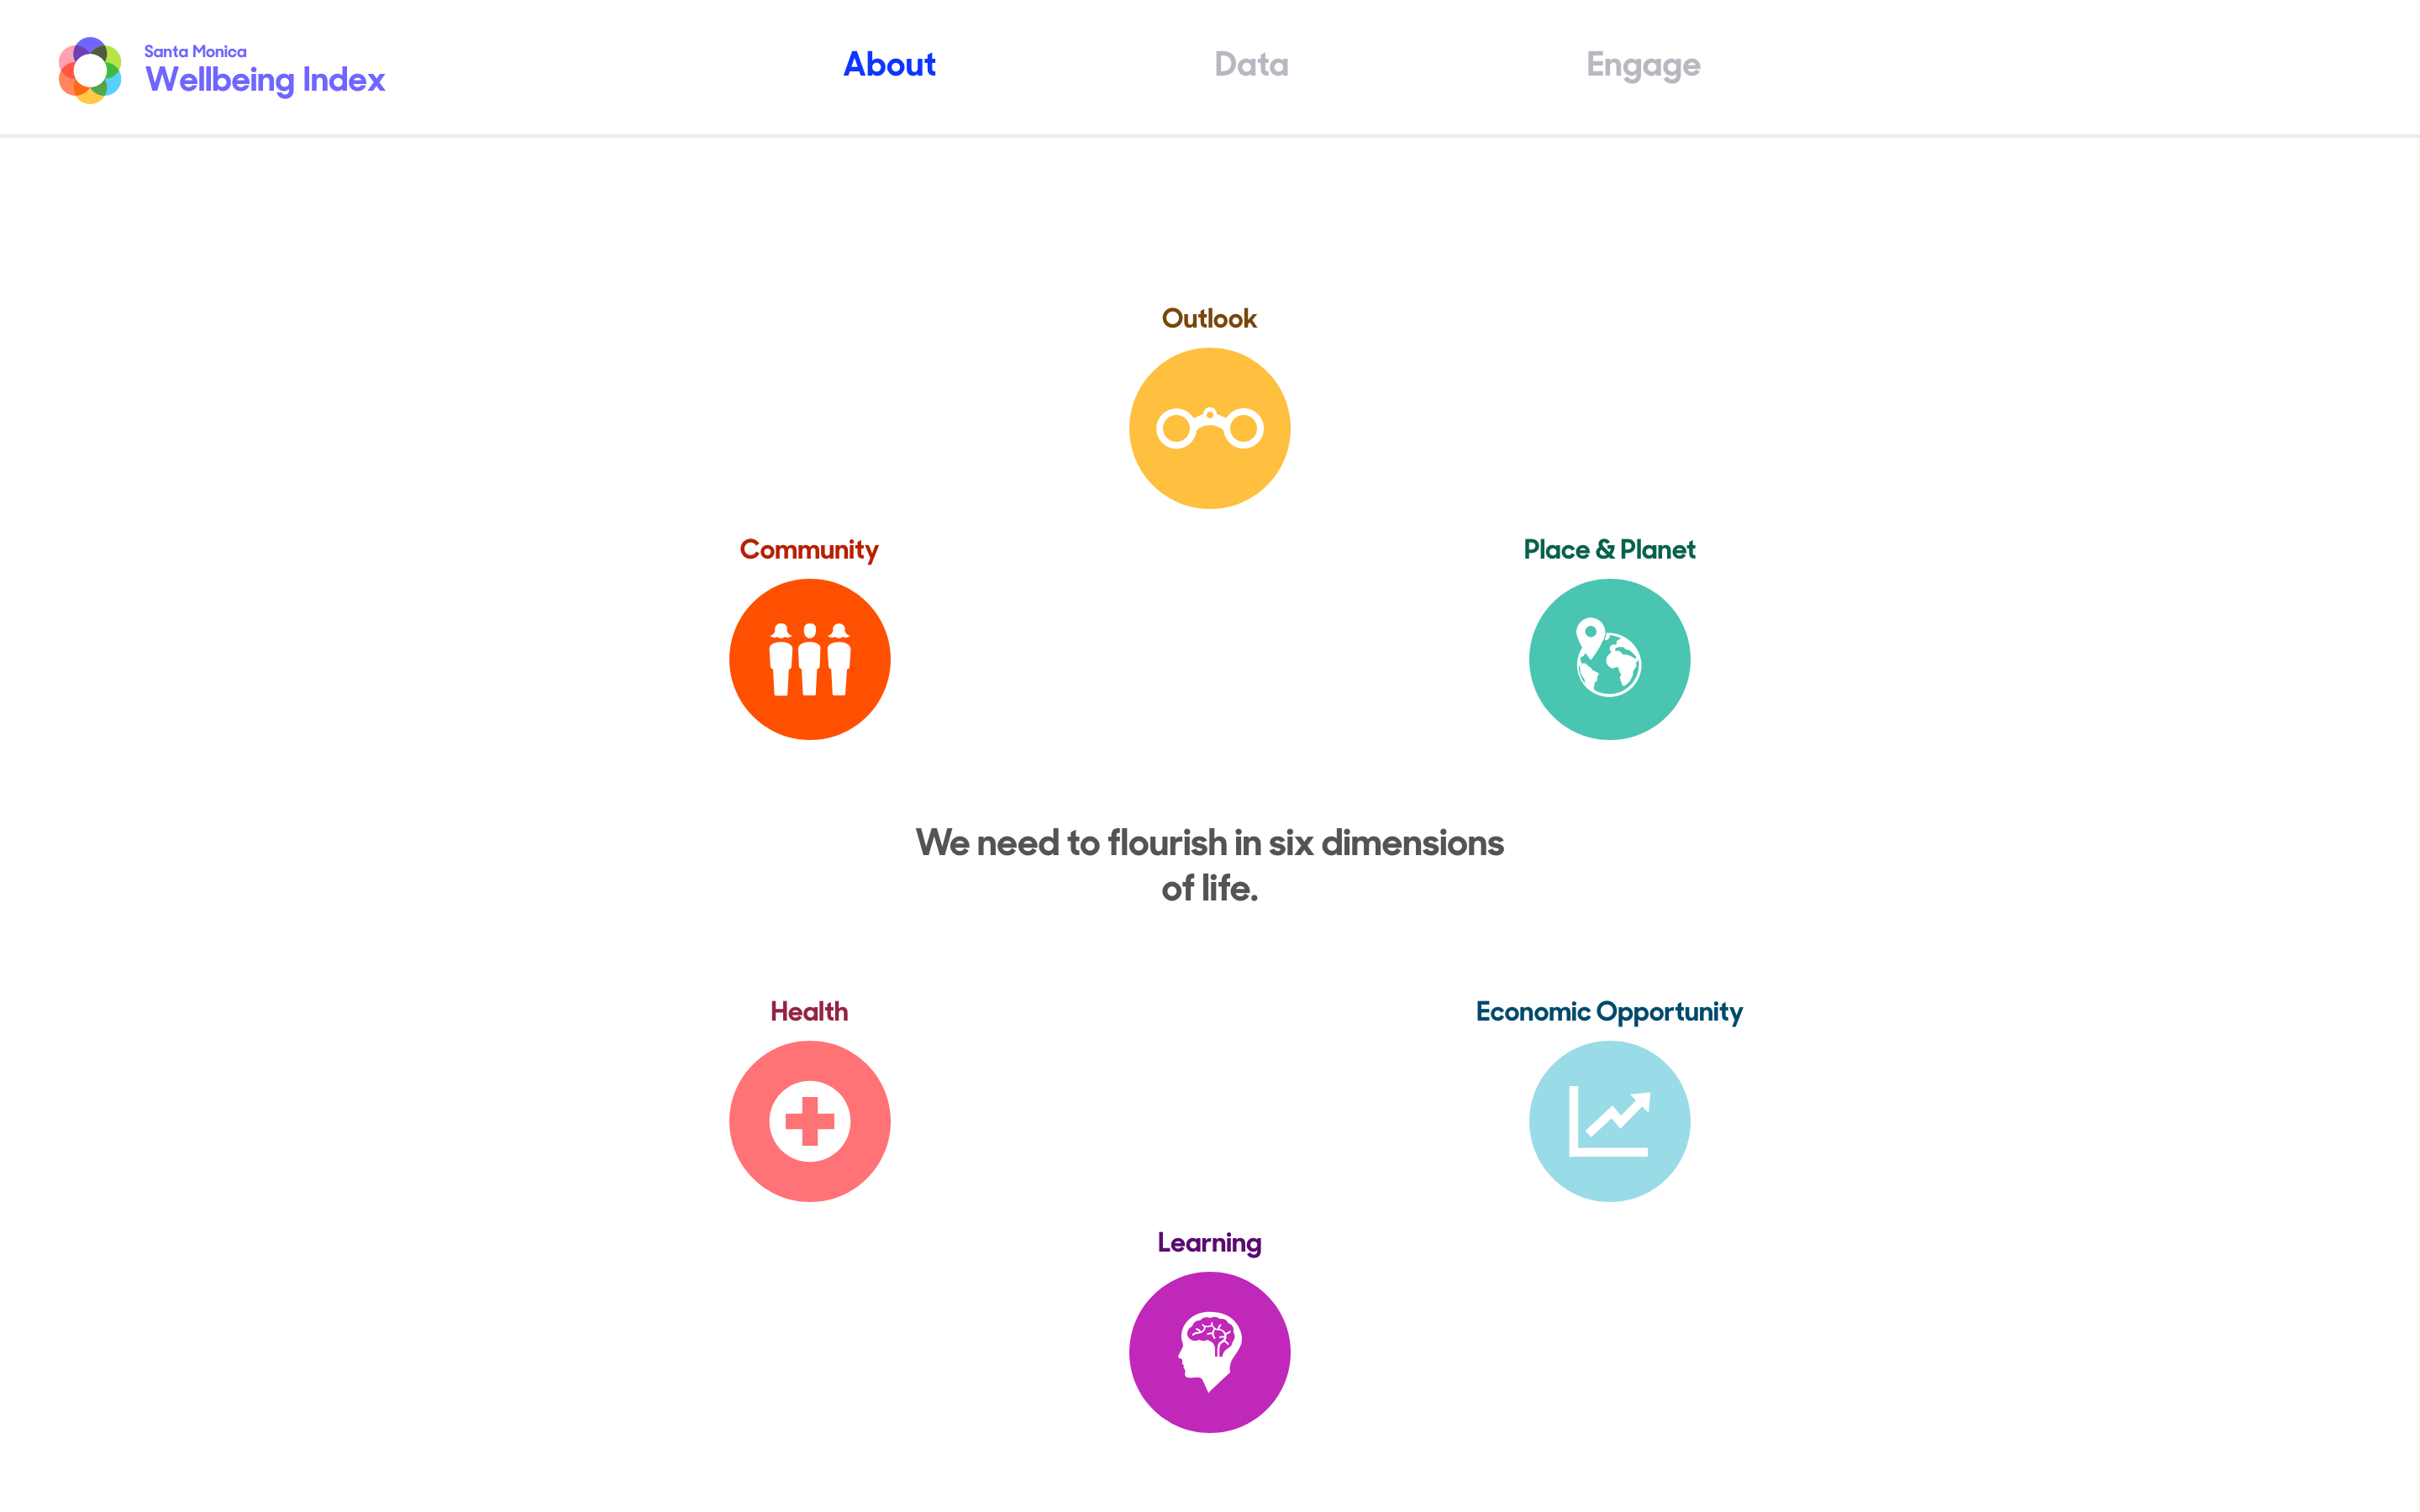
Wellbeing Index
Schema Design

Wellbeing Summit
Schema Design
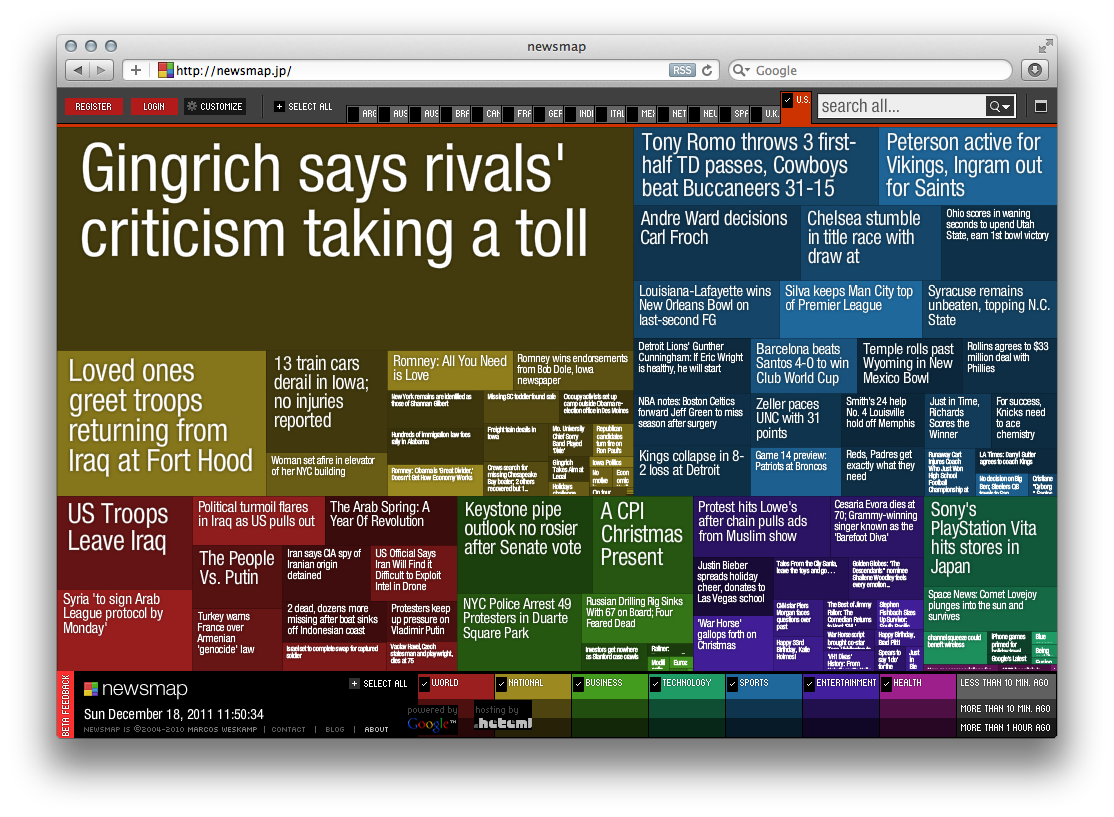
Weskamp Newsmap
Marcos Weskamp
Wetransfer Ideas Report 2021
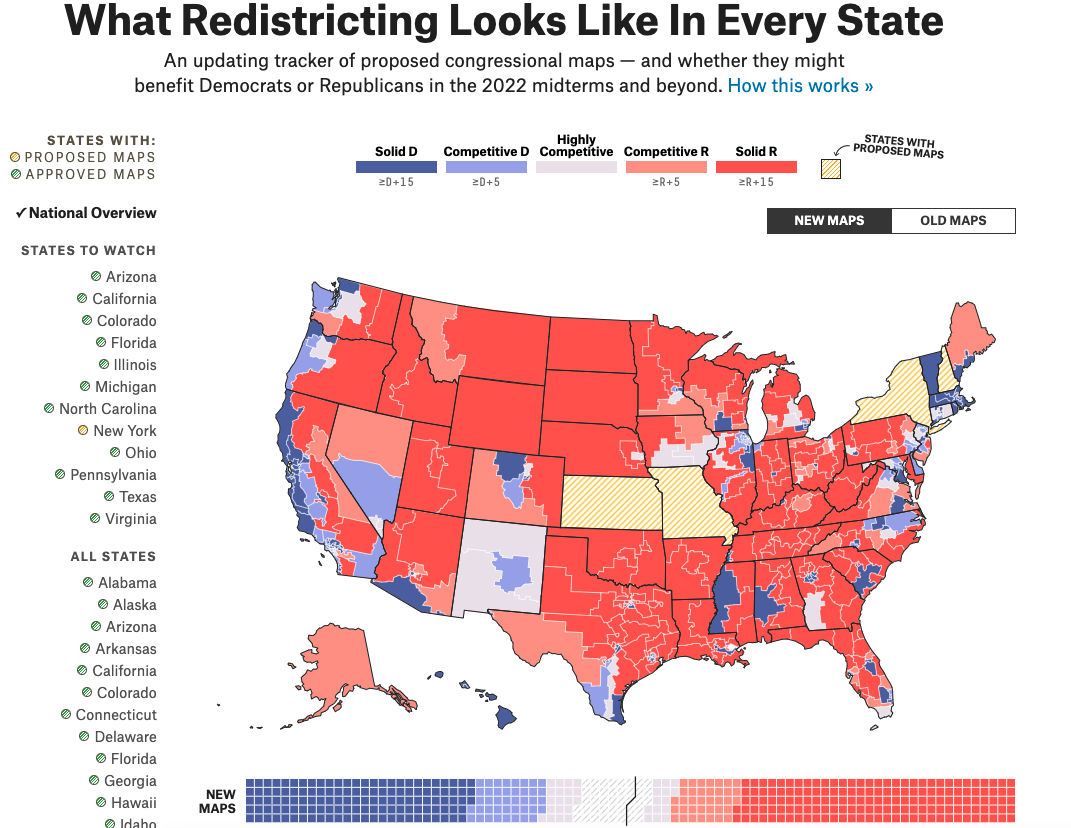
What Redistricting Looks Like for Every State, 538
538
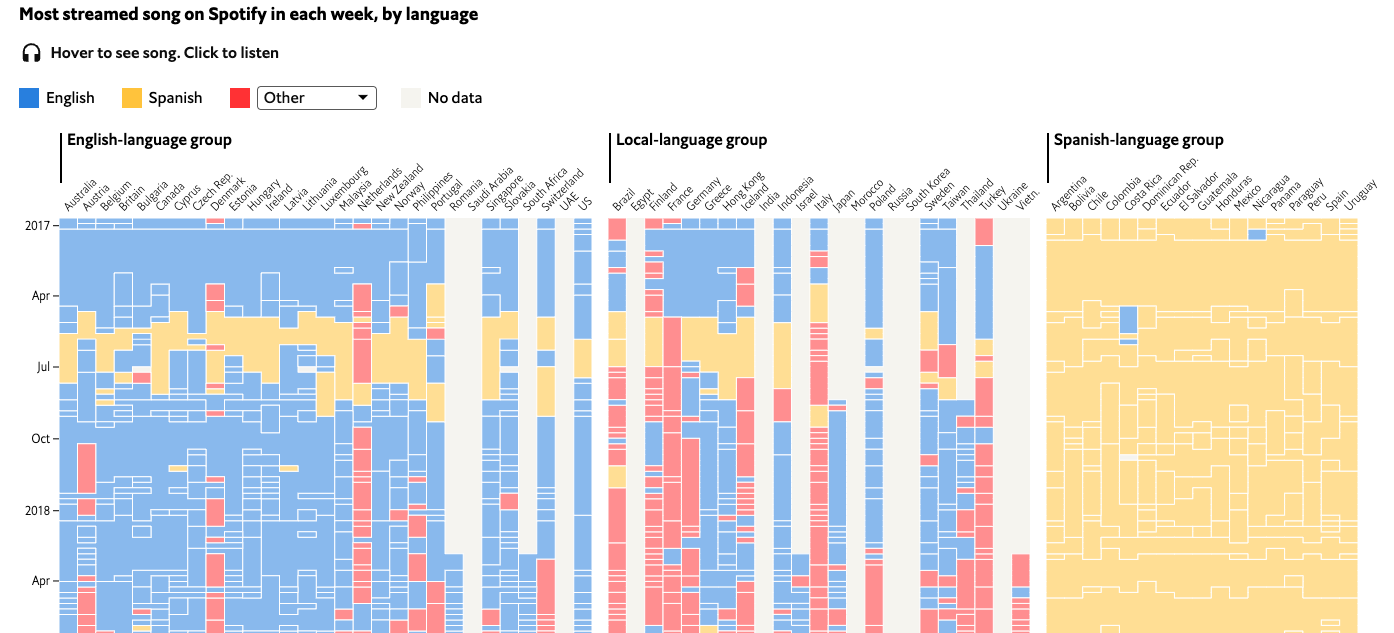
What Spotify Data Show About the Decline of English
Economist

What the Democratic Presidential Candidates Care About, in 44,000 Tweets
Bloomberg
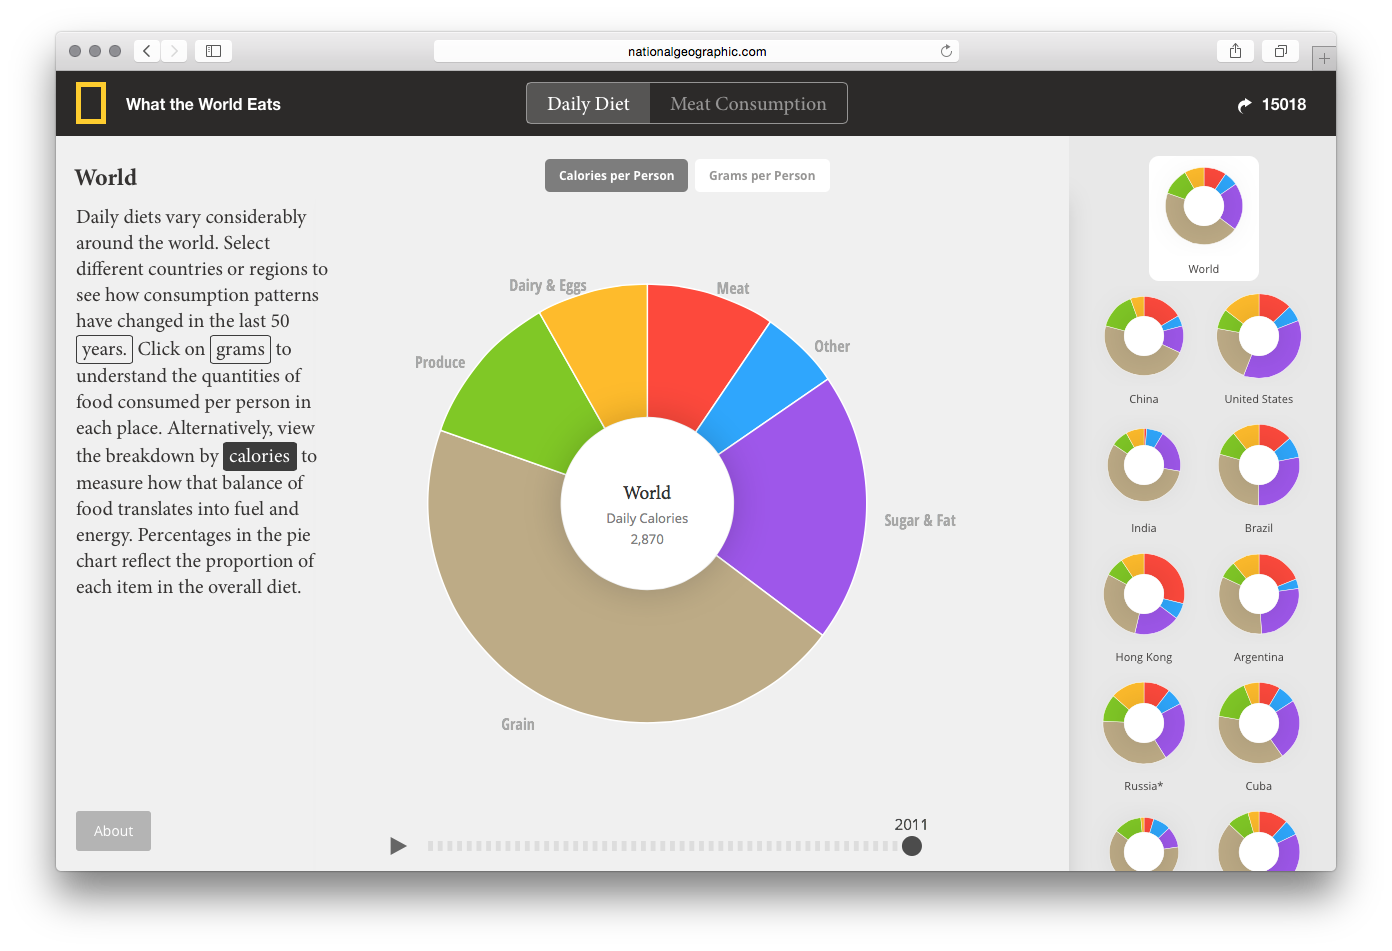
What the World Eats
Fathom Information Design
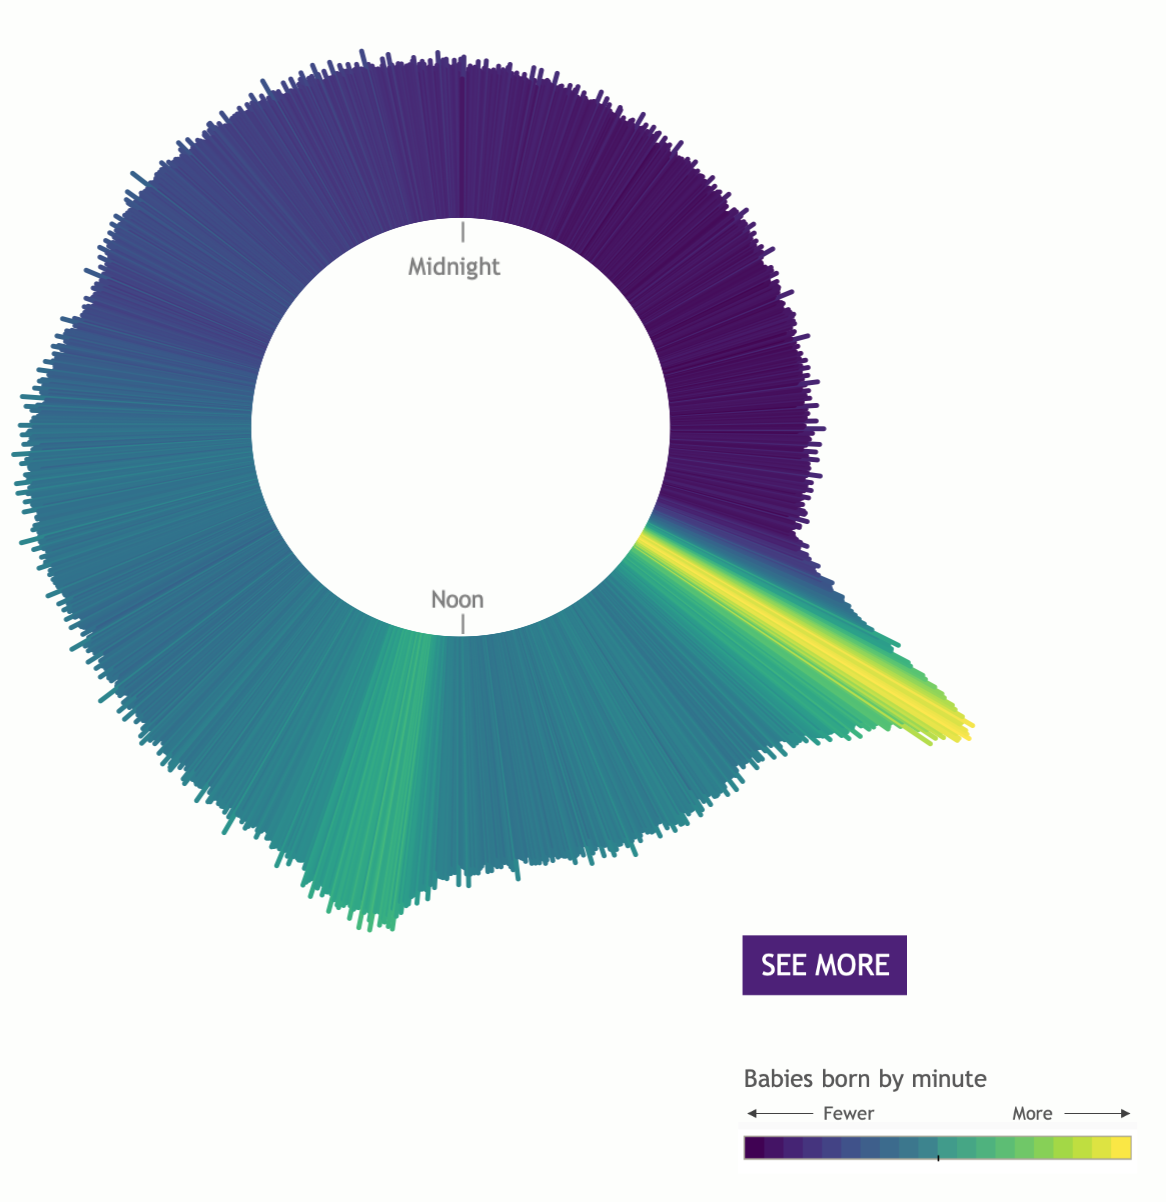
What Time Are Babies Born
What’s Driving Surging Overdose Deaths
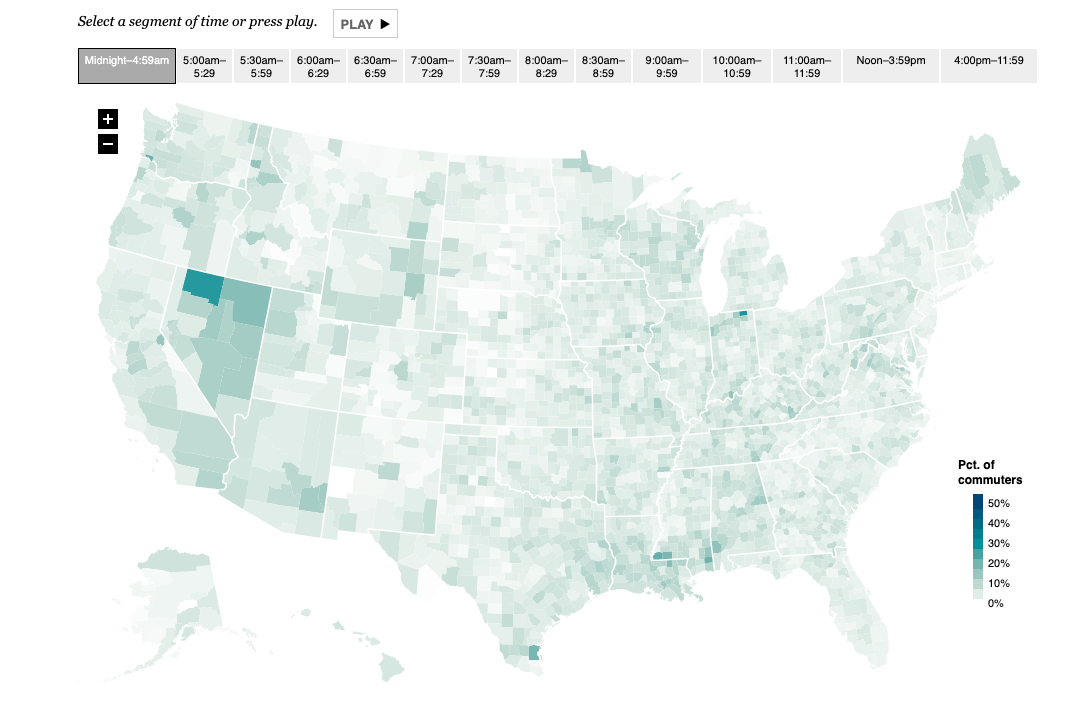
When Do Americans Leave for Work?
Flowing Data
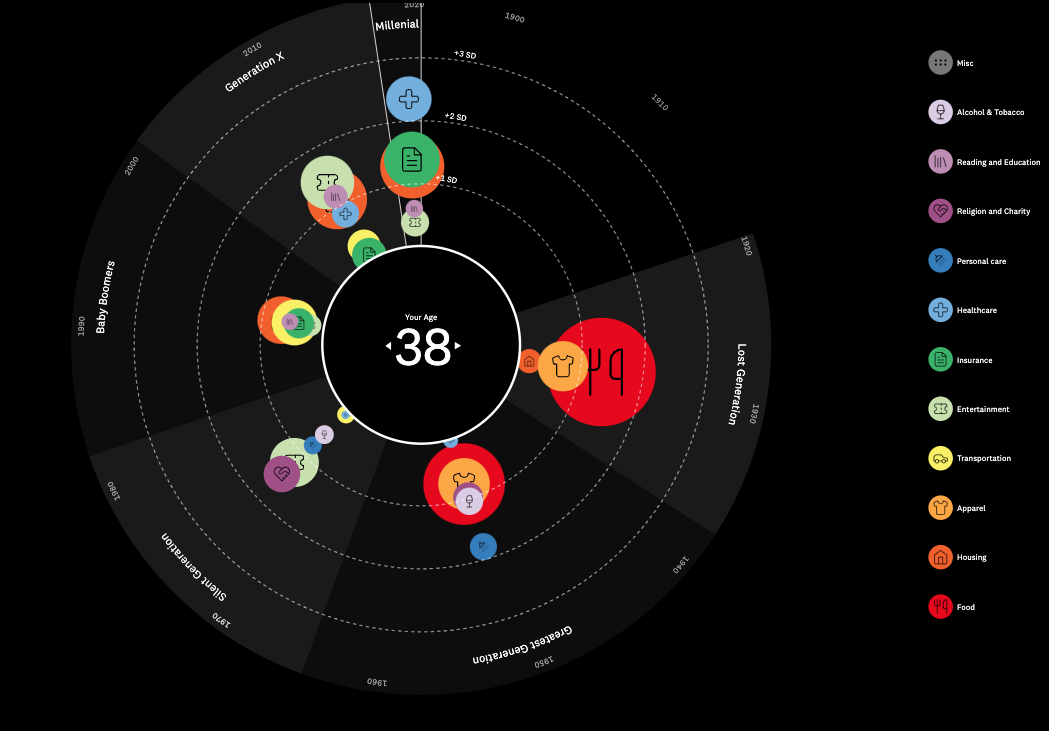
When I Was Your Age
Caprice Carstensen
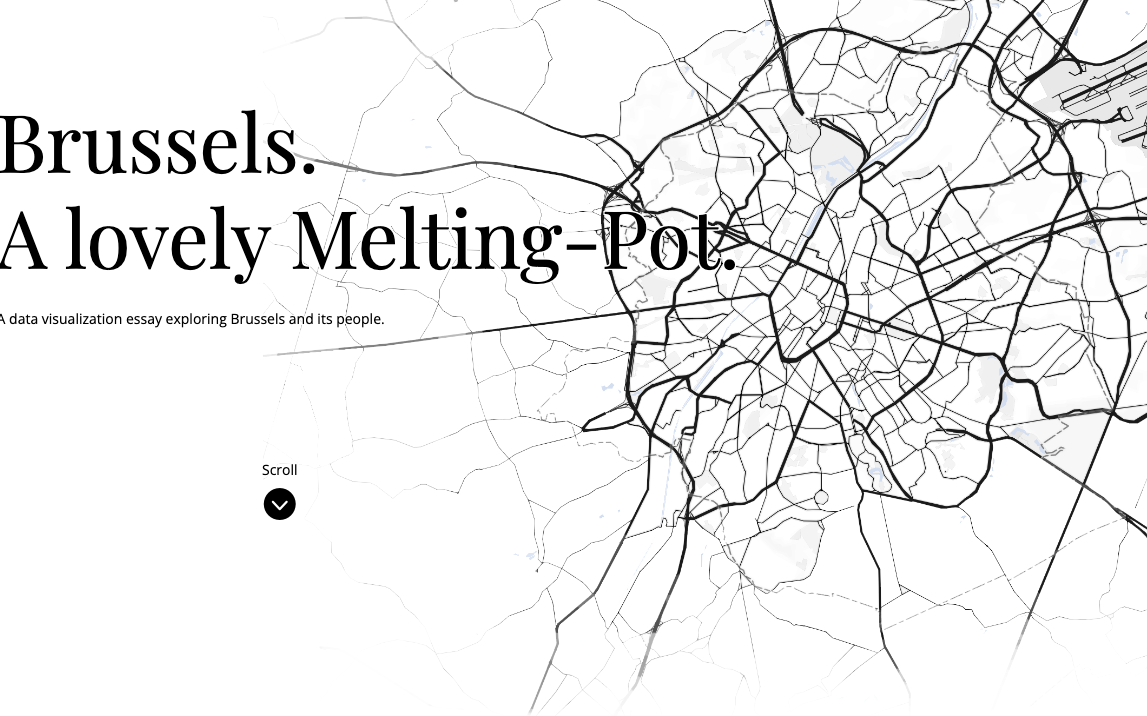
Where Do the Foreigners Living in Brussels Come from?
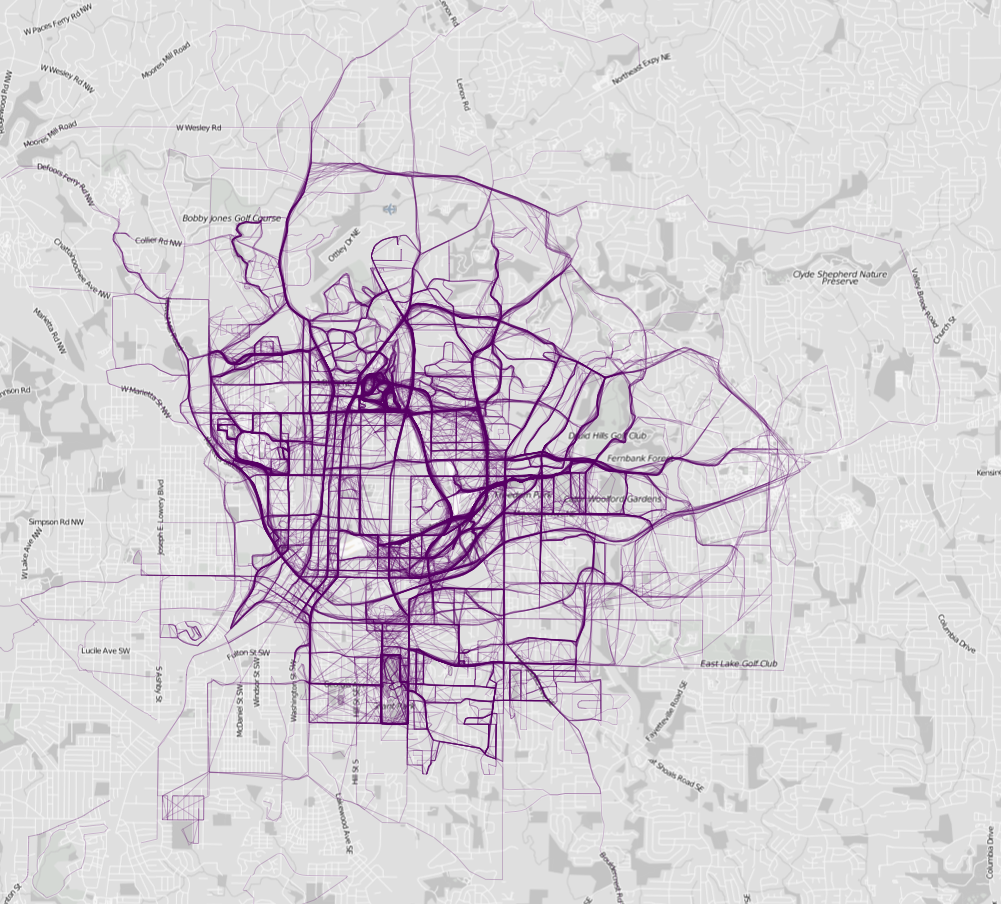
Where People Run
Nathan Yau / Flowing Data
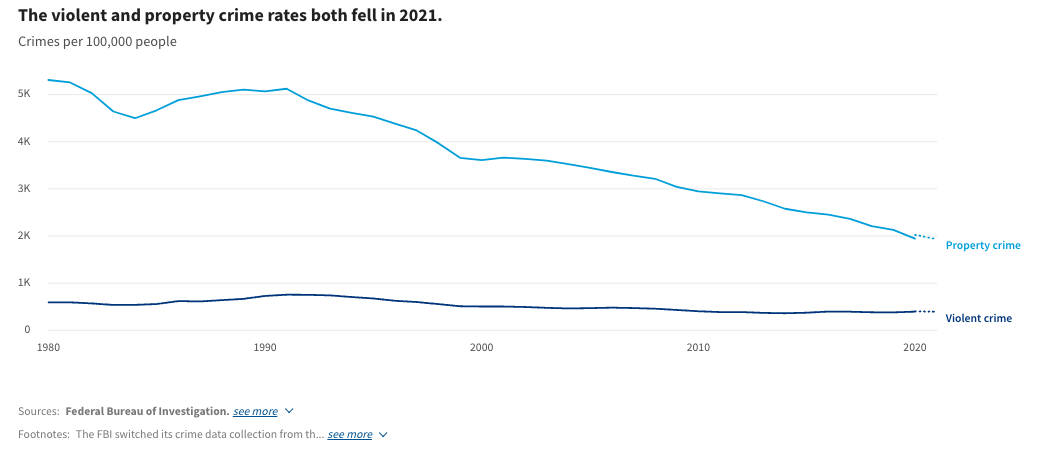
Which States Have the Least and Most Crime?
USA Facts
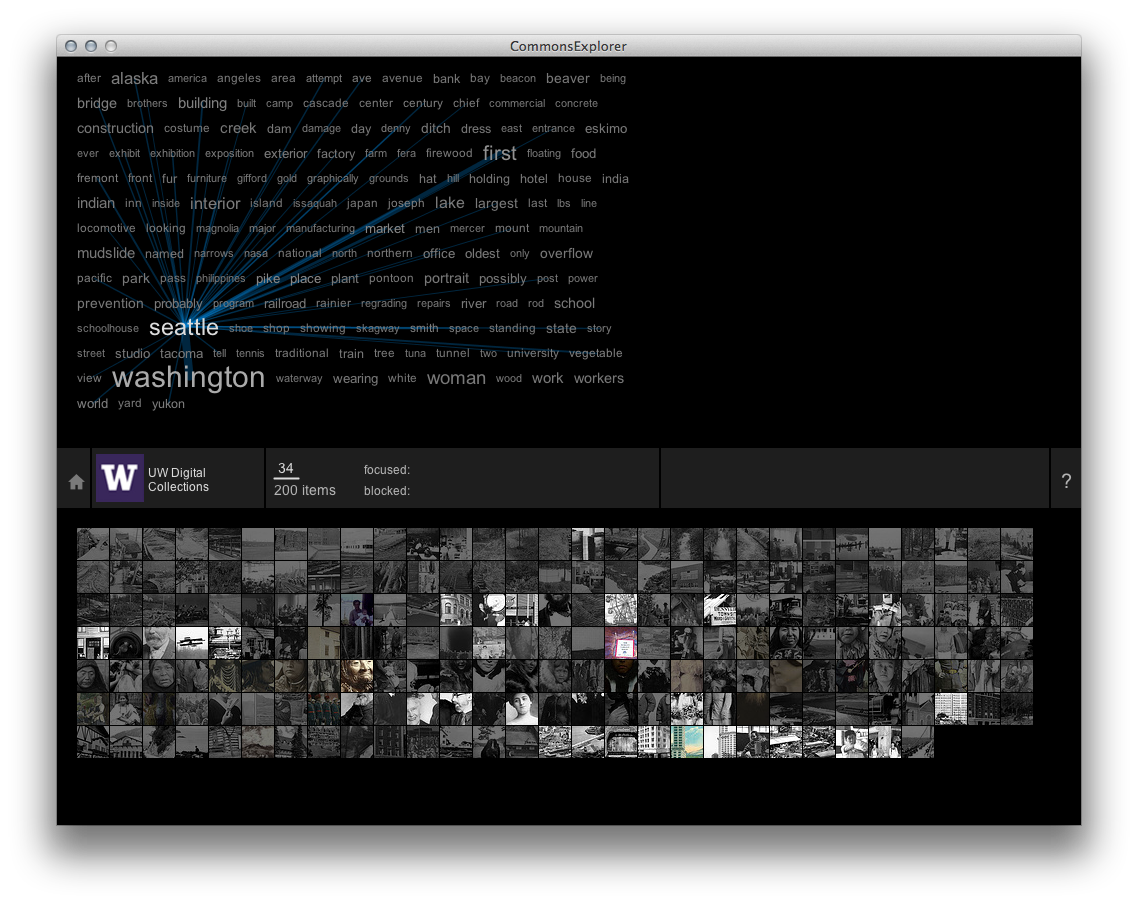
Whitelaw Commons Explorer
Mitchell Whitelaw
Whitney Landing Page
Whitney Museum
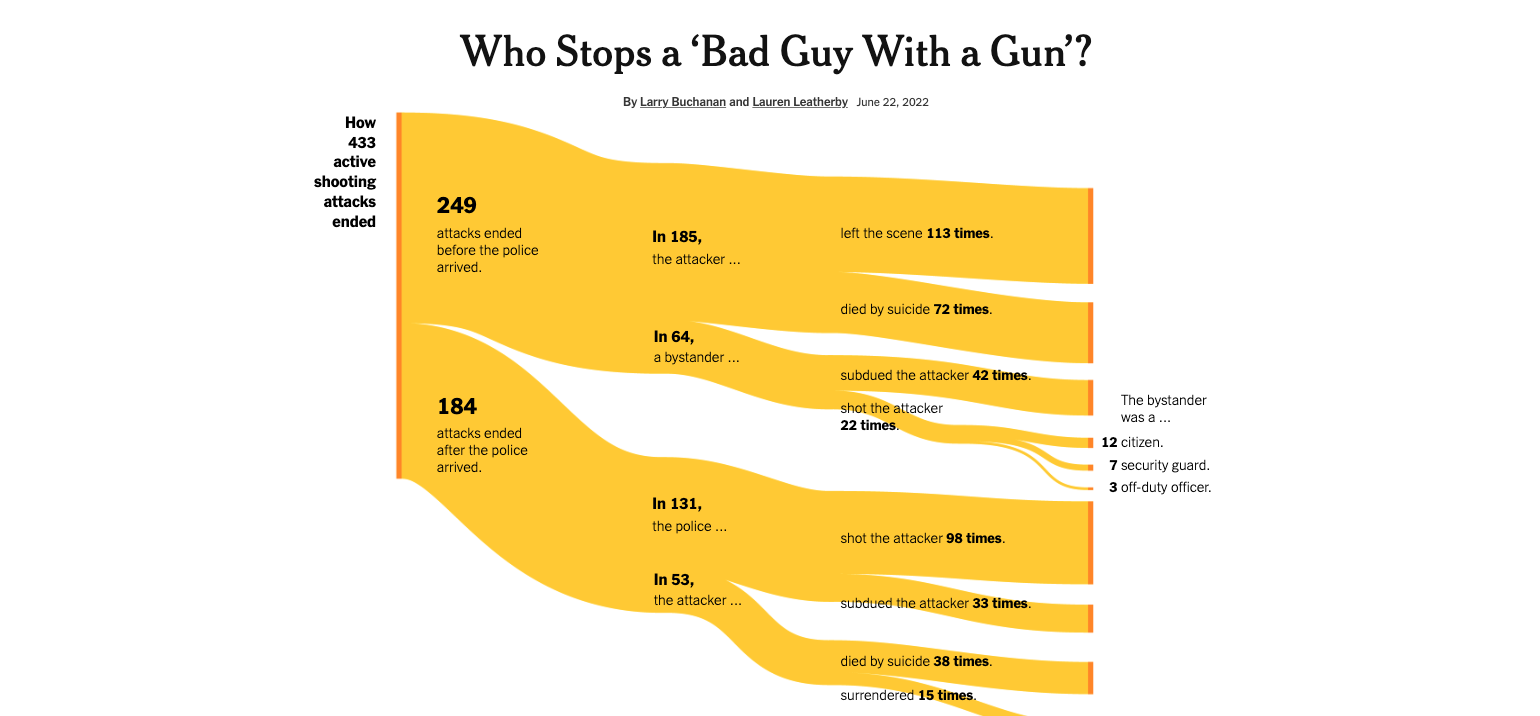
WHO Stops a ‘Bad Guy with a Gun’?
The New York Times
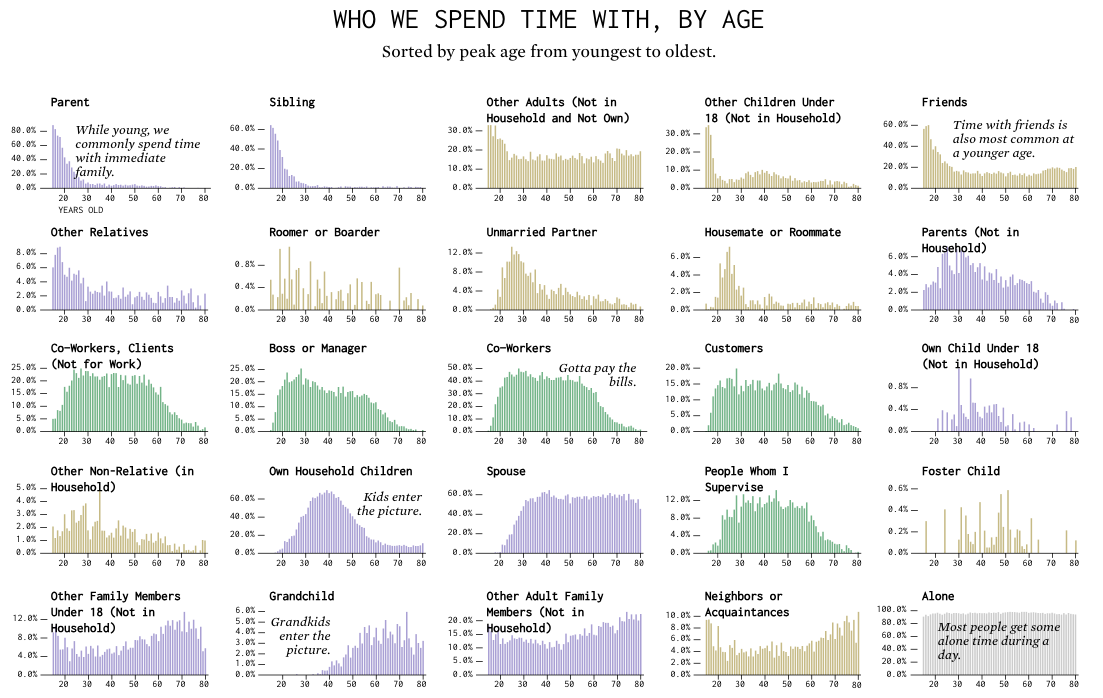
WHO We Spend Time with as We Get Older
Flowing Data
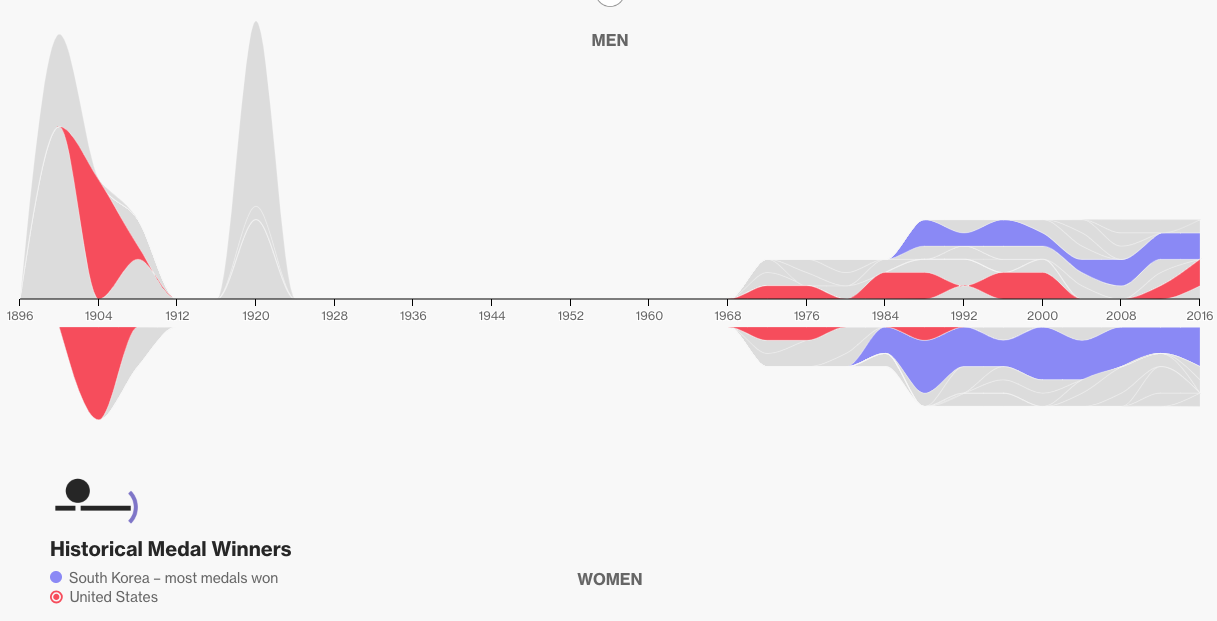
WHO Won at the Tokyo Summer Olympic Games, Bloomberg
Bloomberg
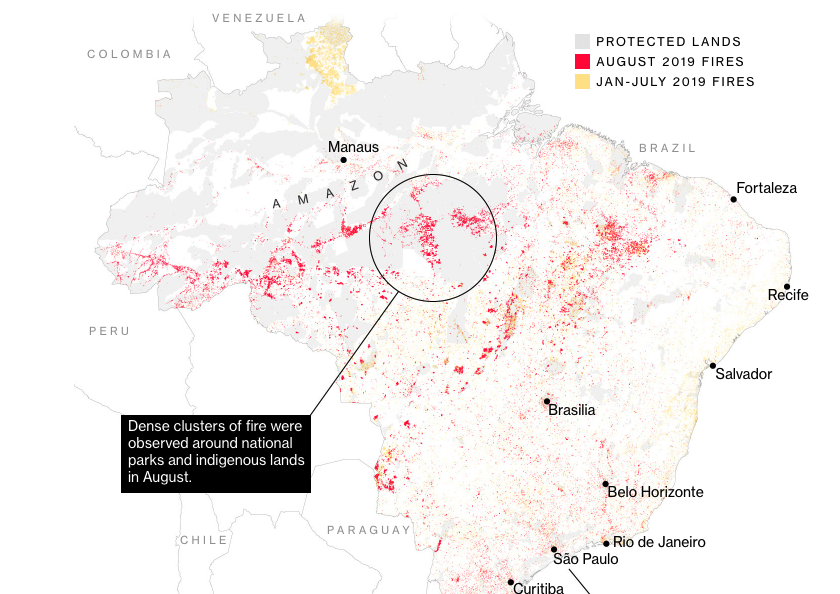
Why the Amazon Rainforest is on Fire
Bloomberg
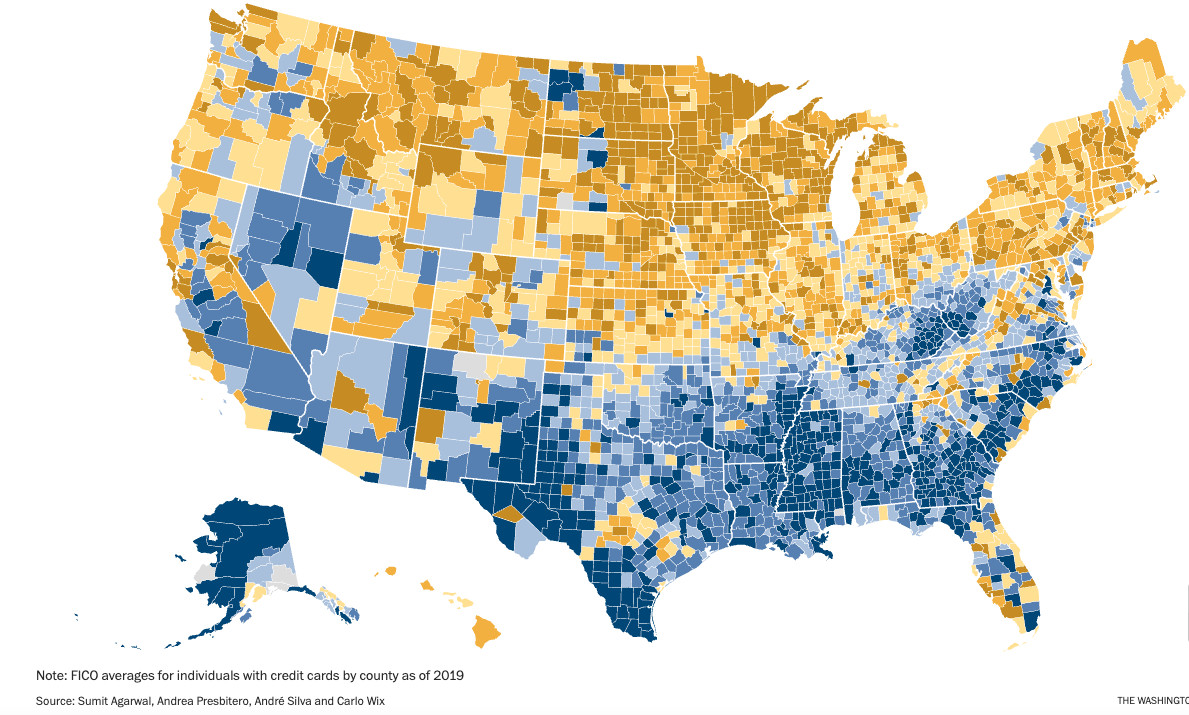
Why the South Has Such Low Credit Scores
Washington Post
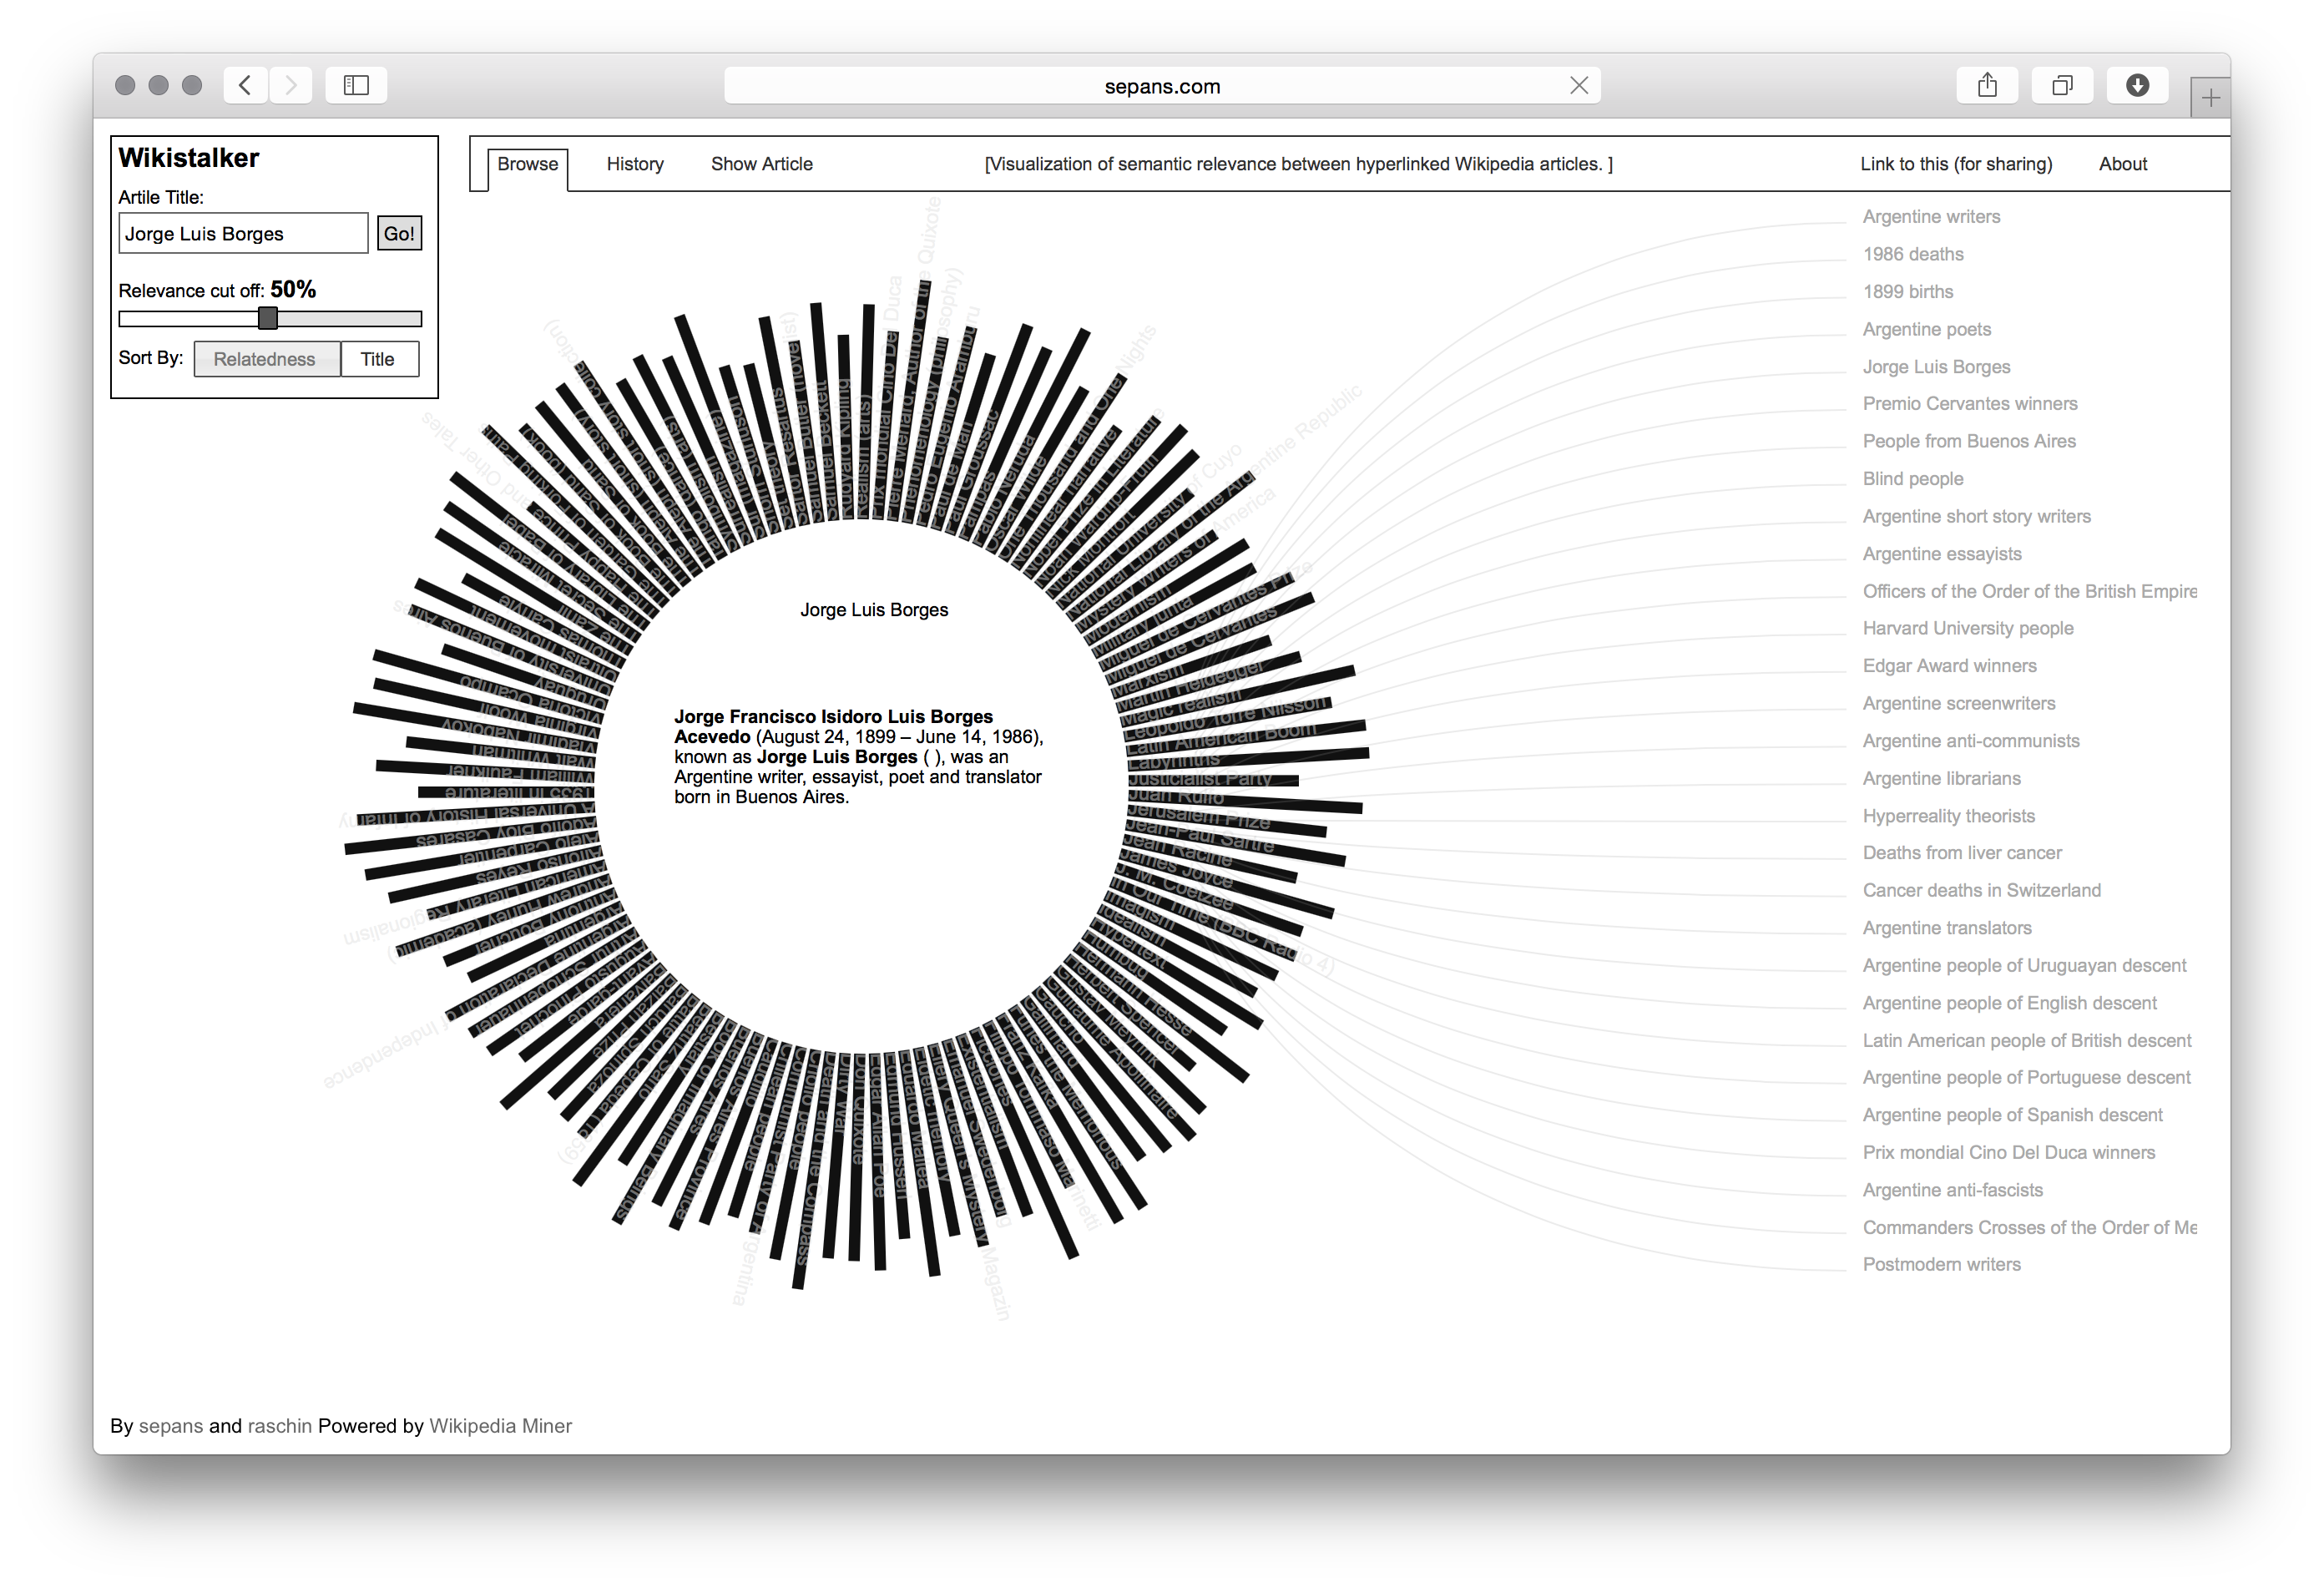
Wikistalker
Sepand Ansari & Fatemi Raschin
Wilderness International Report 2022
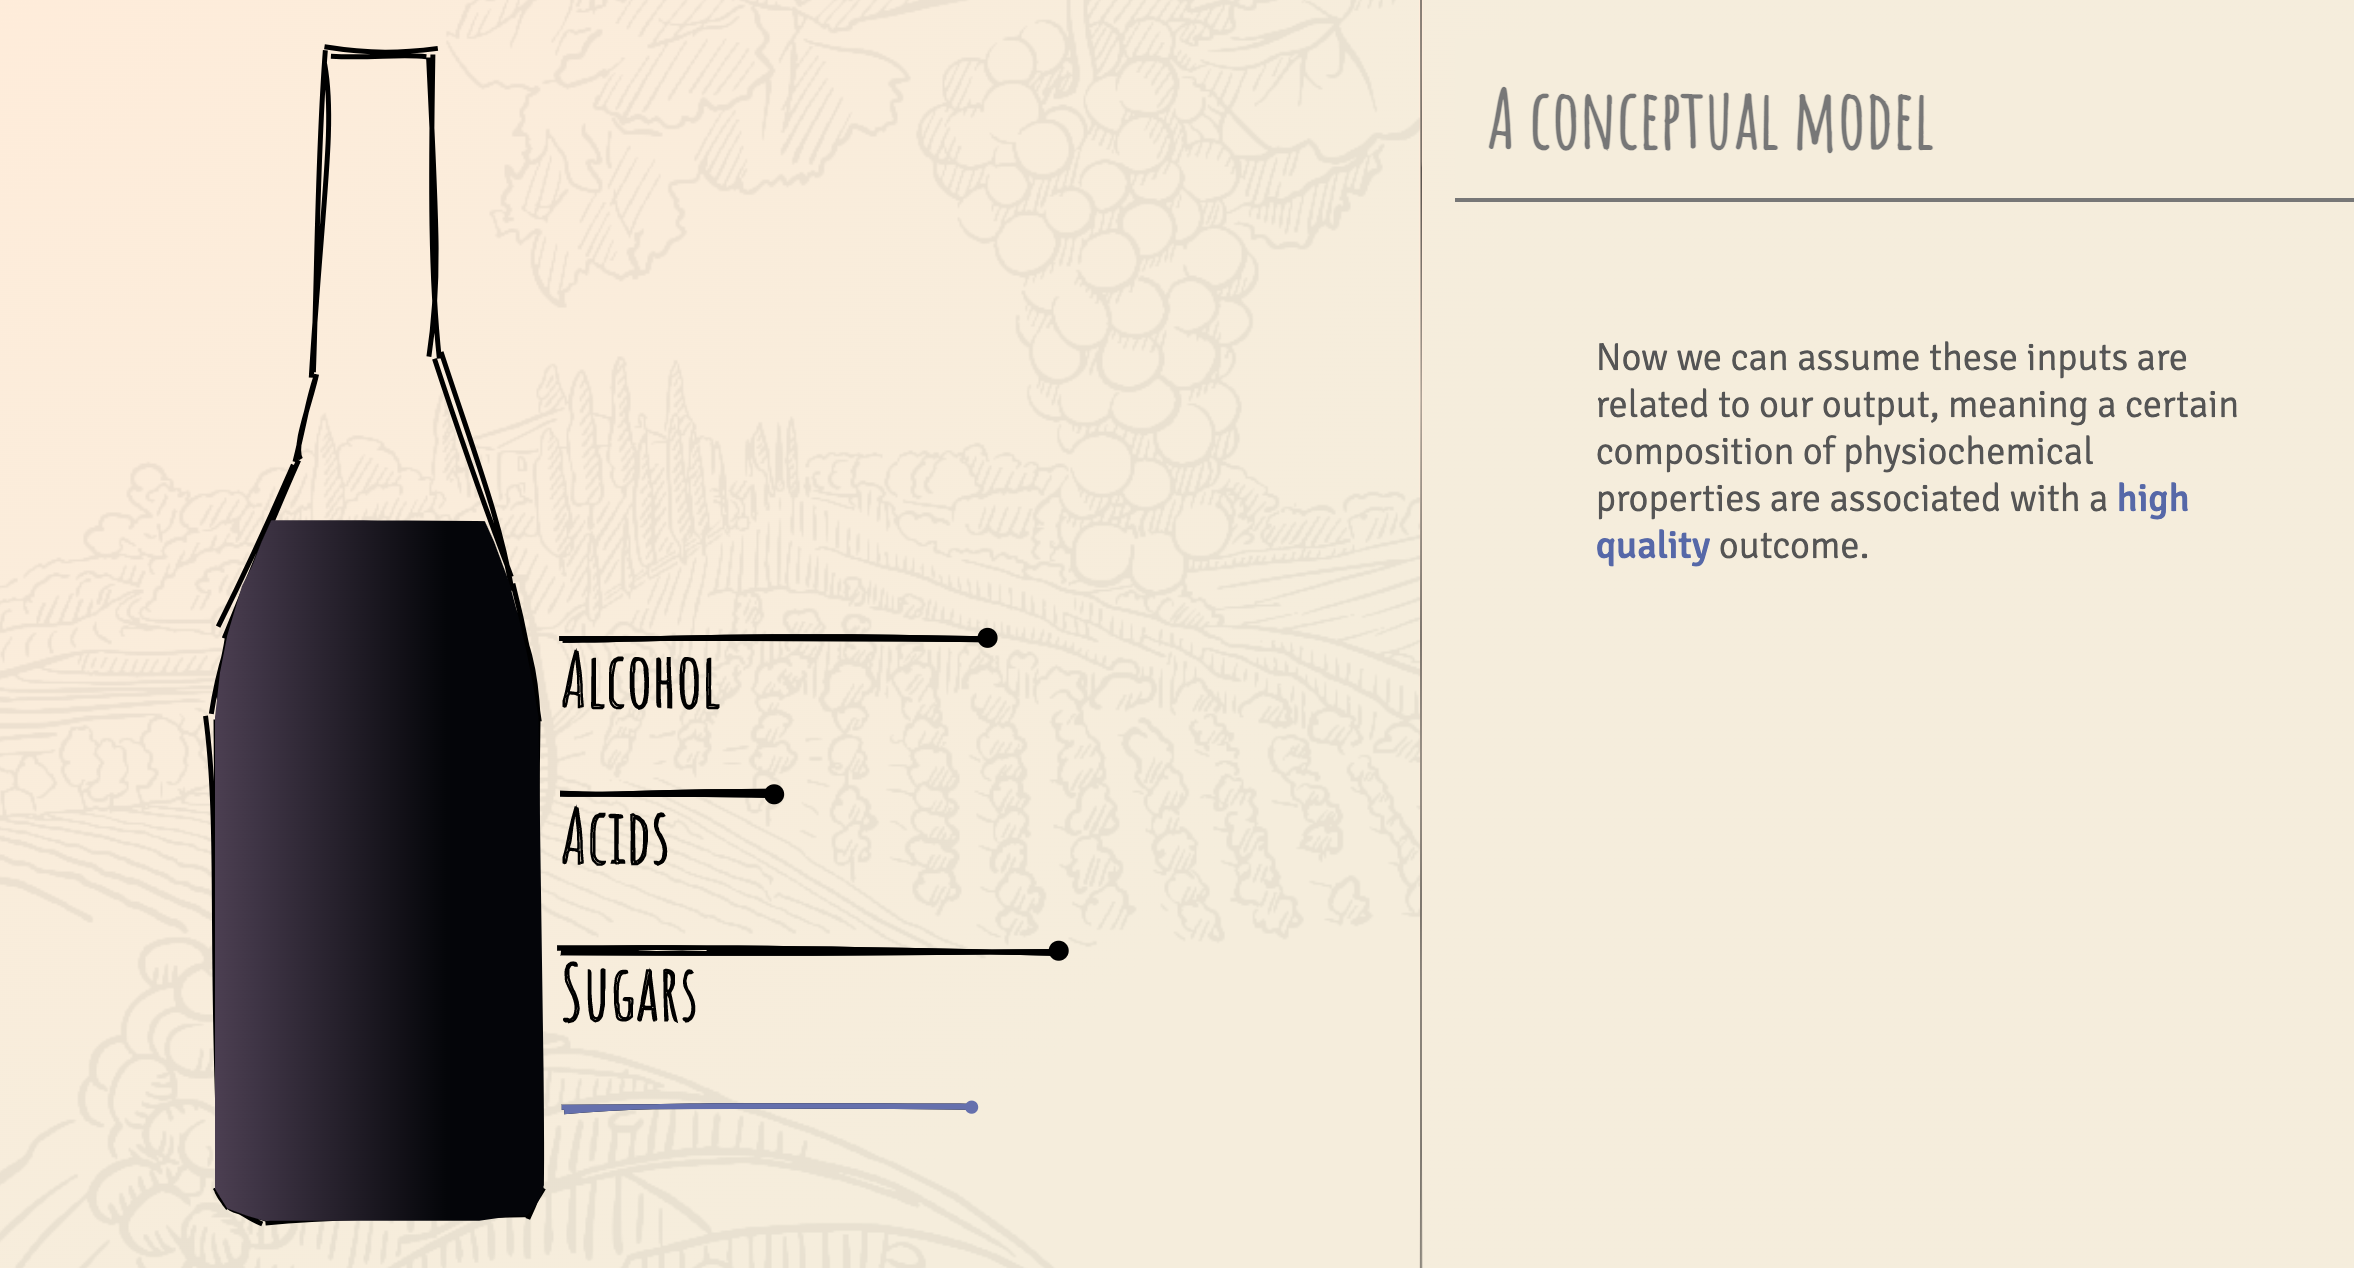
Wine and Math
Pudding
Winning Lotto Numbers
Unknown
Withering Away
Behance

Wolfram|Alpha Visualizations
Wolfram Research

Women in Headlines
Pudding
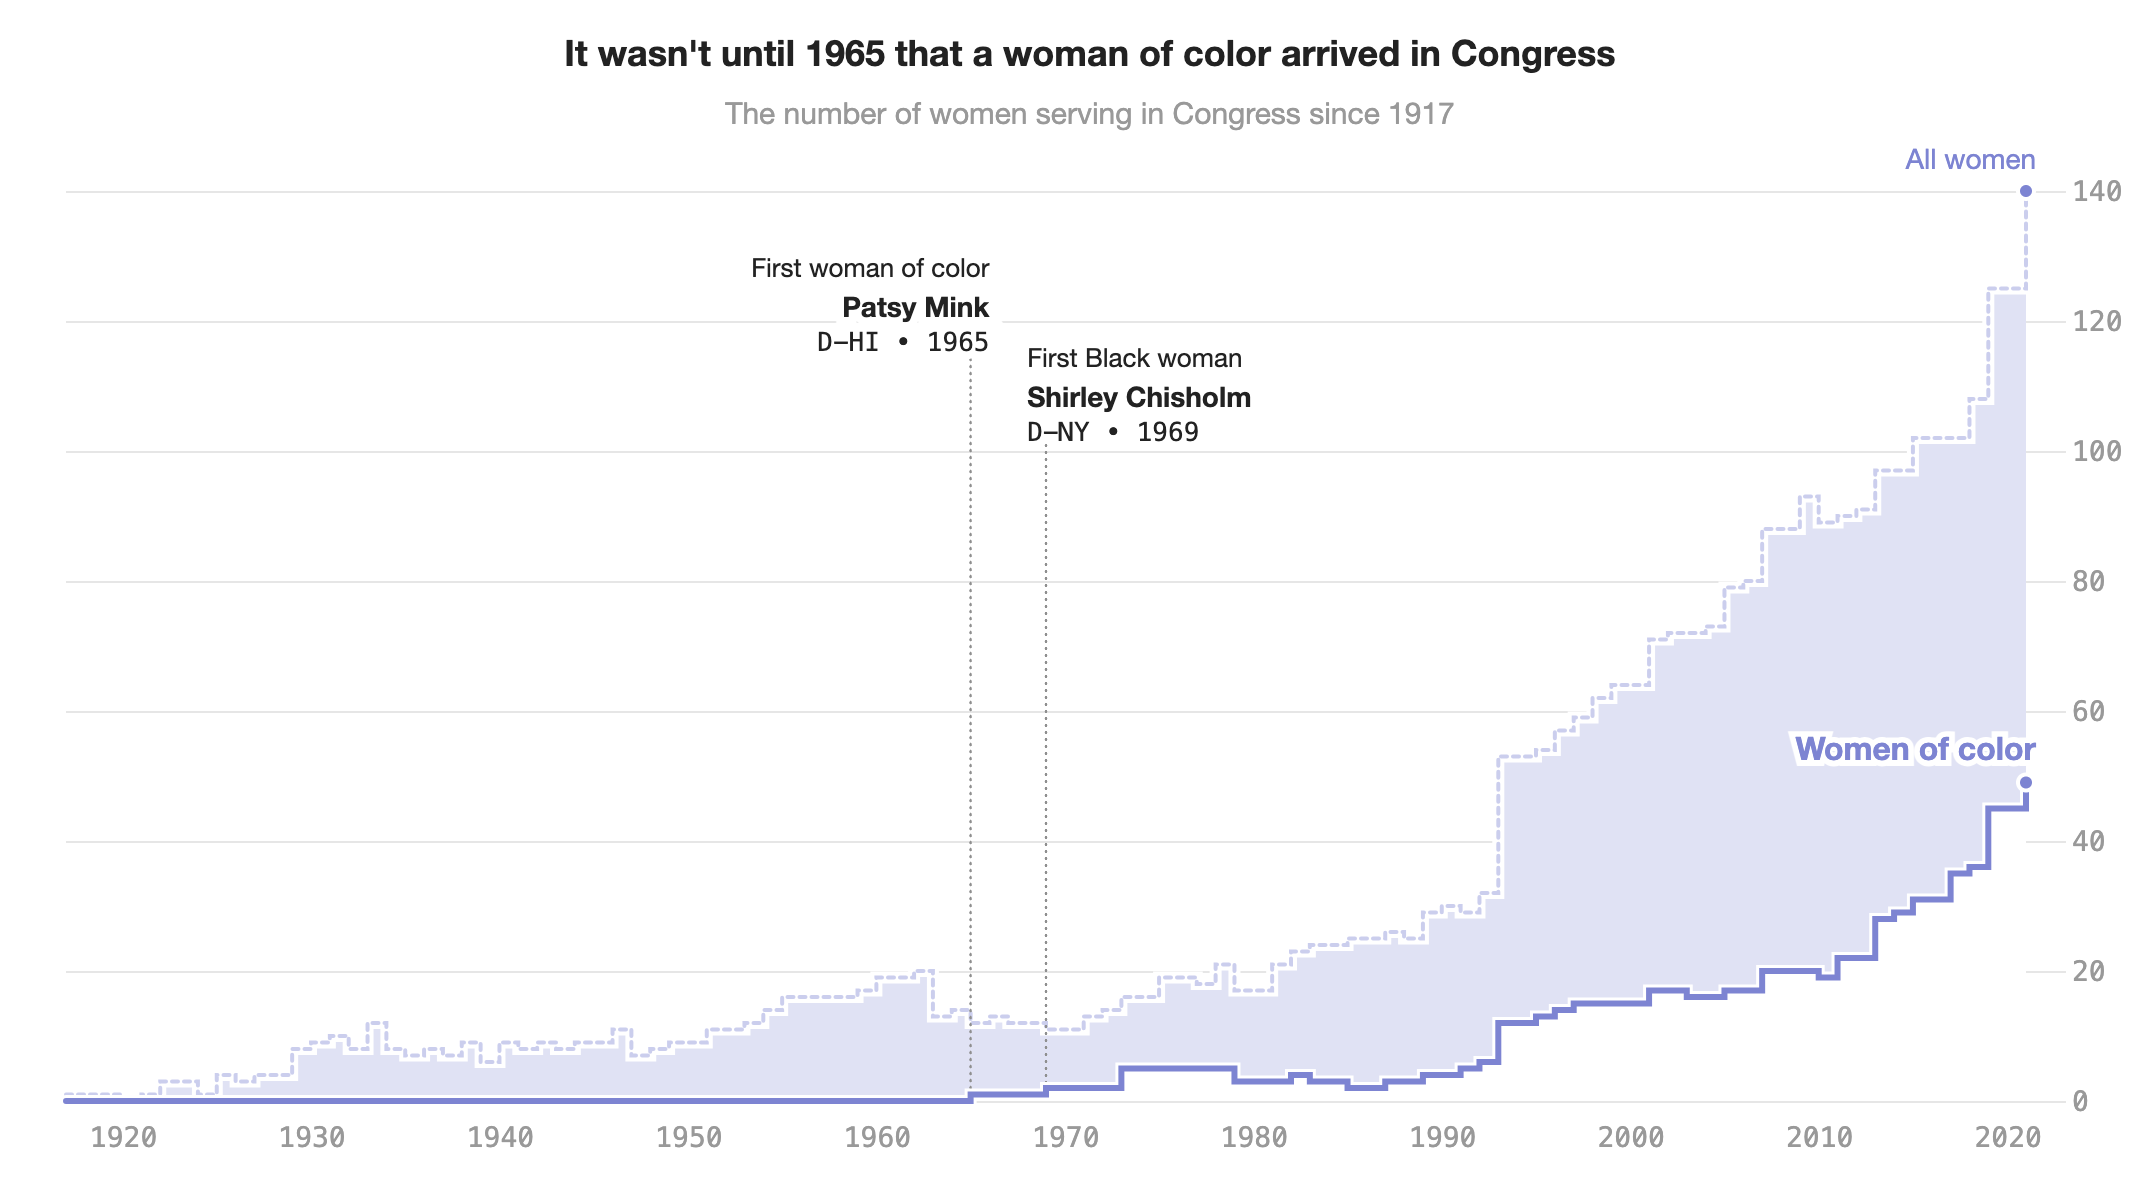
Women of Color Were Shut Out of Congress for Decades
538
Women Will
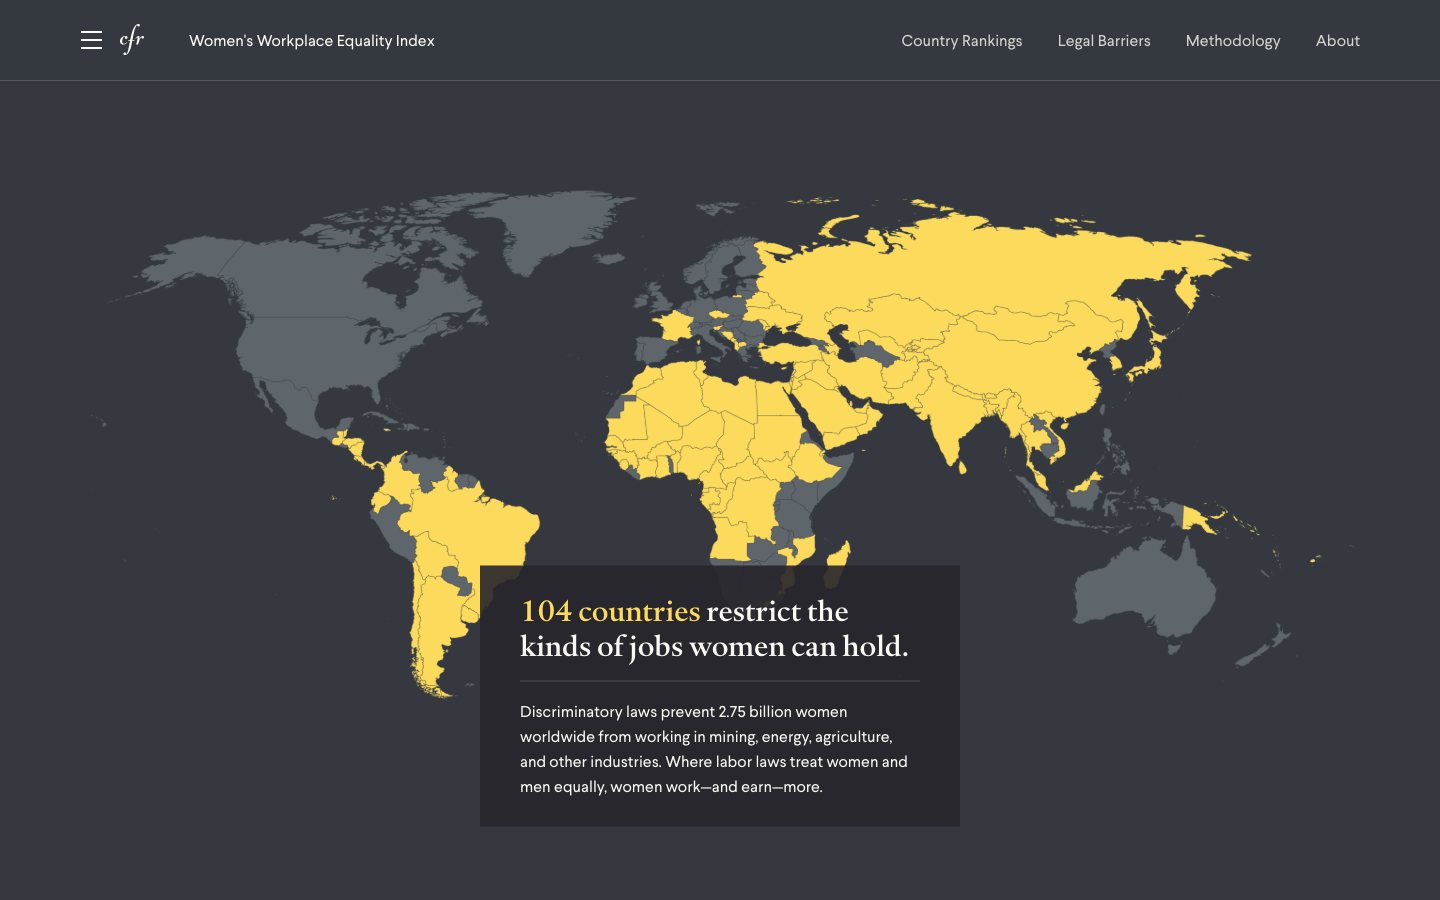
Women's Workplace Equality Index
Council on Foreign Relations
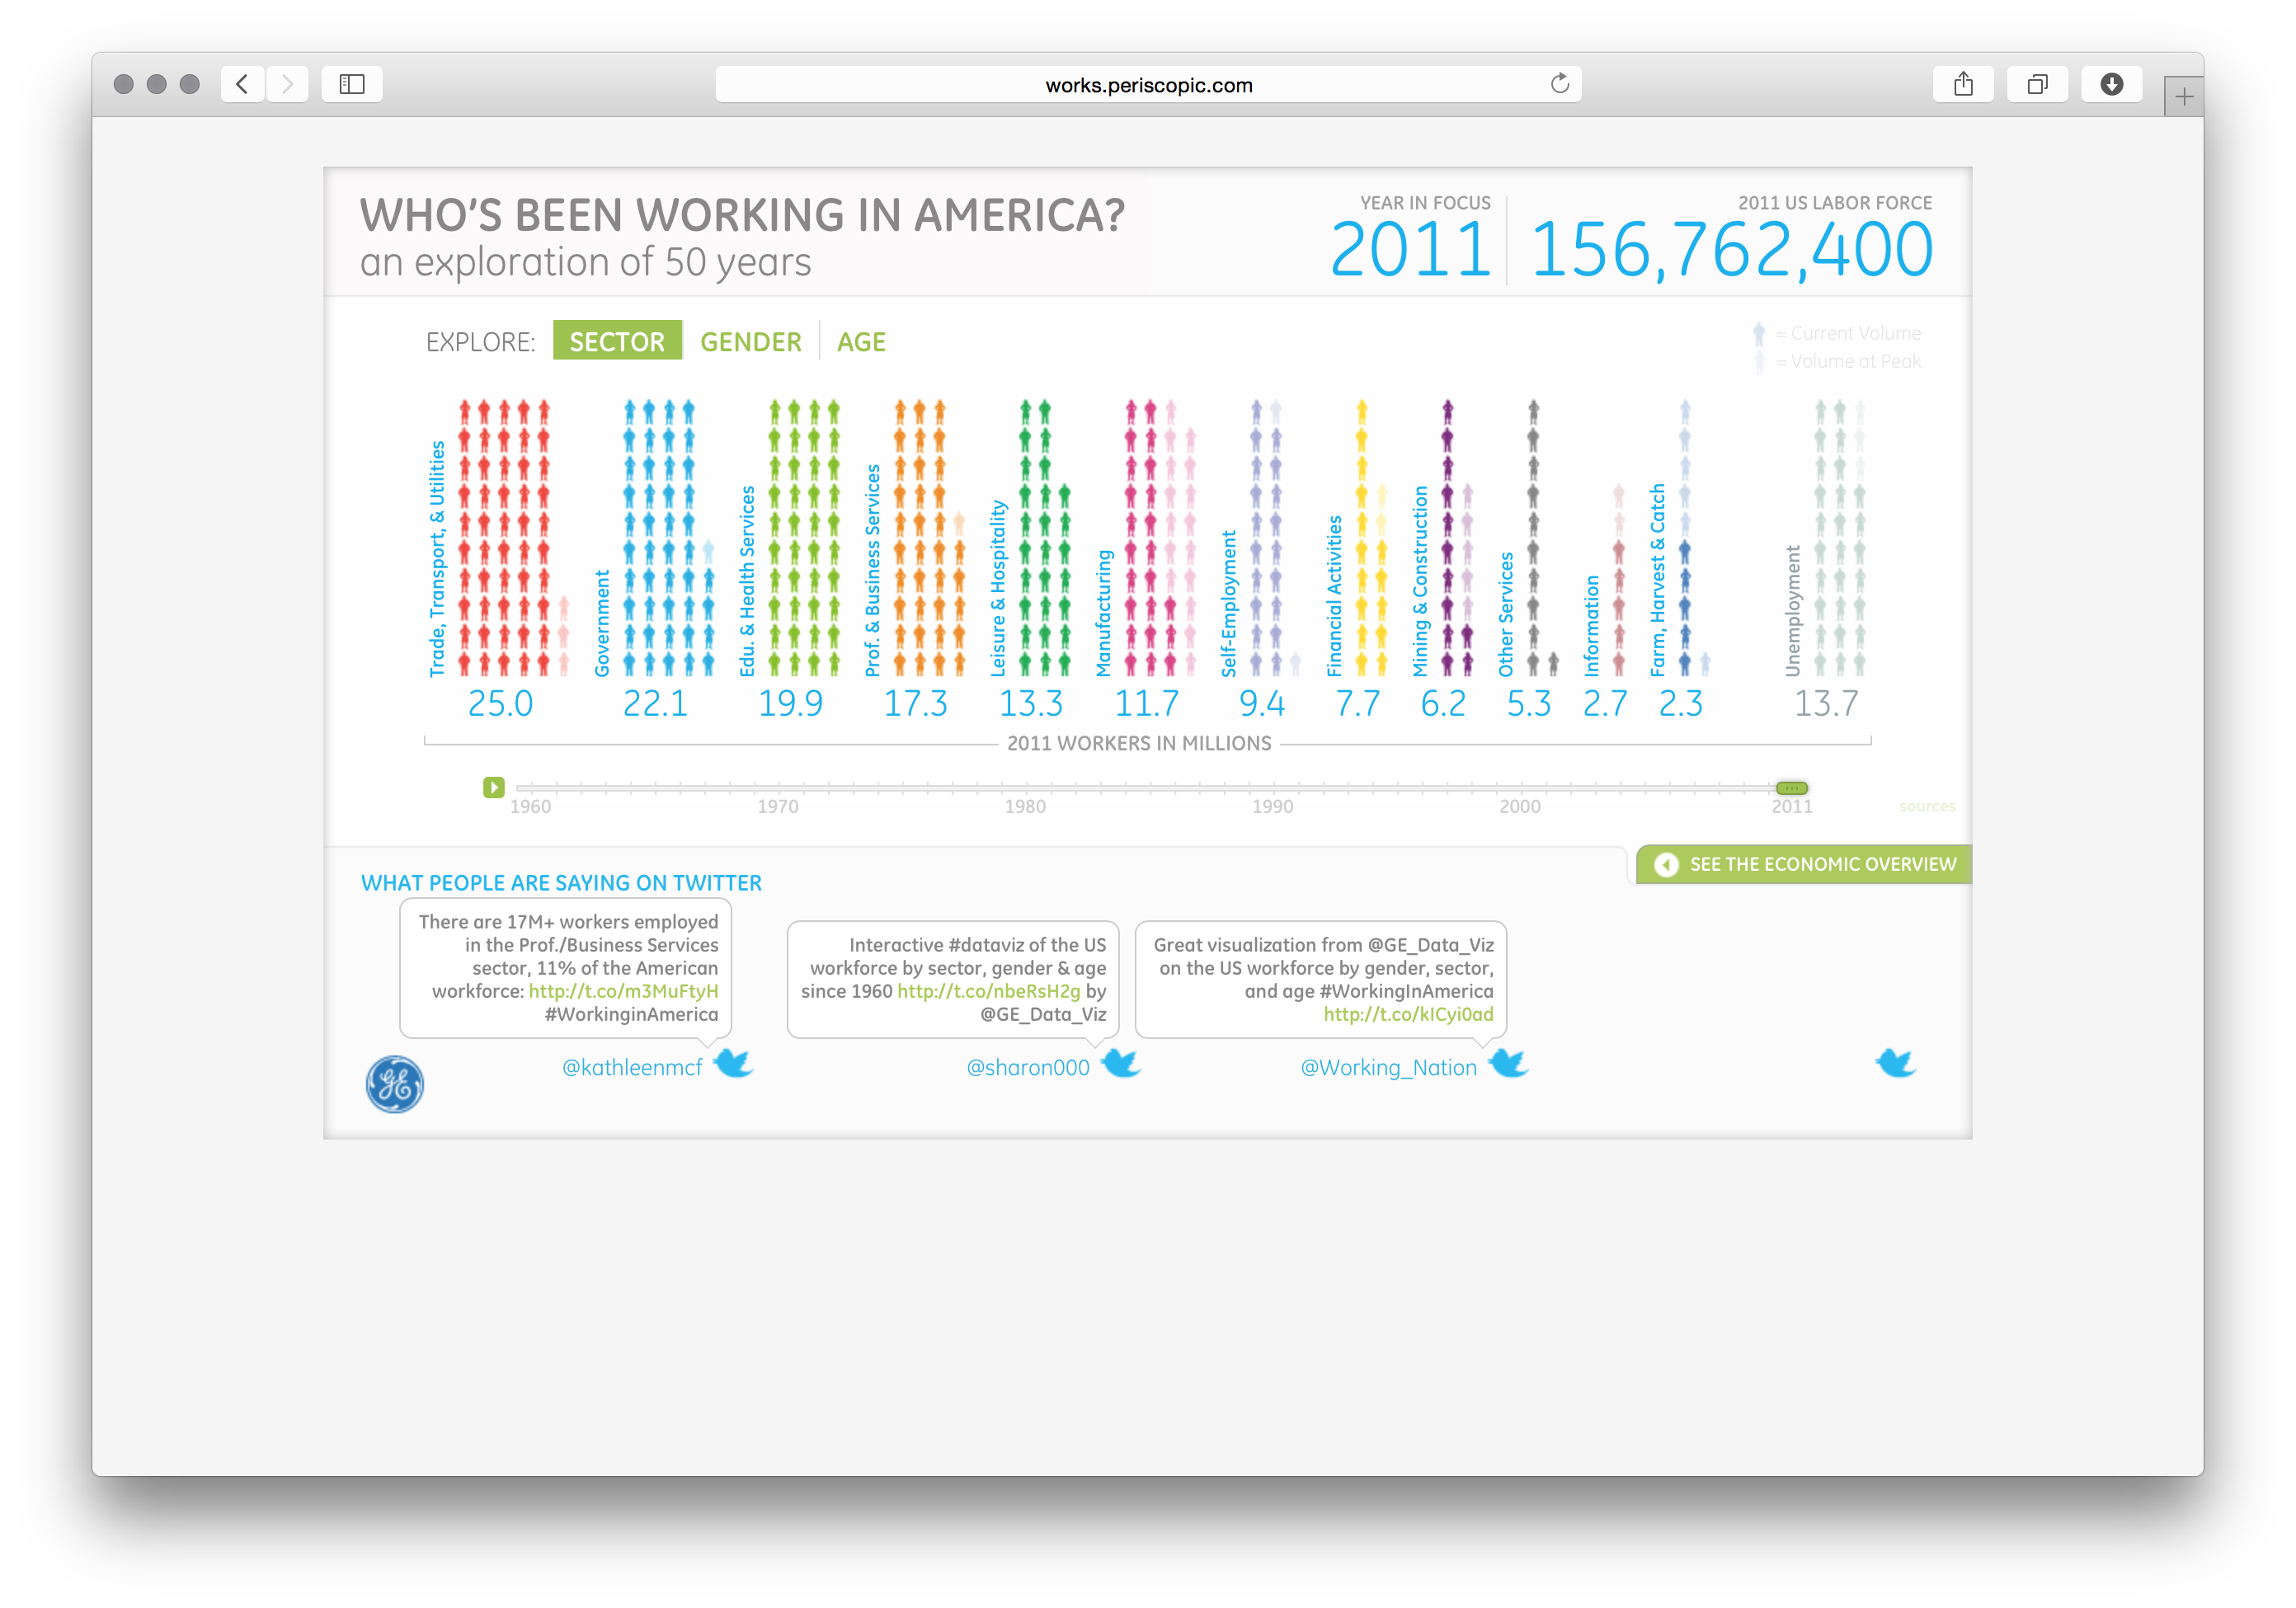
Working in America
Periscopic
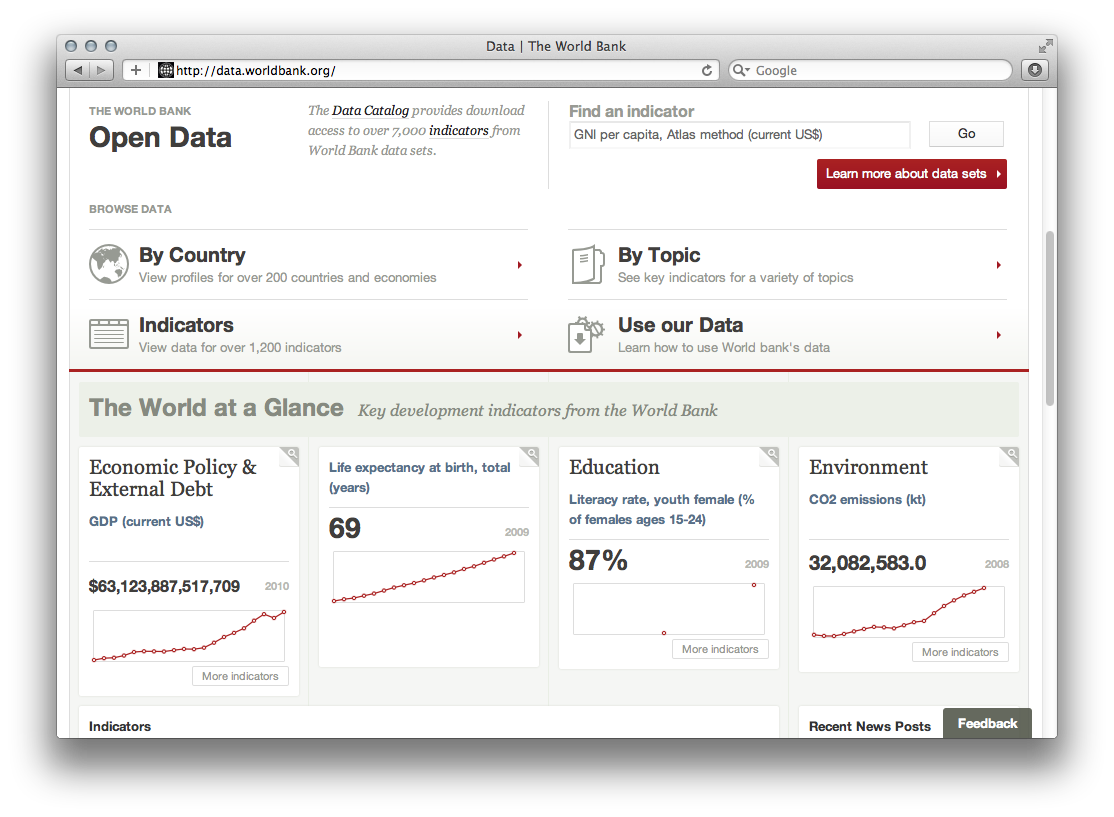
World Bank Open Data
World Bank

World Coffee Research
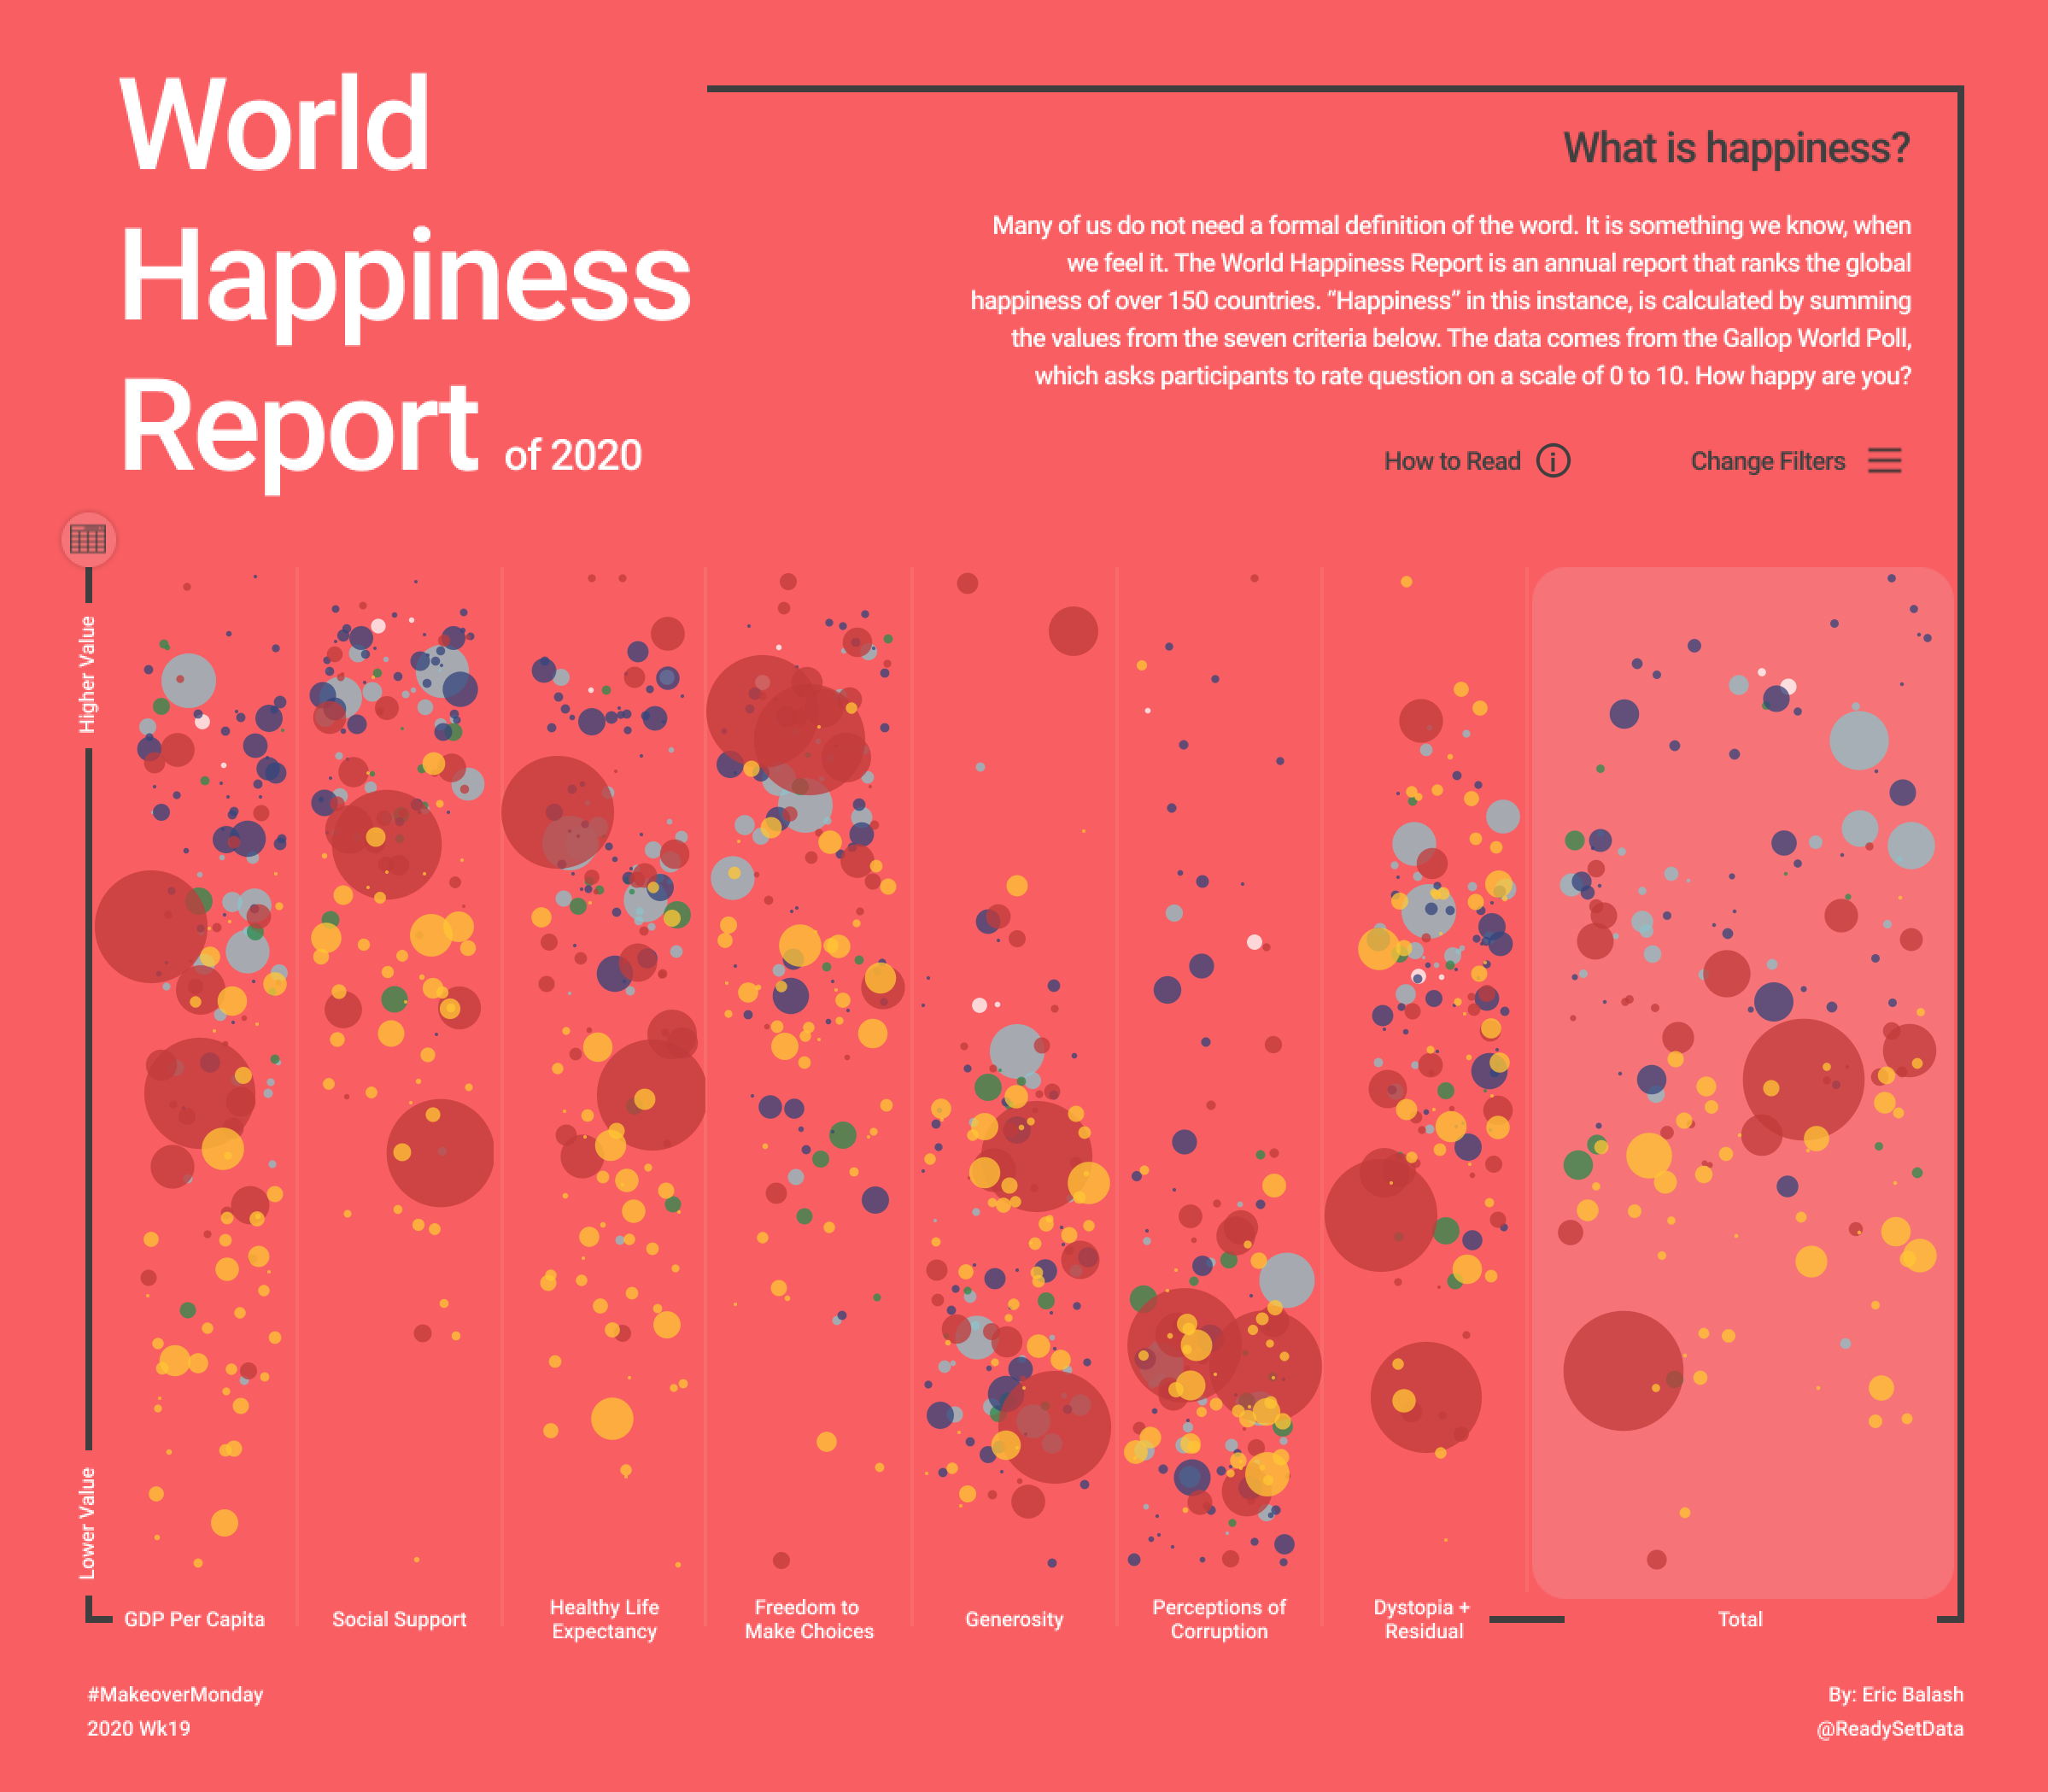
World Happiness Report
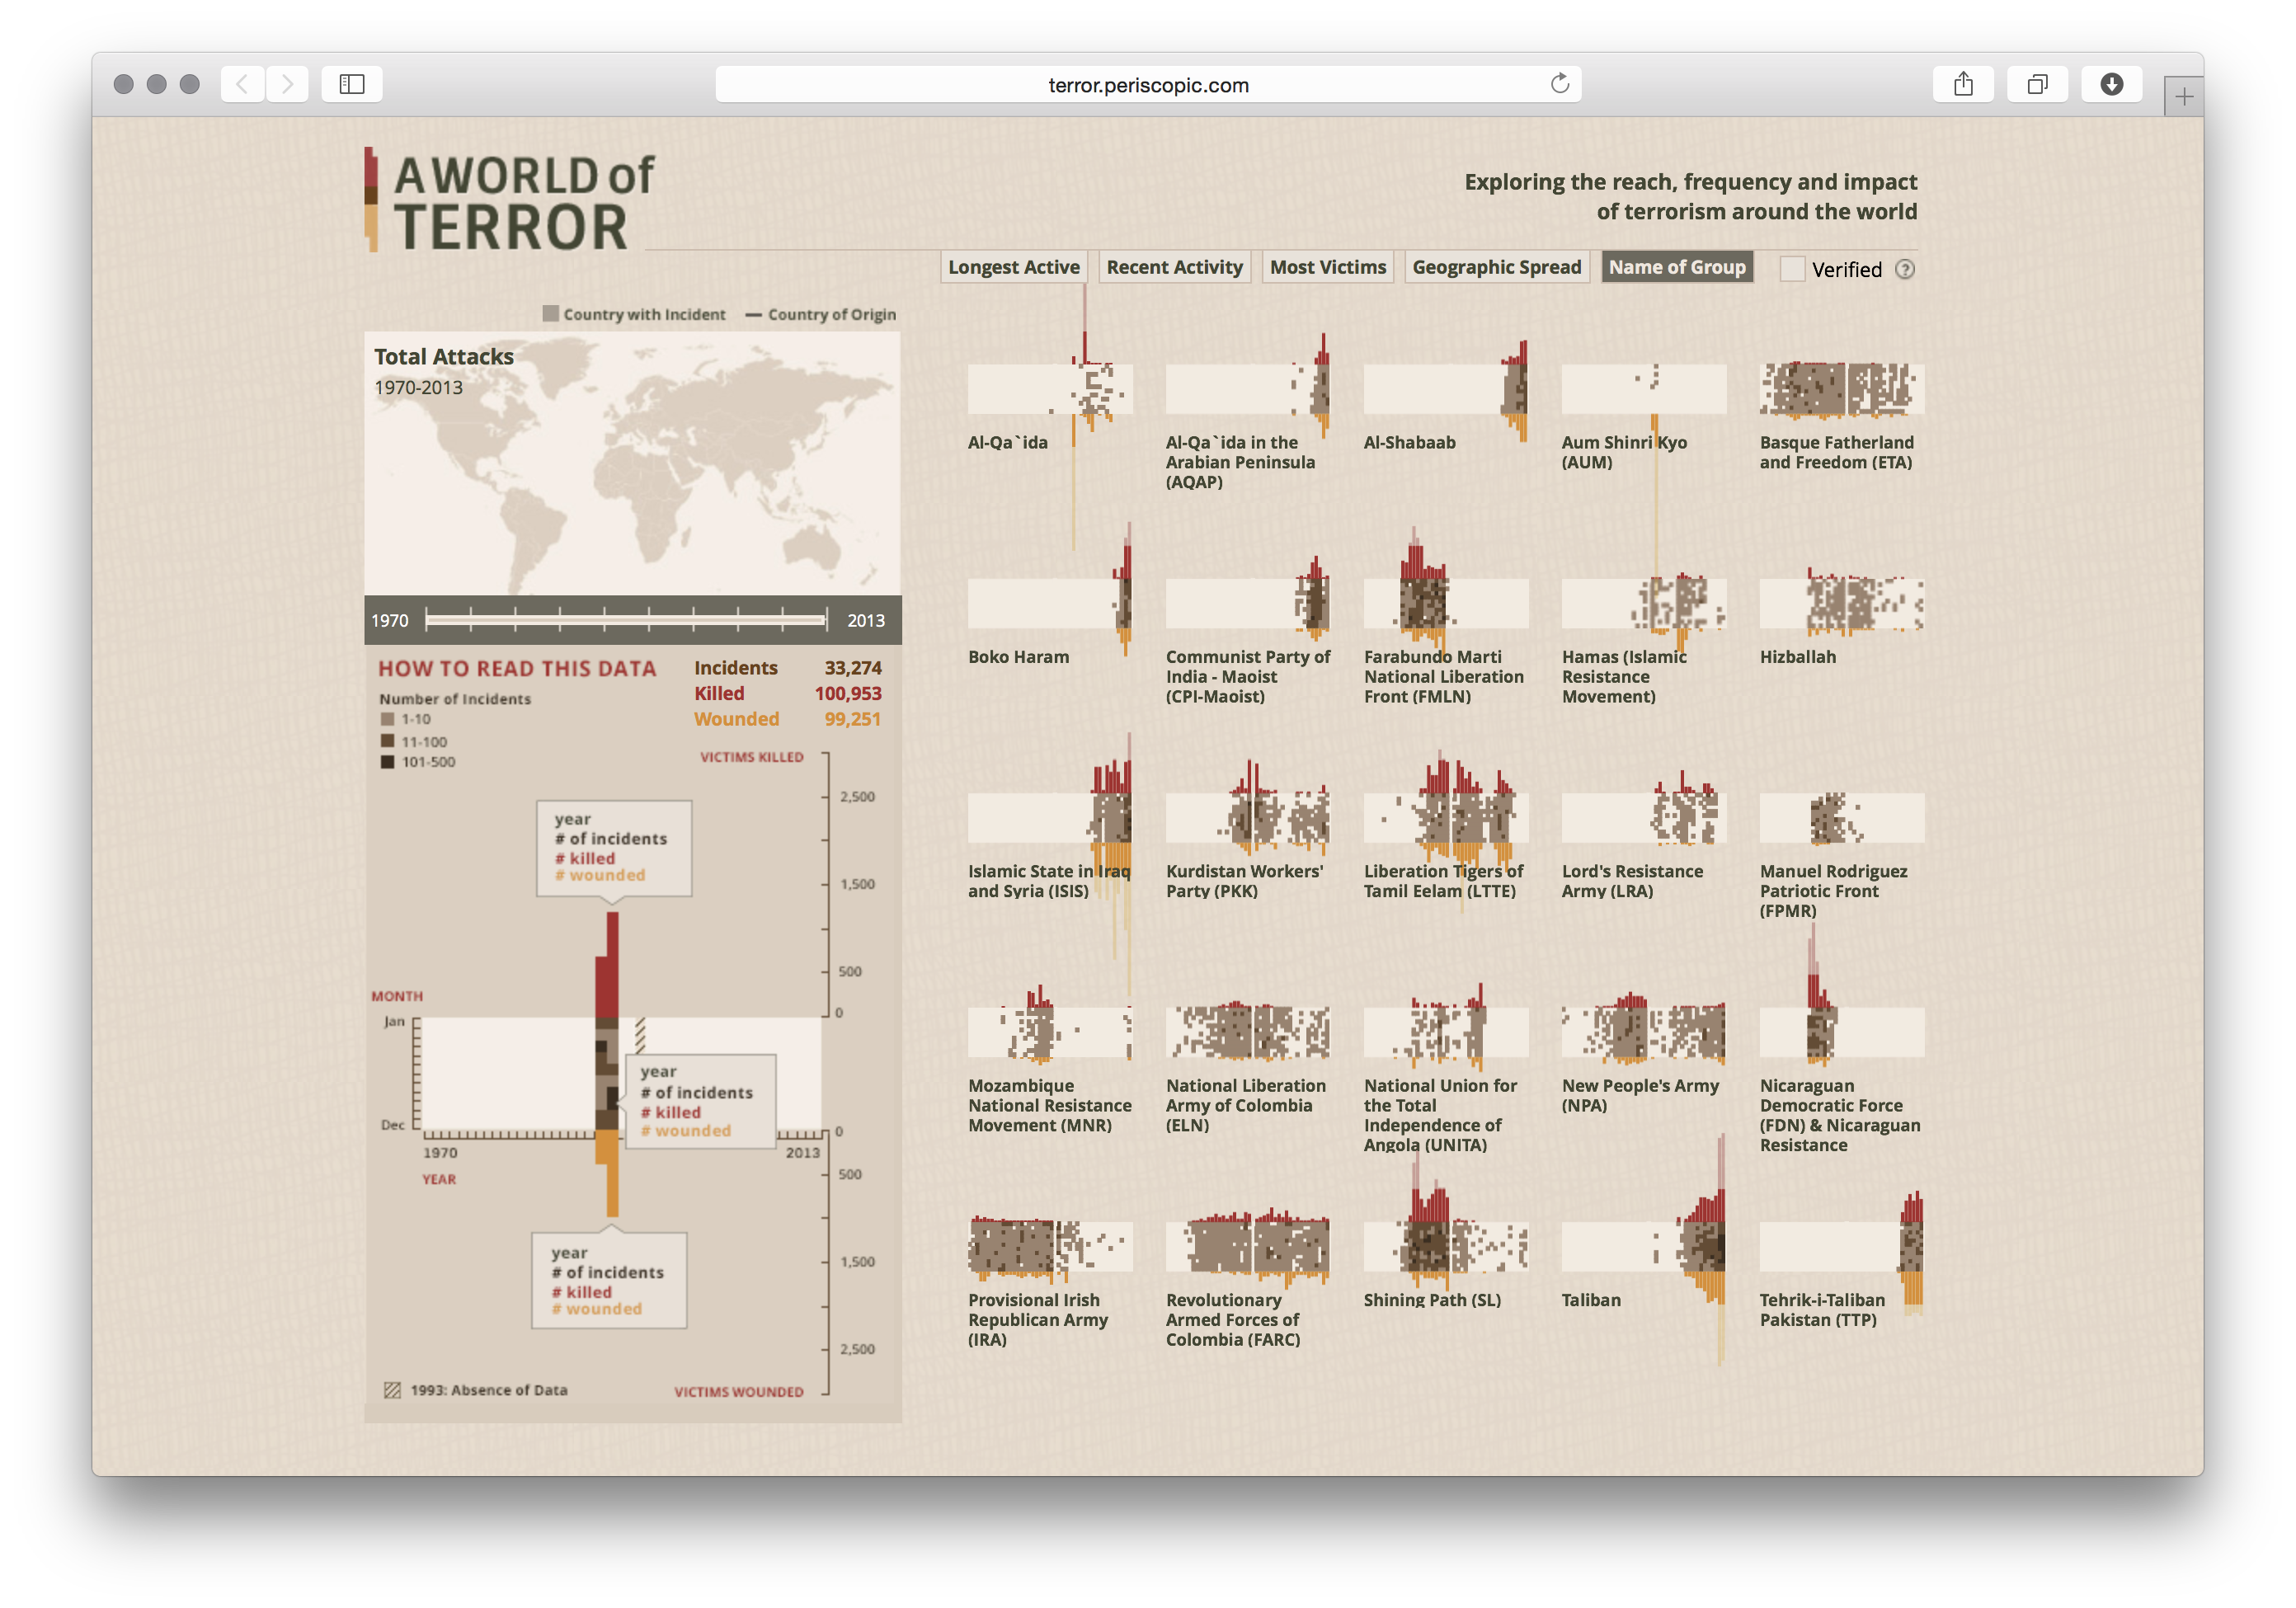
World of Terror
Periscopic
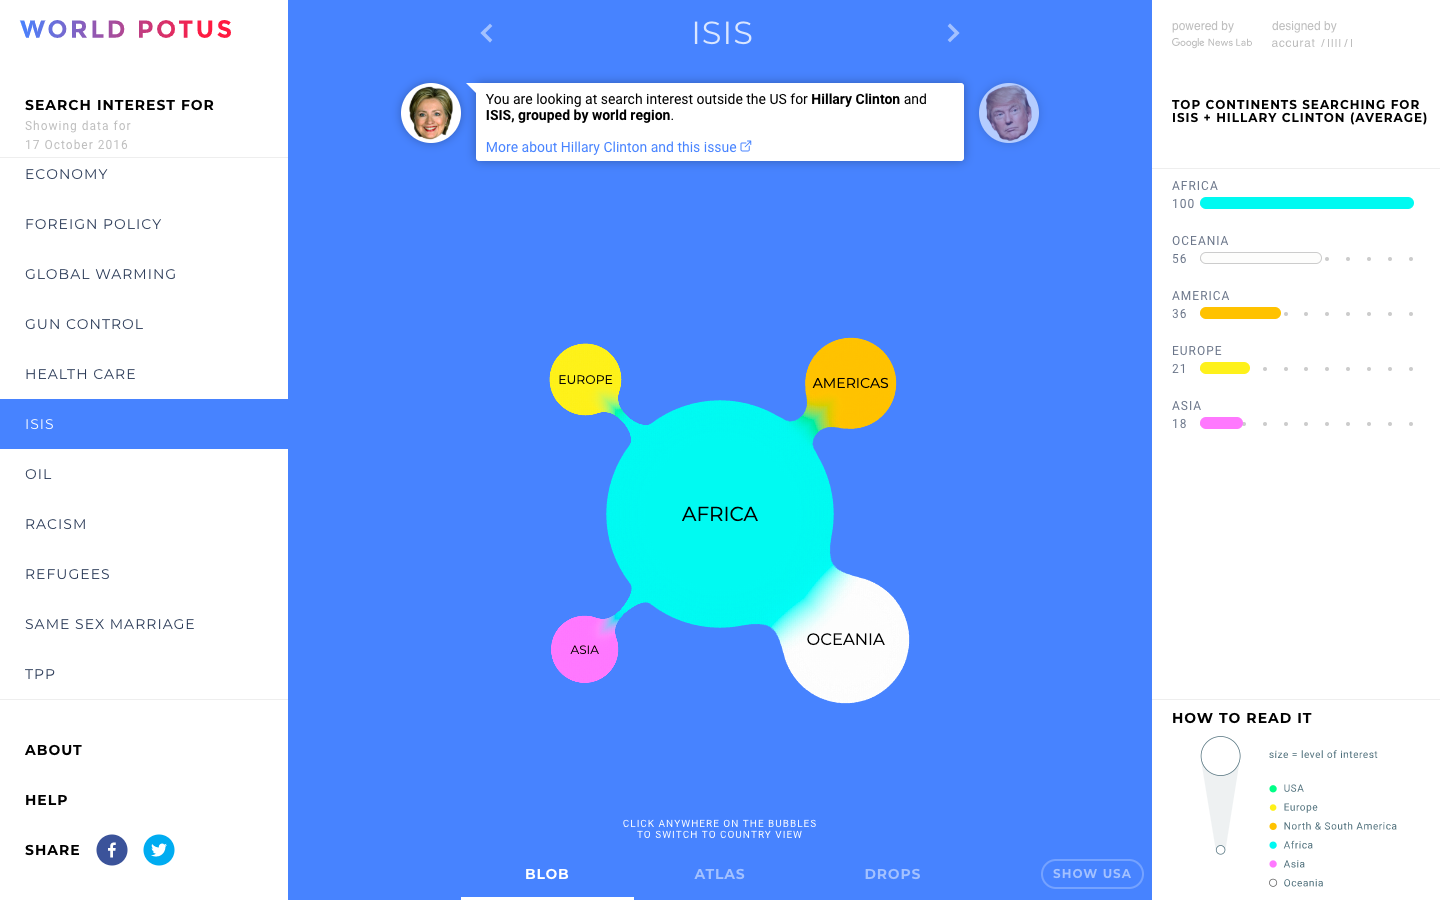
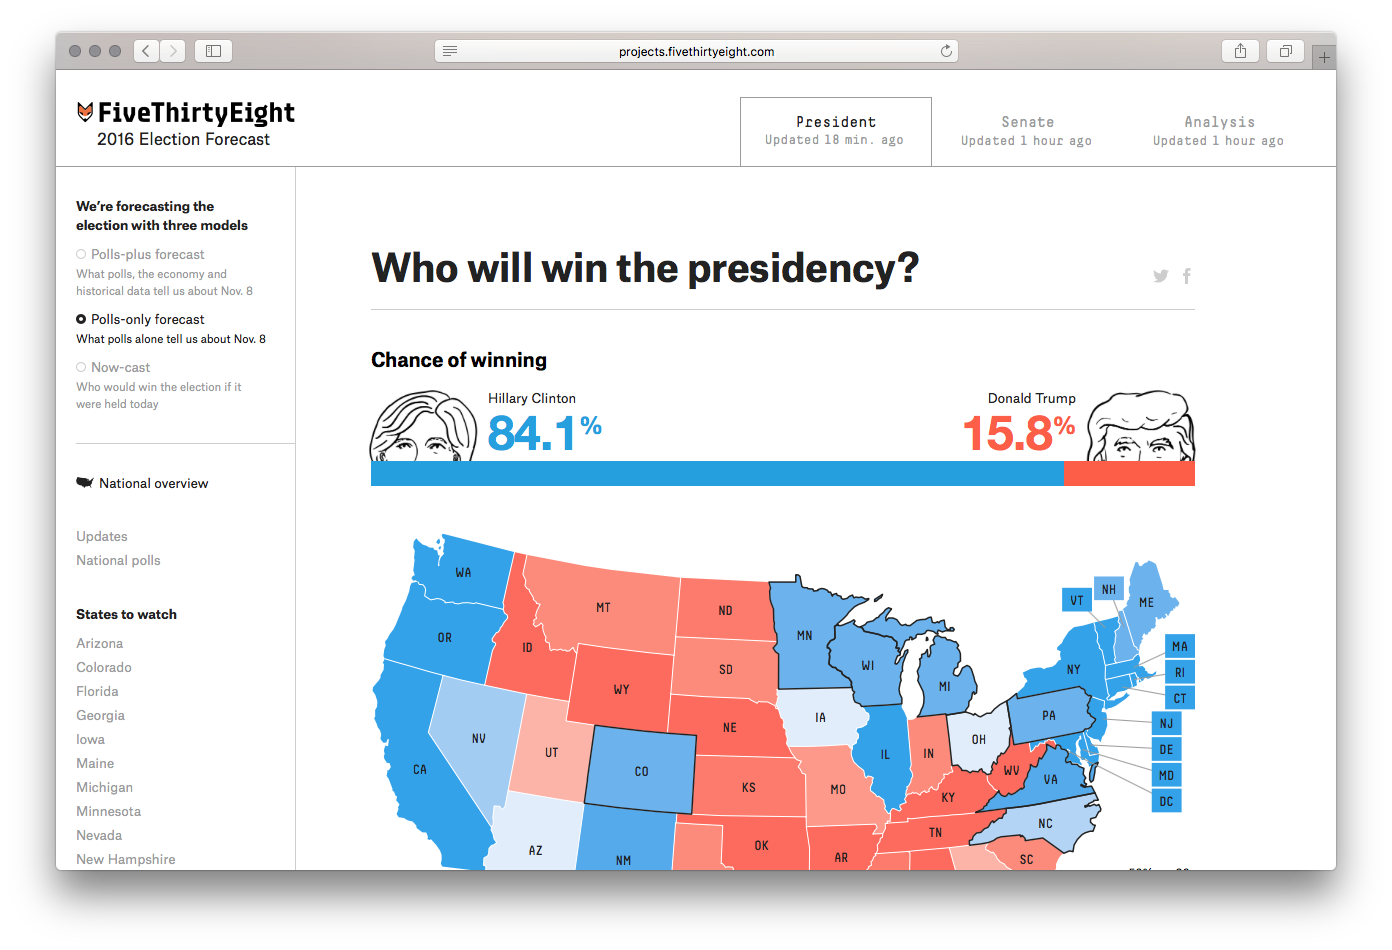
World Potus
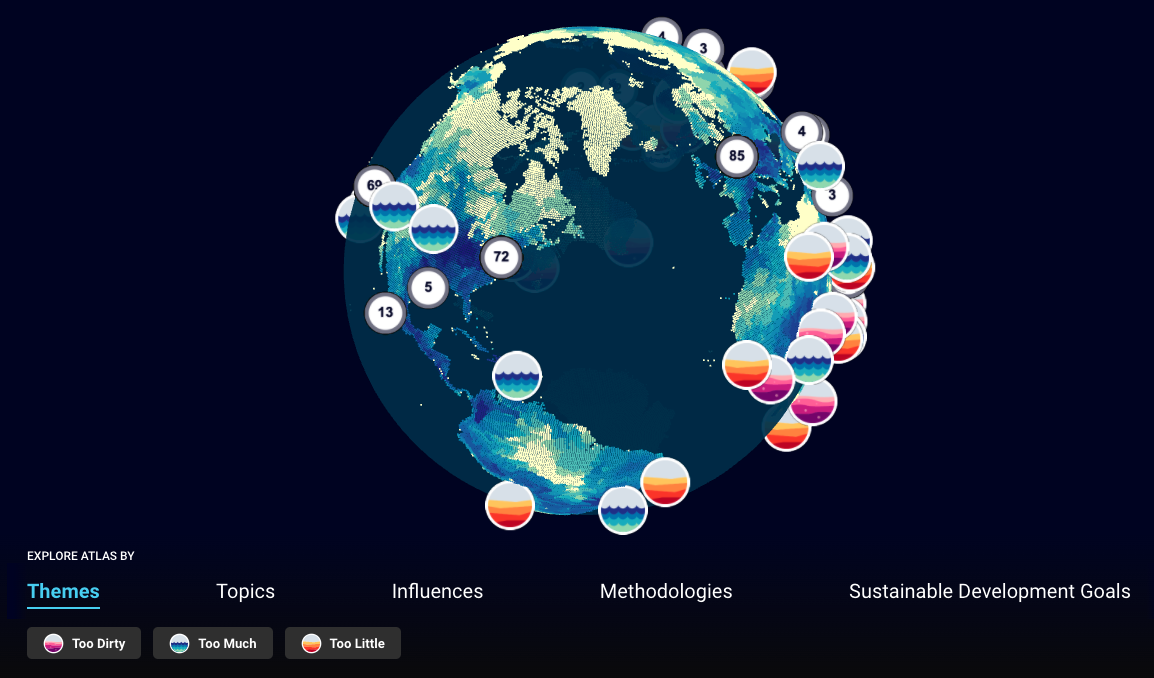
World Water Atlas
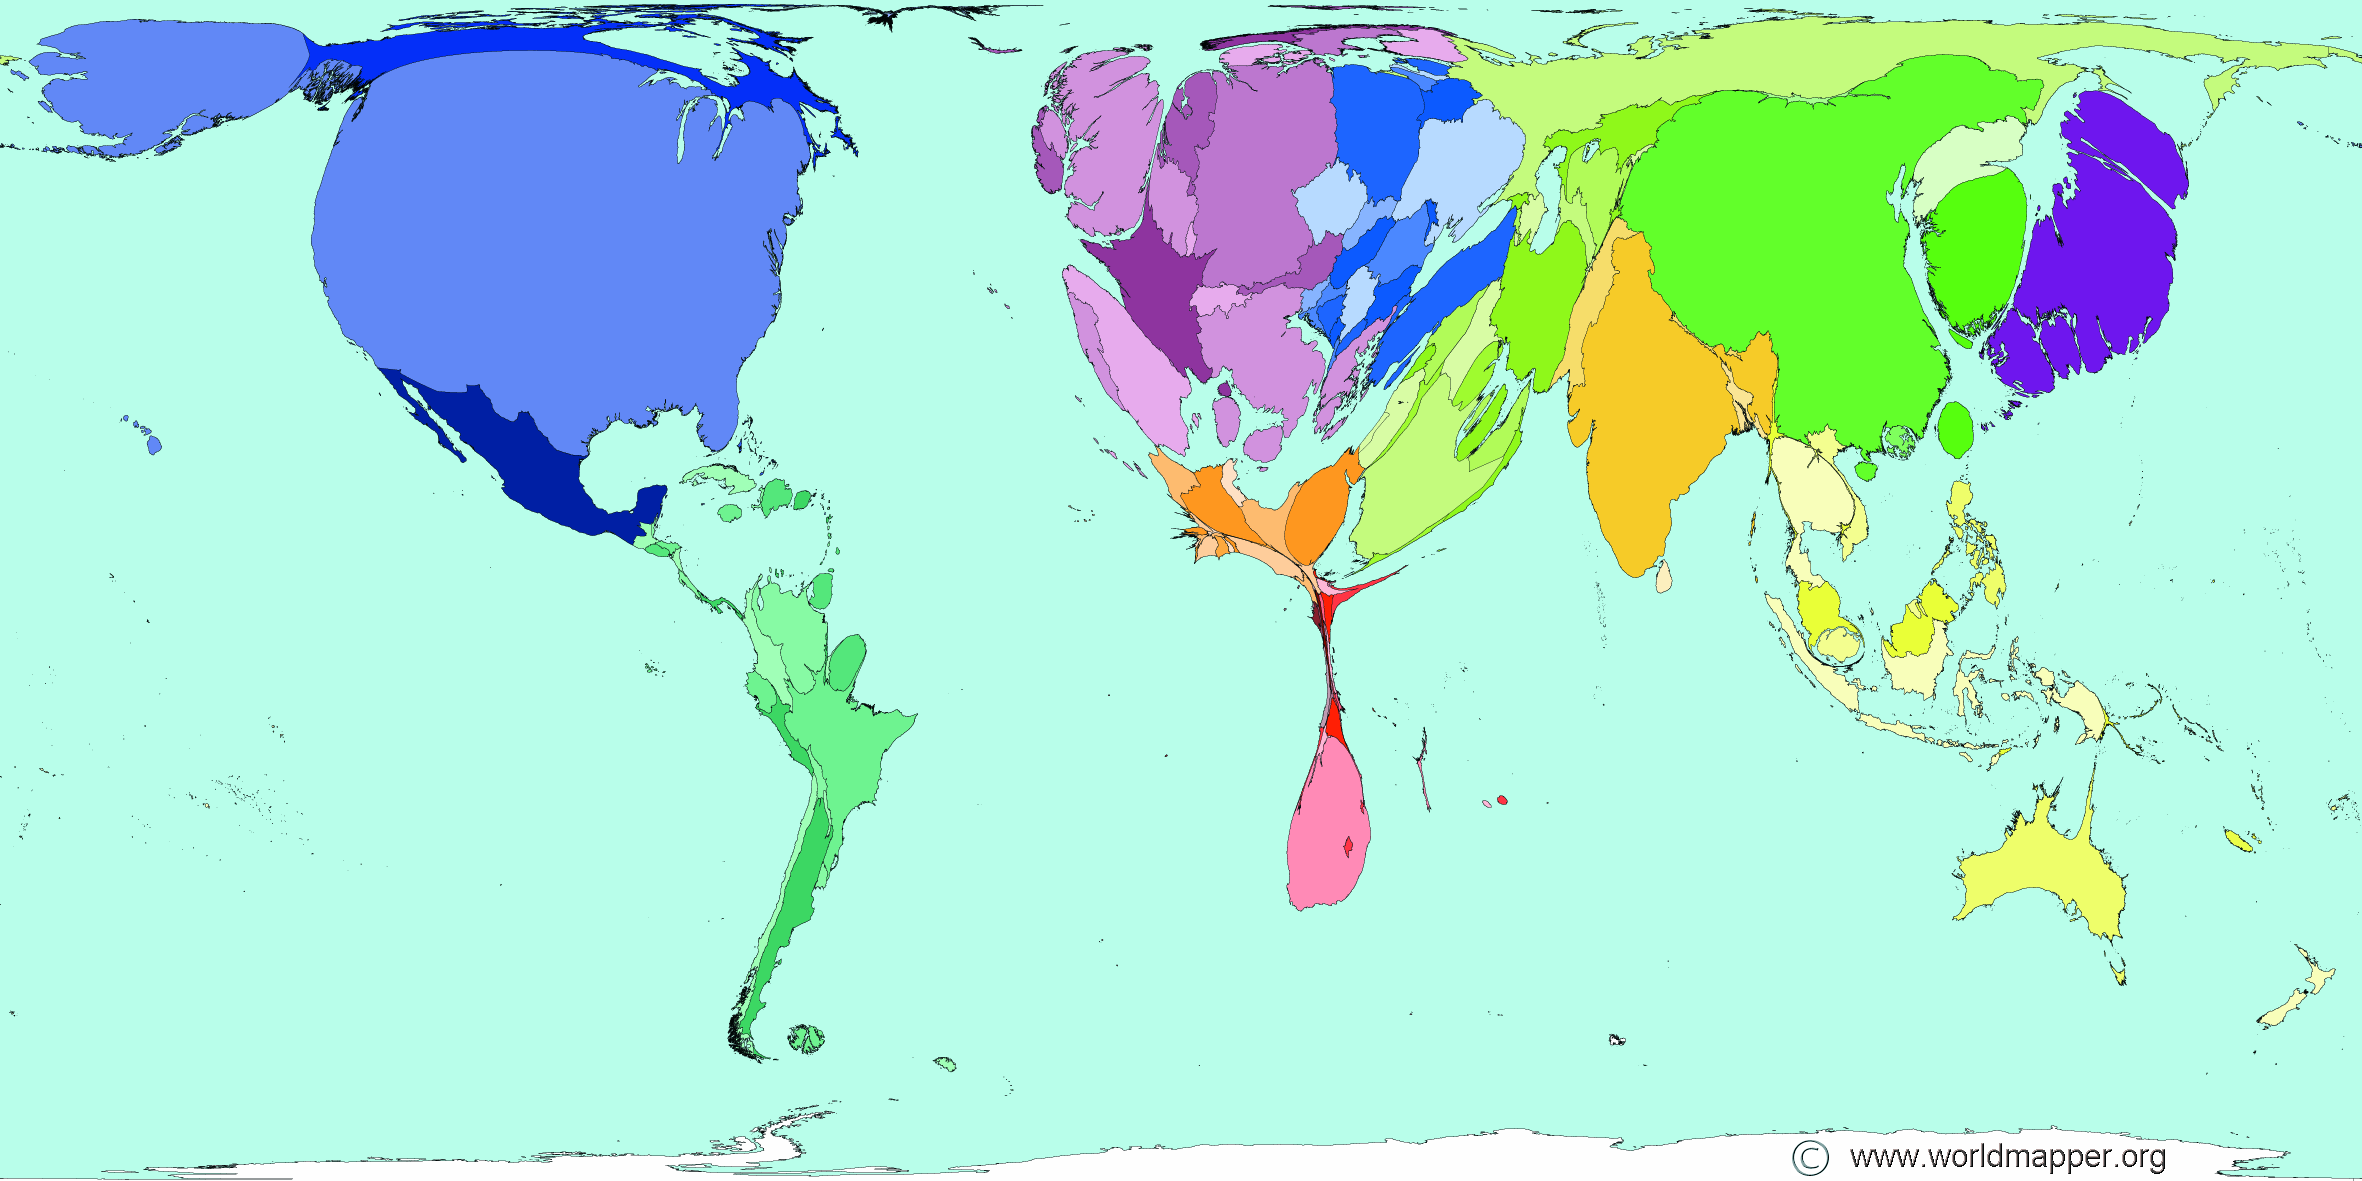
Worldmapper
SASI Group
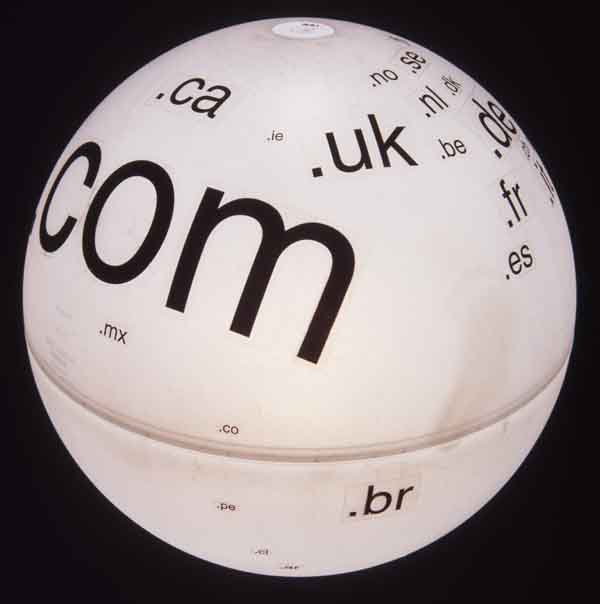
Worldprocessor
Ingo Günther

WPA (Workplace Analytics) Video
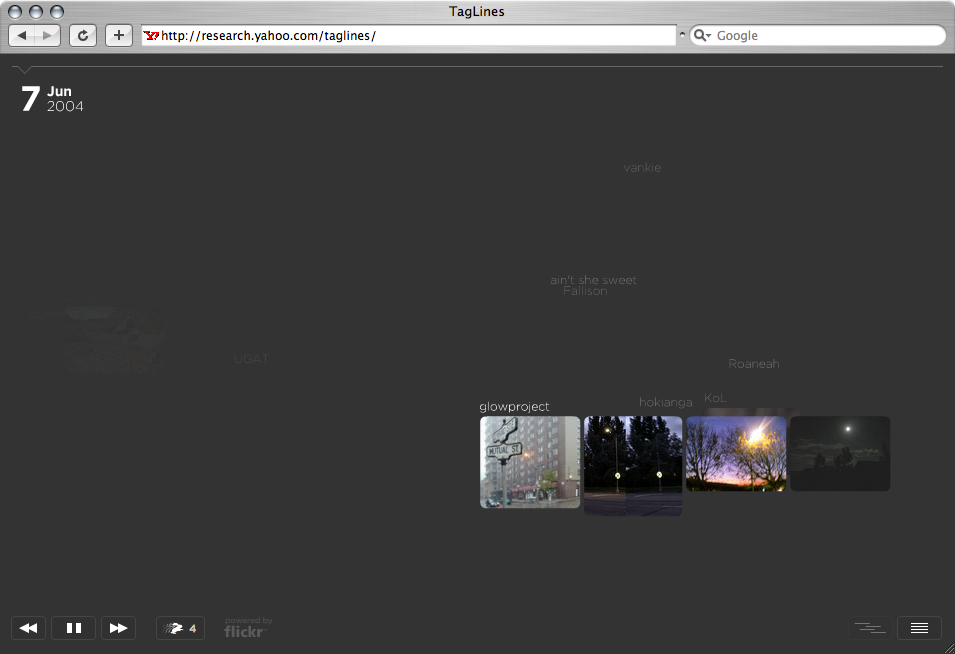
Yahoo Design Innovation Team Taglines
Yahoo Design Innovation Team
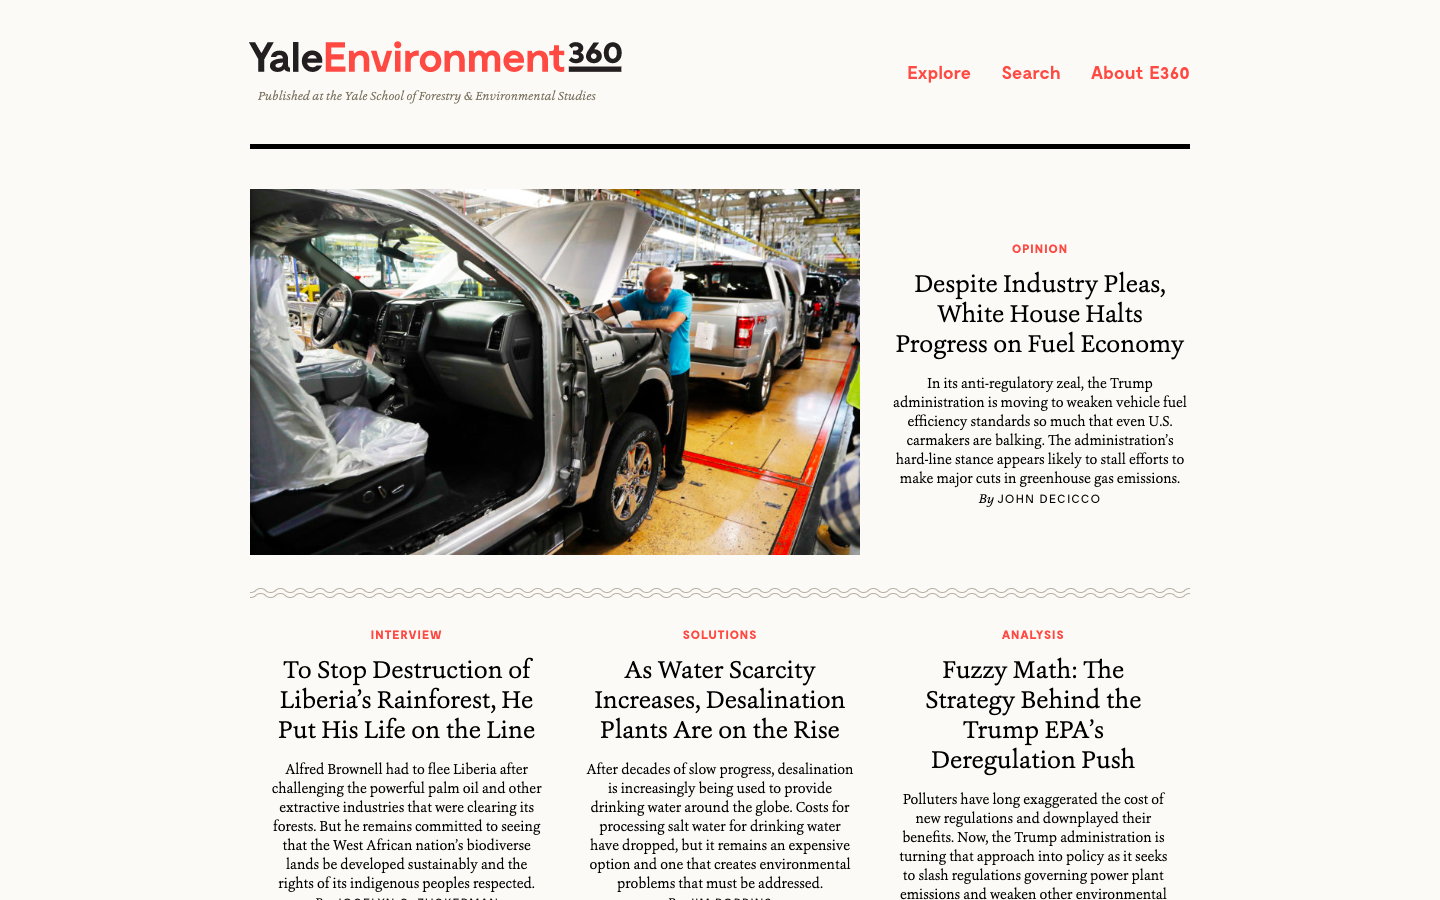
Yale E360

Yes Yes No Nike City Runs
Yes Yes No

Yes Yes No Paint With Your Feet
Yes Yes No
You Are Here
Denis Wood
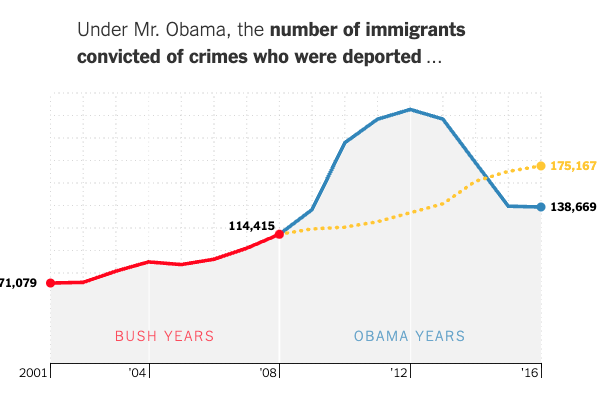
You Draw It: What Got Better Orworse during Obama’s Presidency
The New York Times

Your 2022 Neighbourly Impact
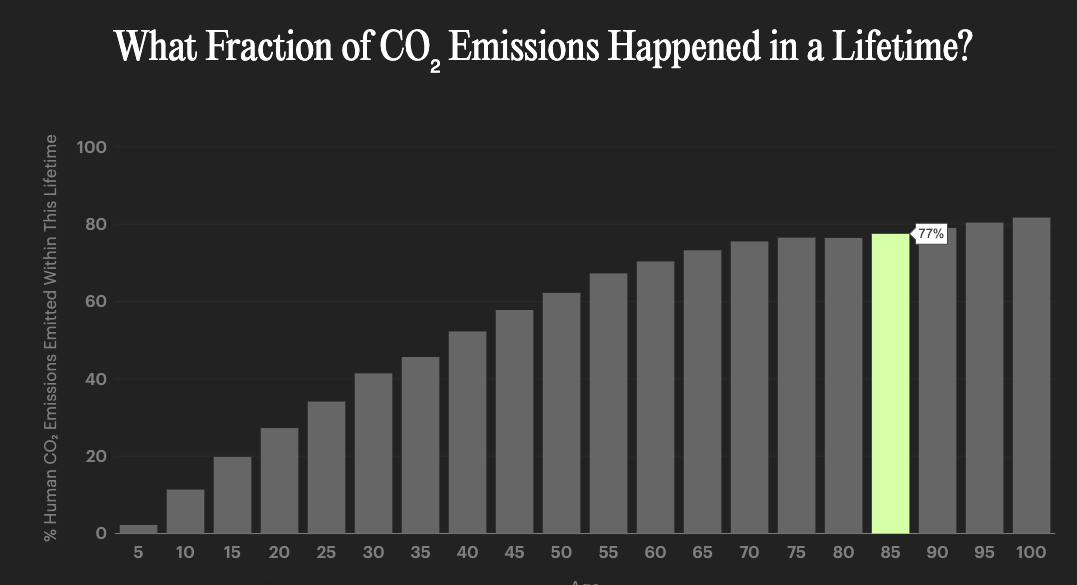
Your Personal Carbon History
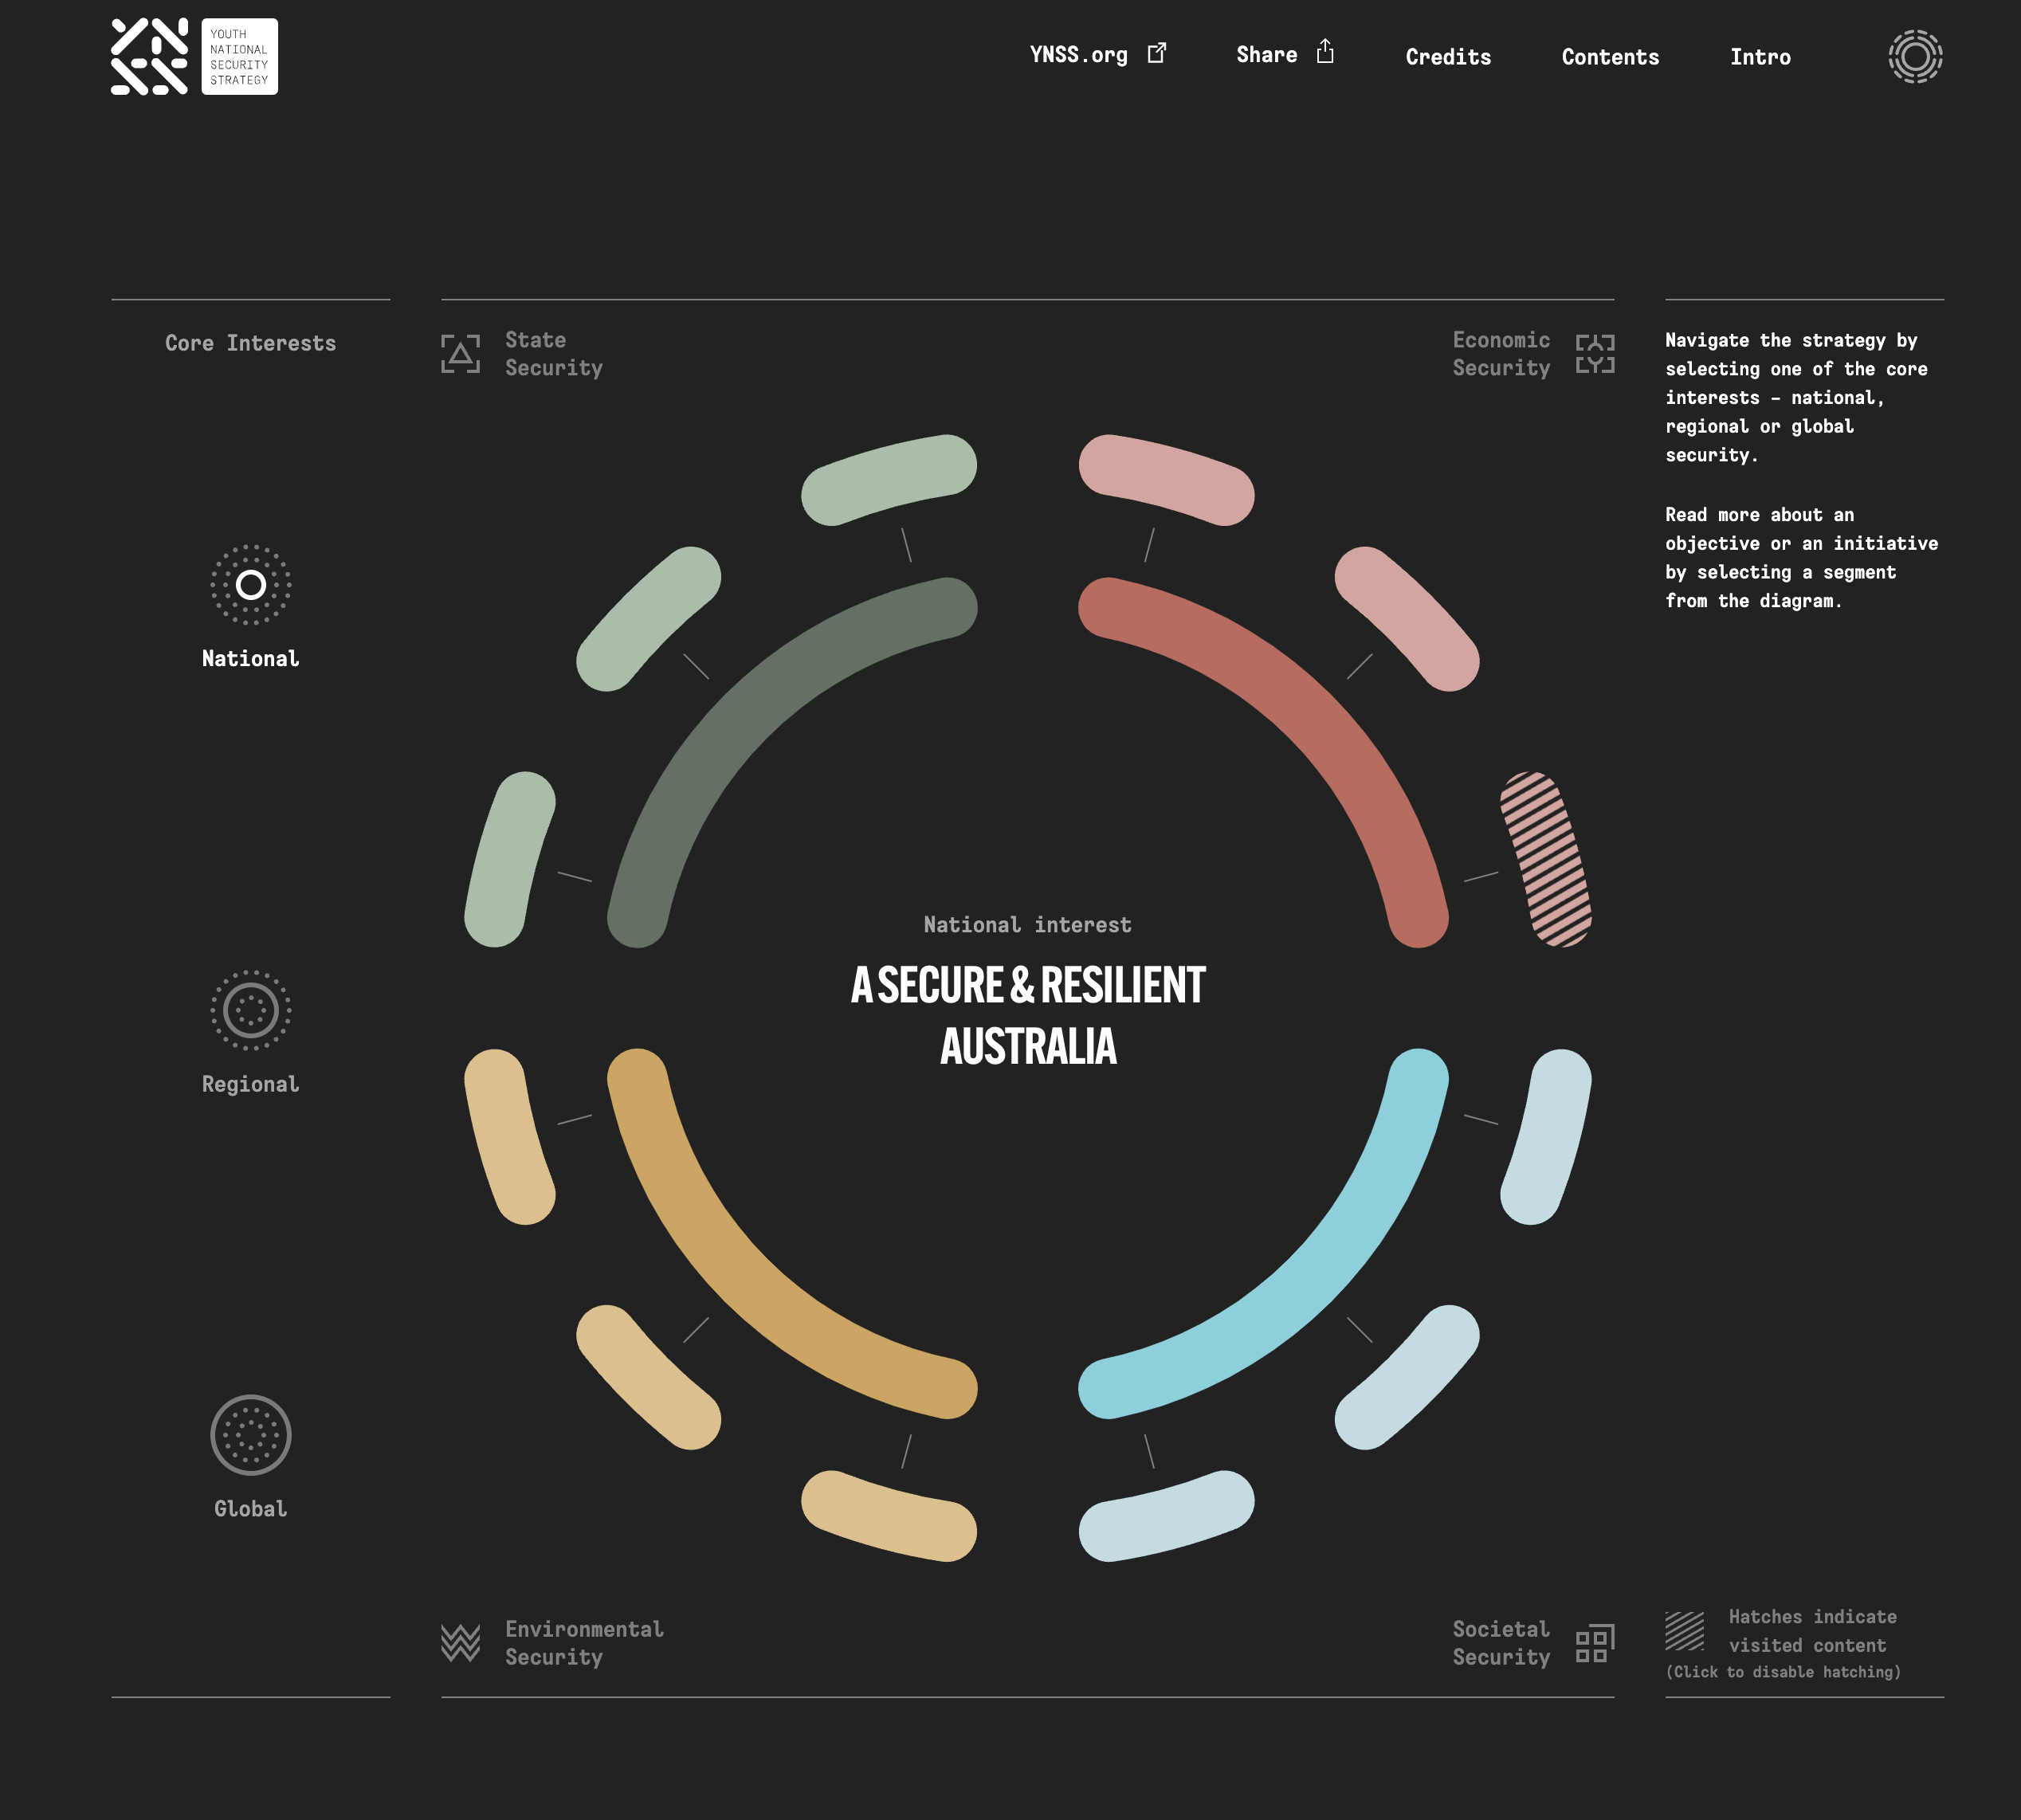
Youth National Security Strategy
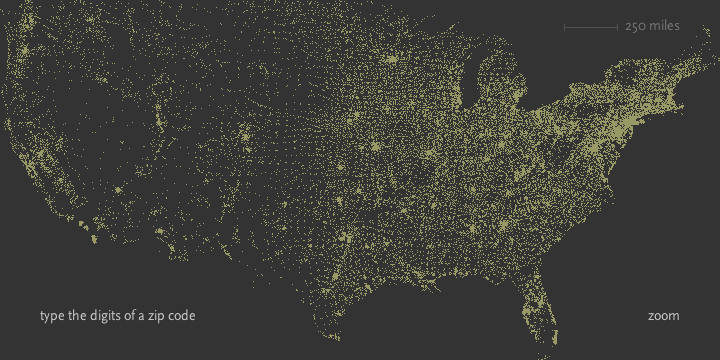
Zipdecode
Ben Fry