Description
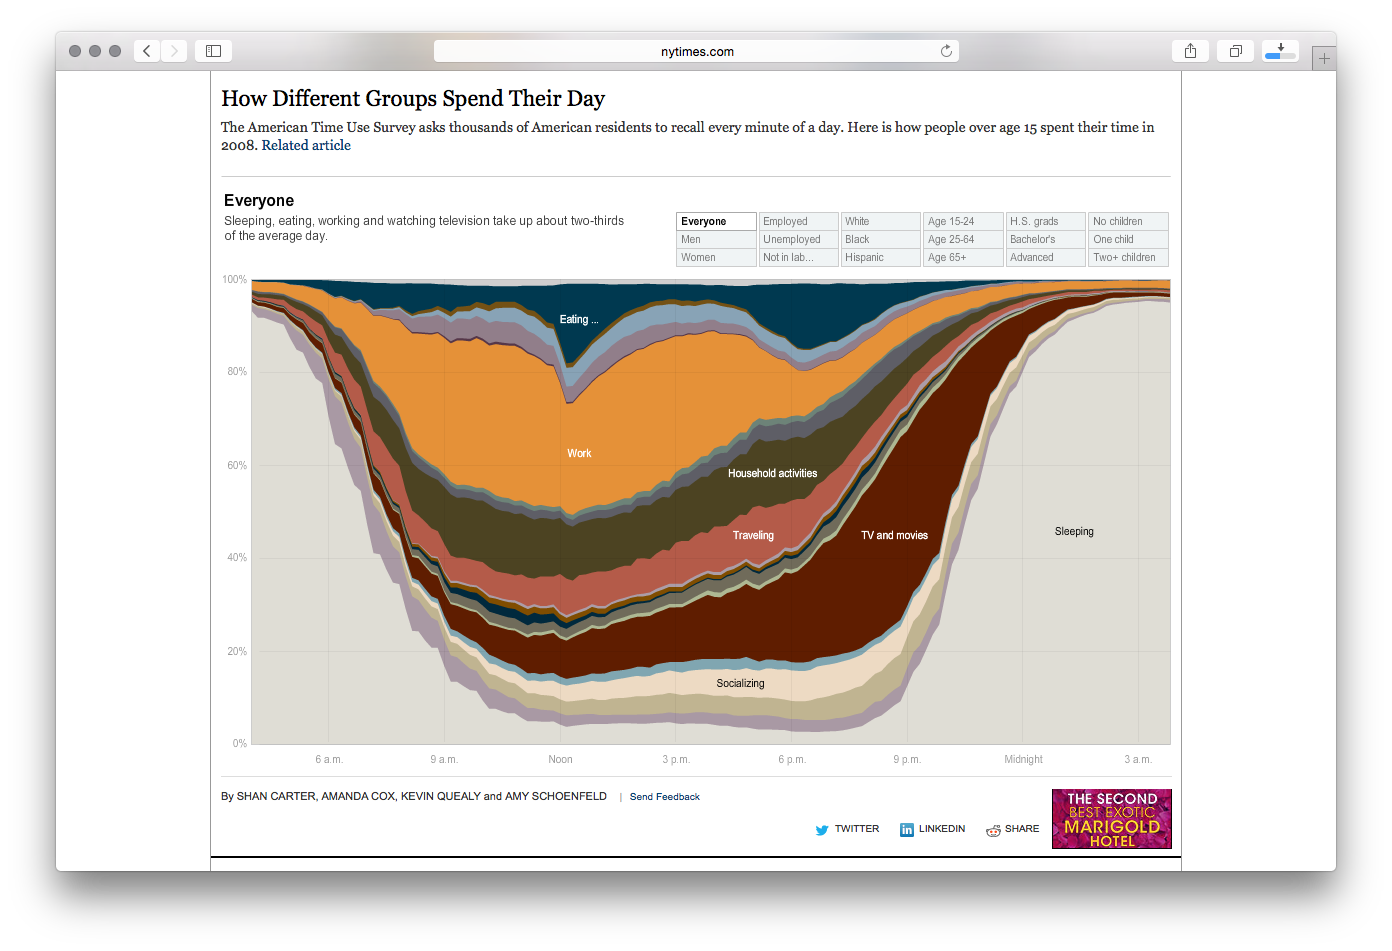
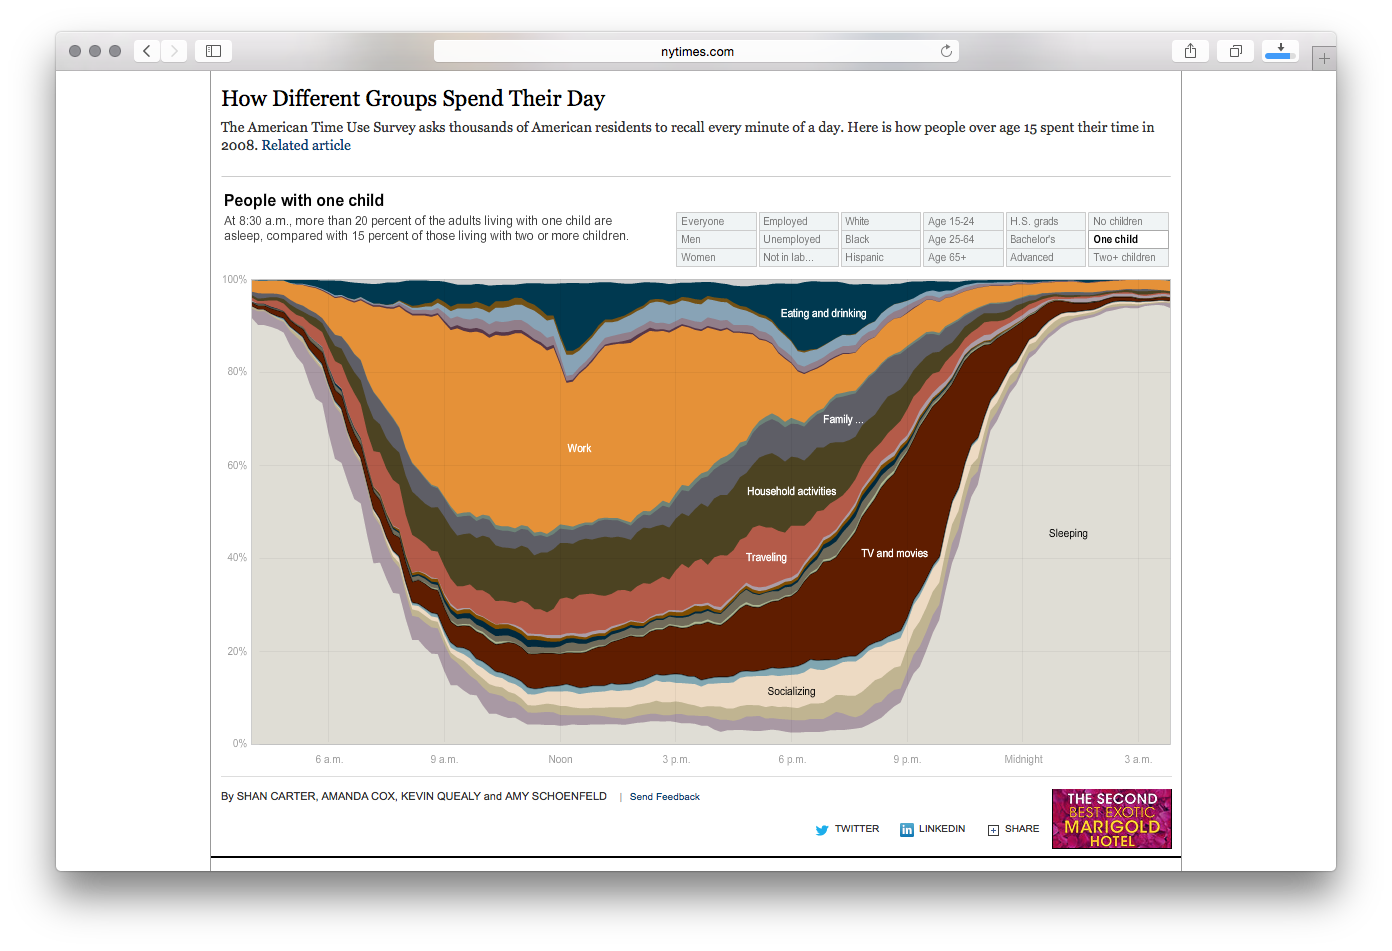
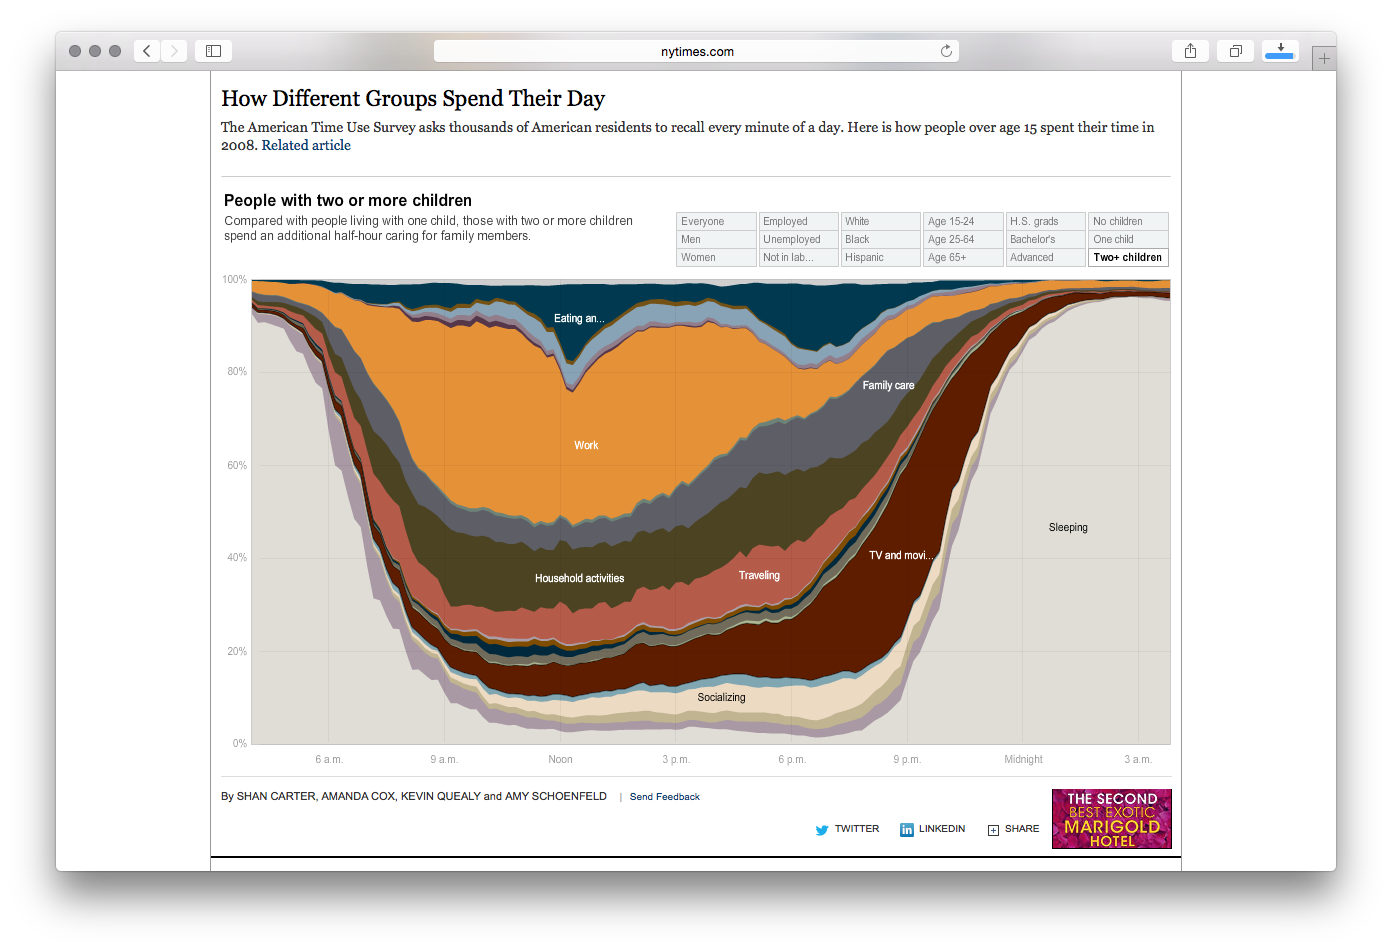
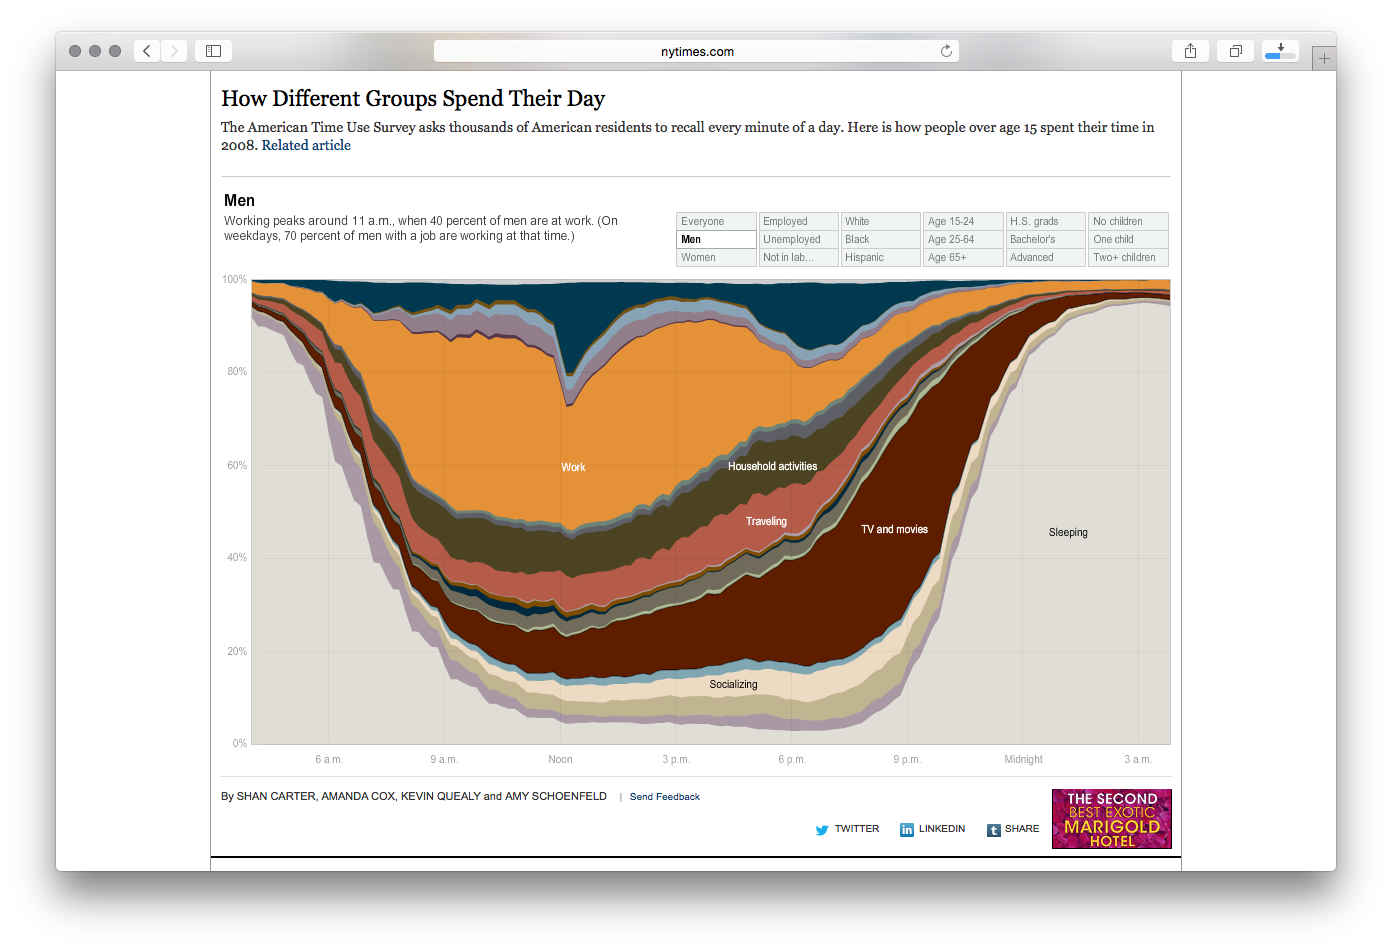
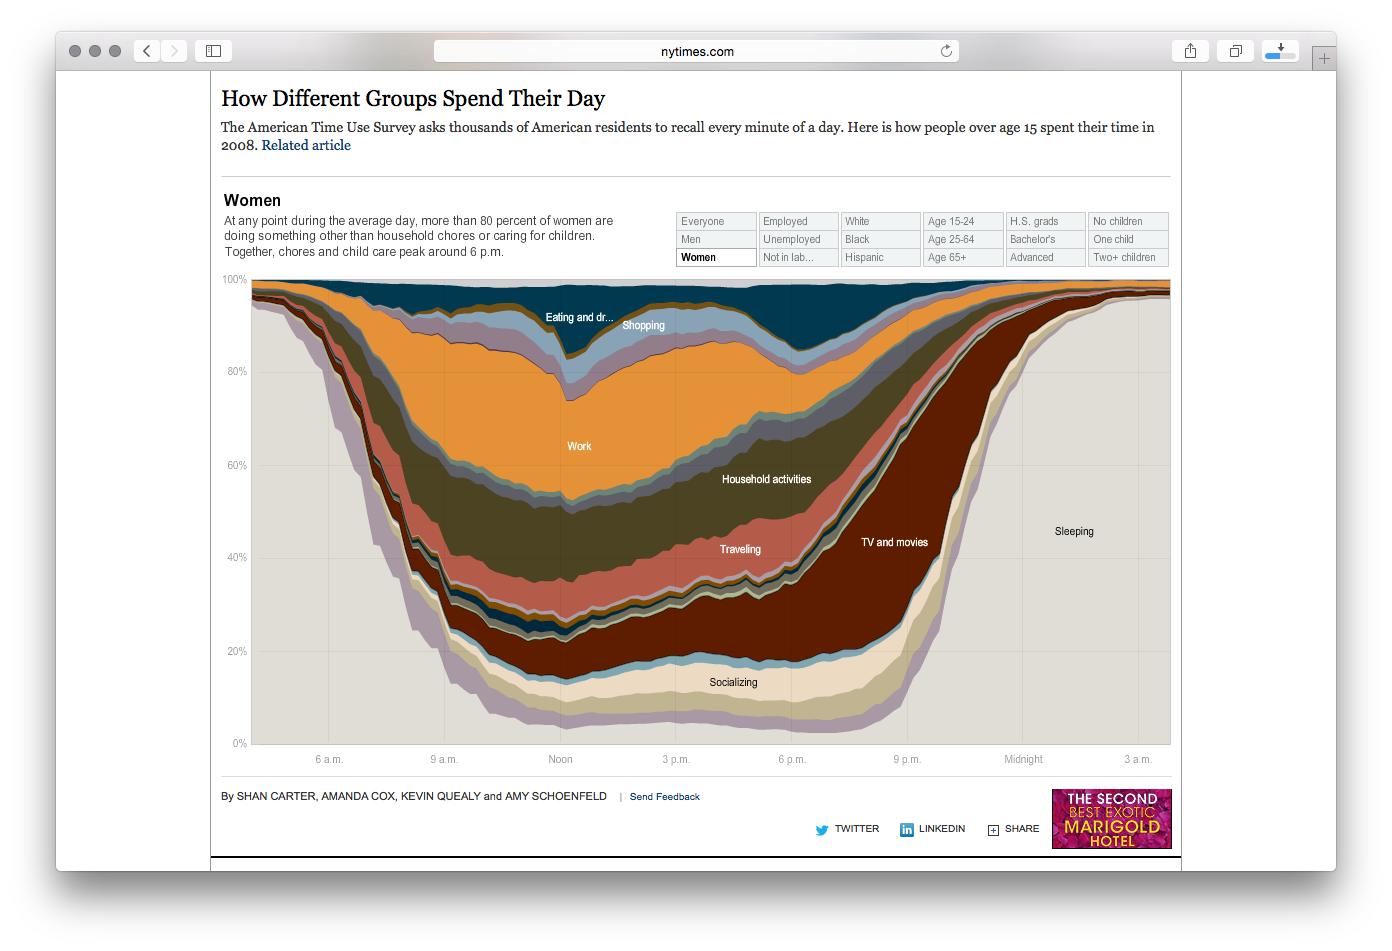
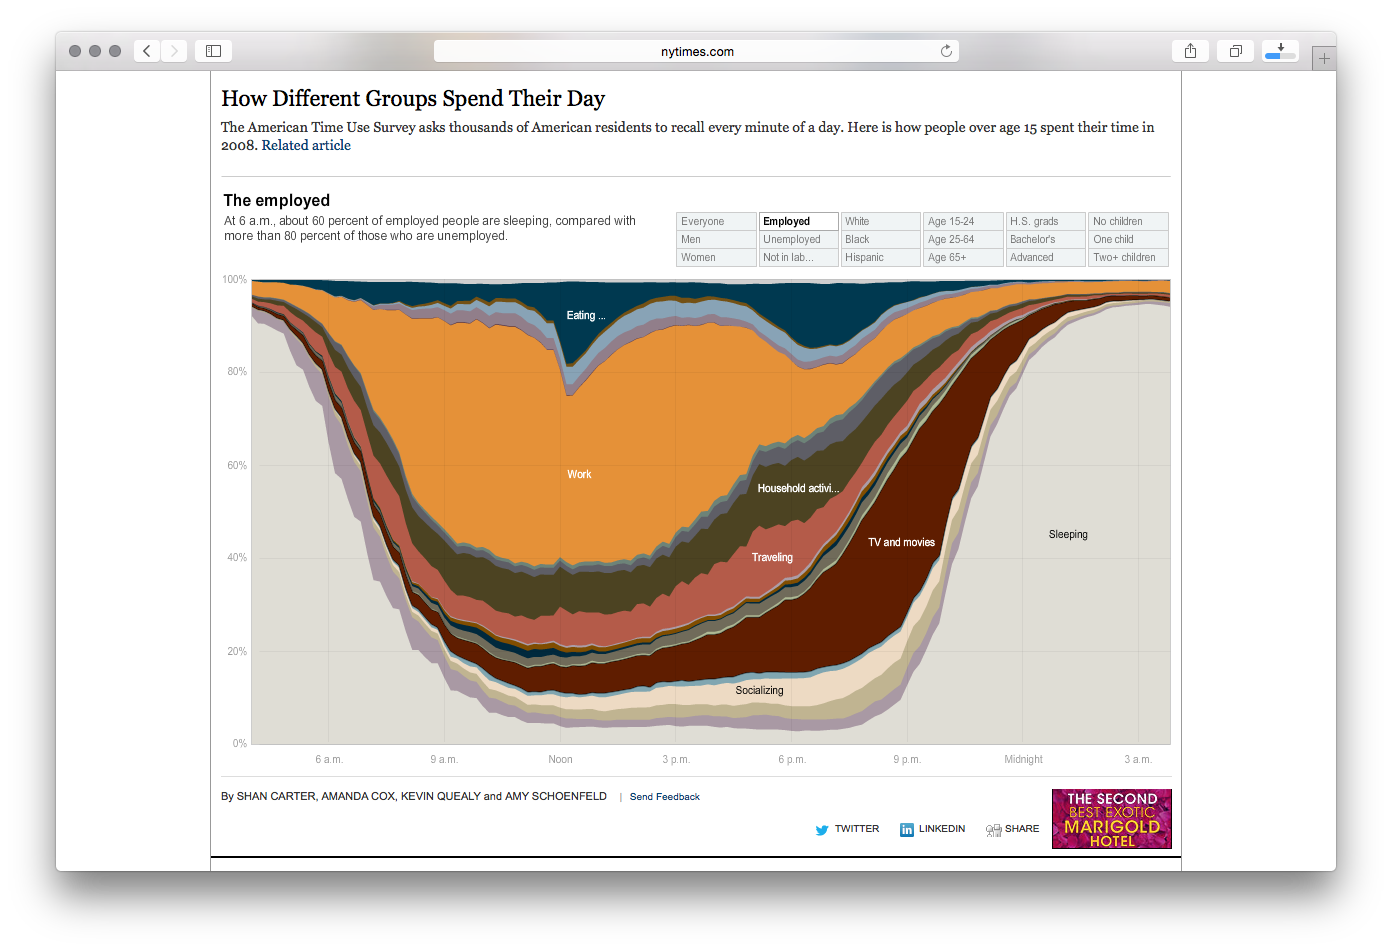
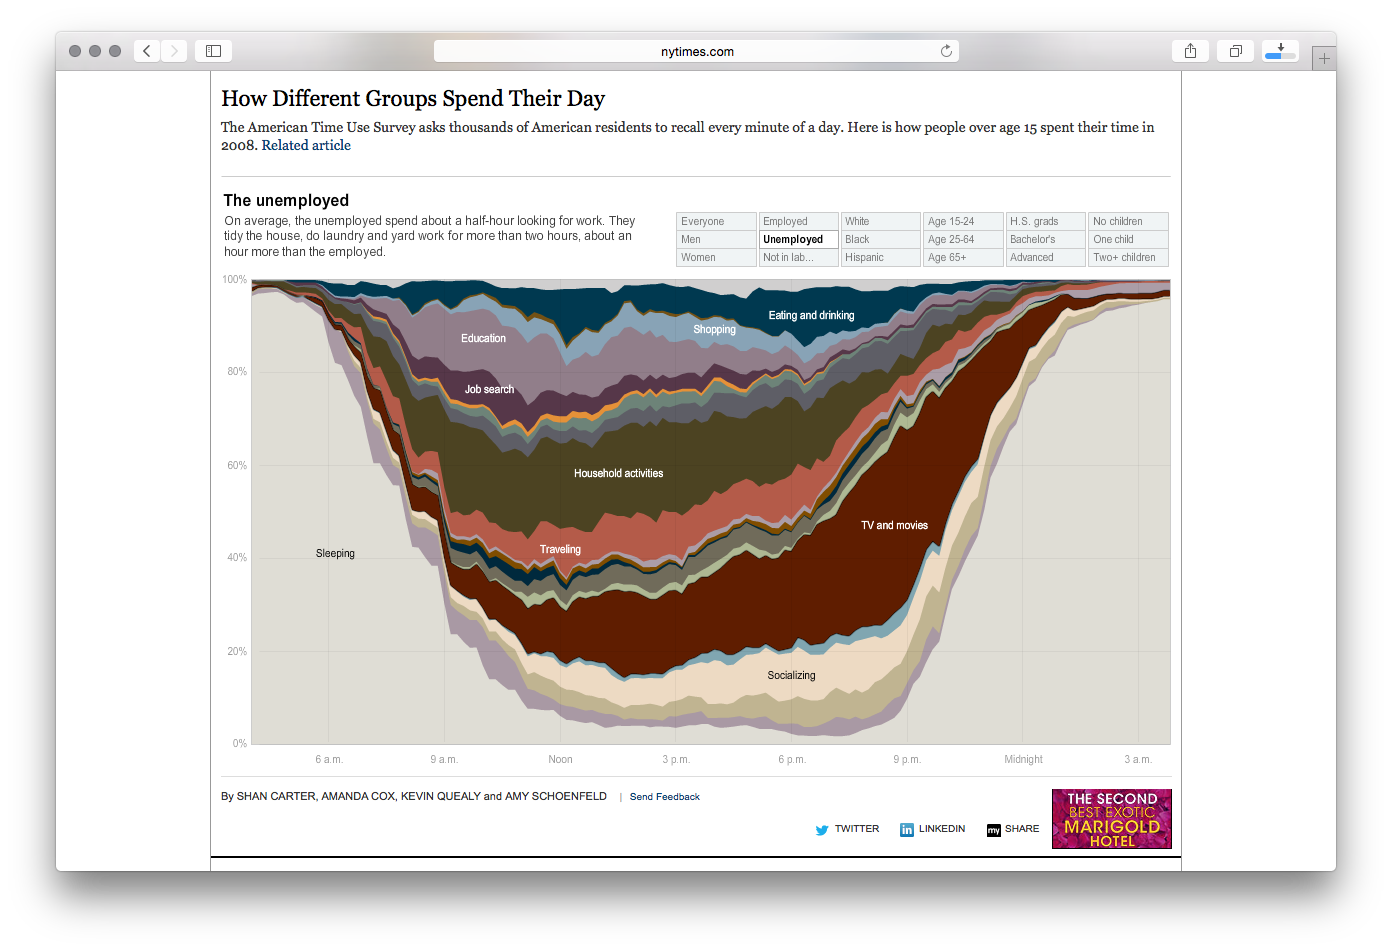
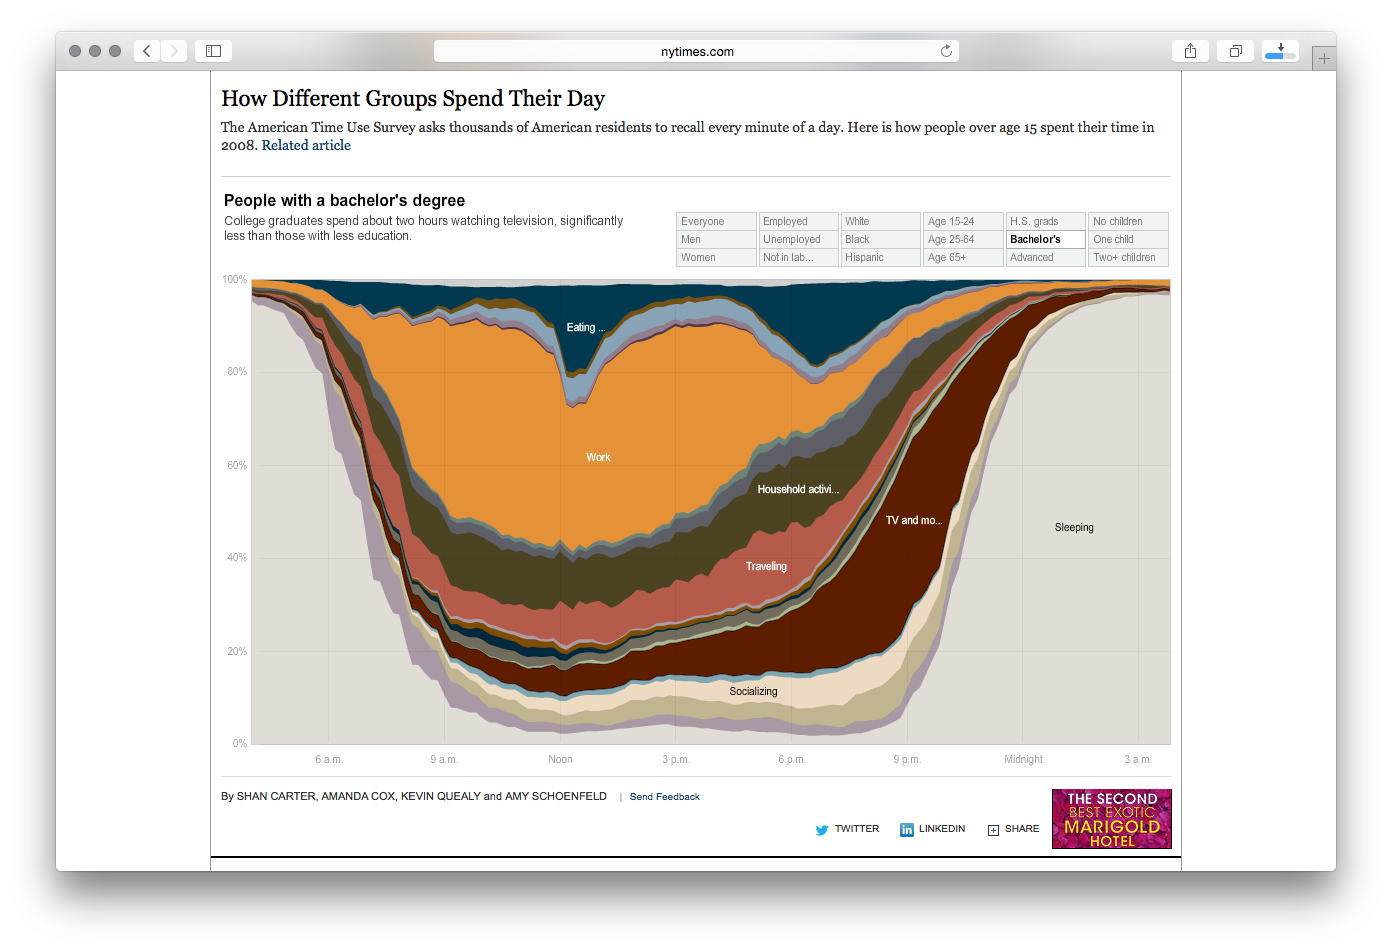
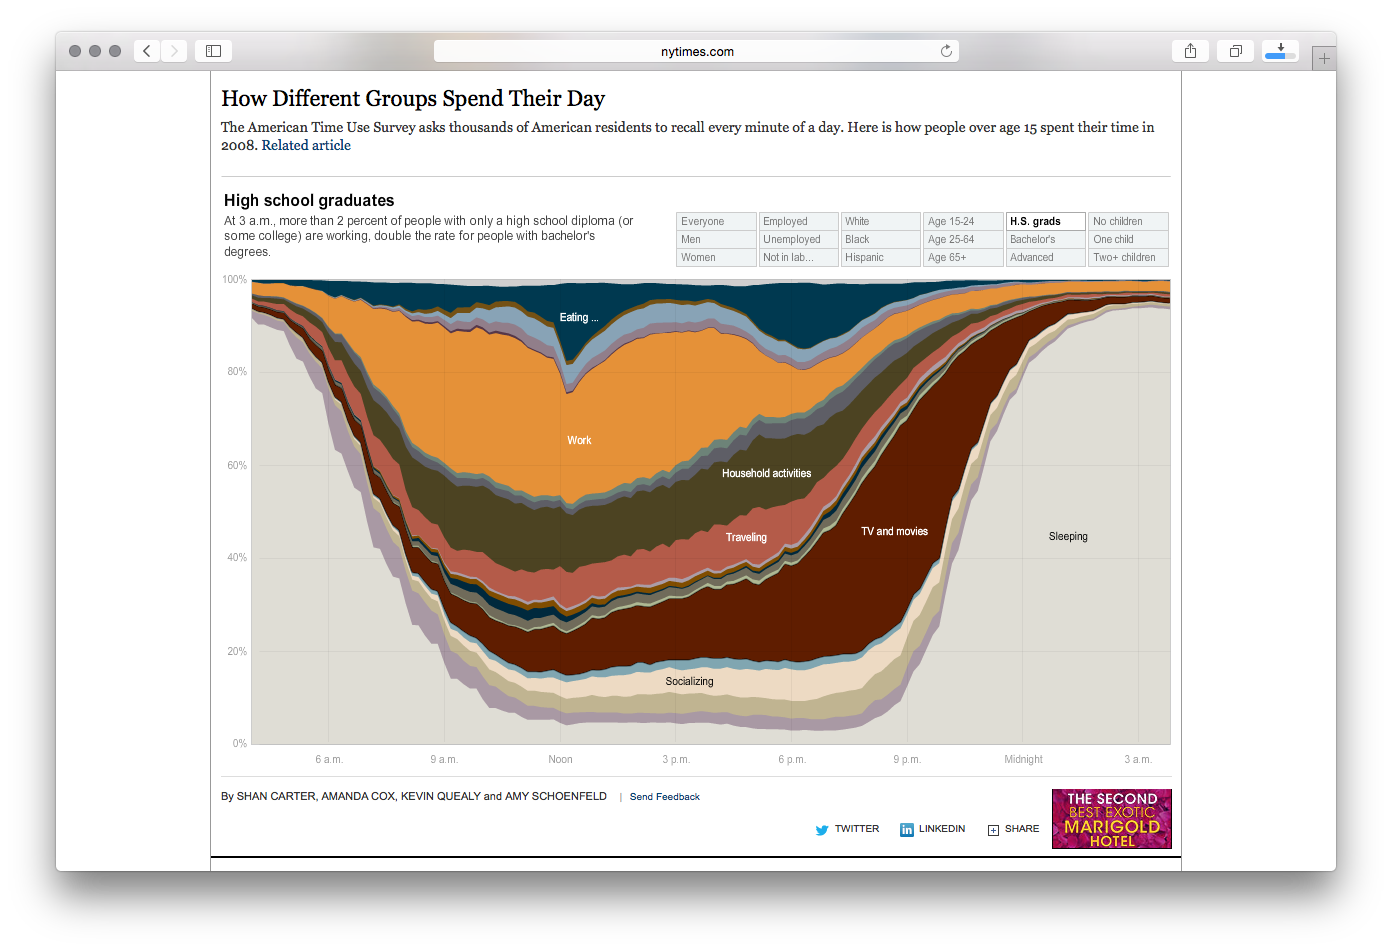
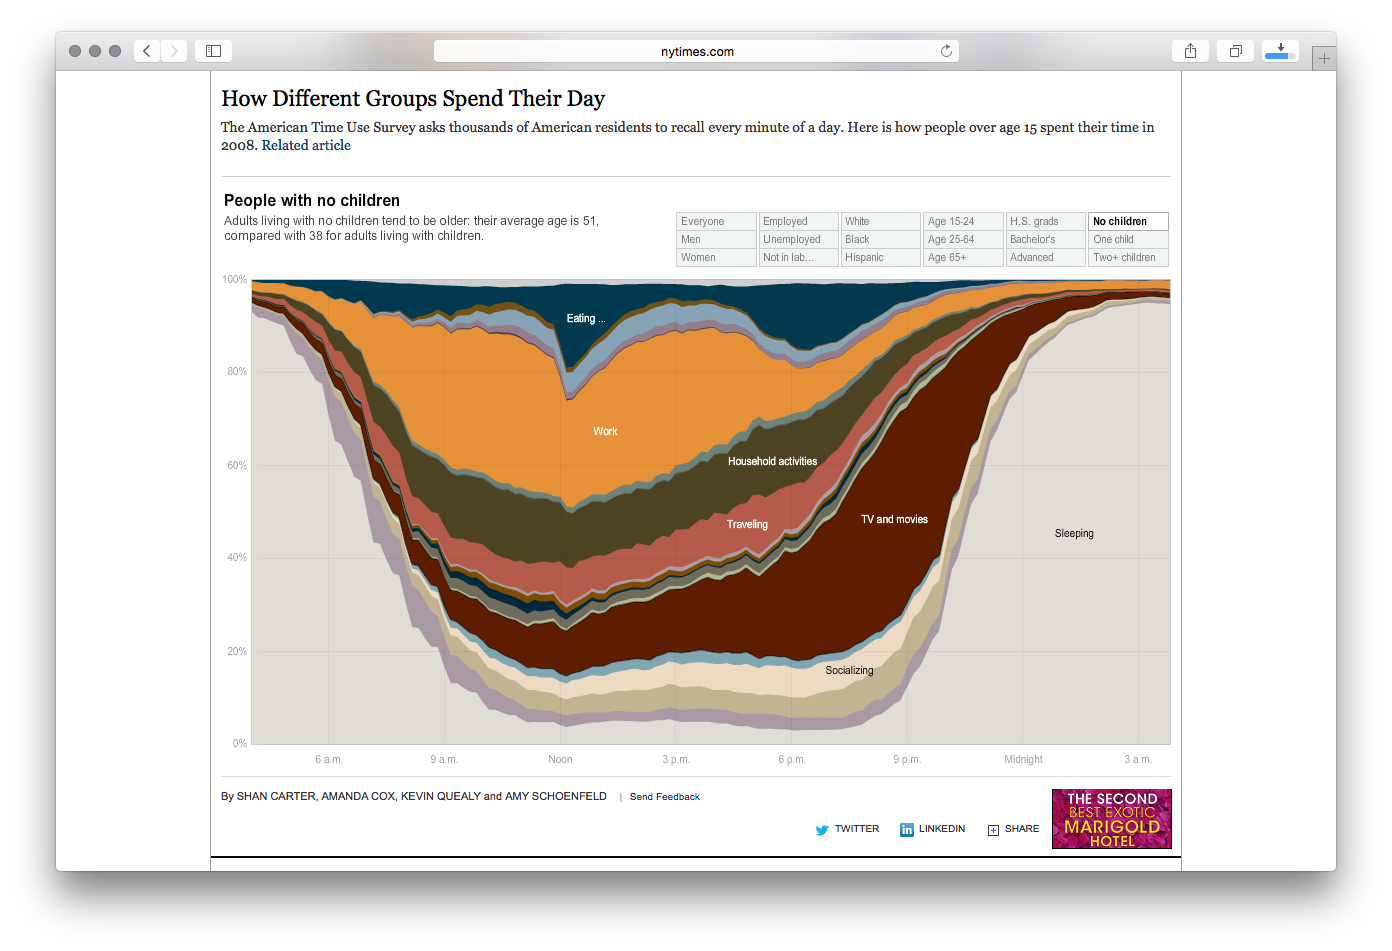
New York Times visualization of American Time Use Survey data, showing how different demographic groups allocate their daily hours to work, leisure, sleep, and other activities. Based on Bureau of Labor Statistics data from the ATUS survey, the interactive allows users to compare how employed vs. unemployed, men vs. women, young vs. old, and other groups spend a typical day across categories including personal care, eating, housework, childcare, education, and recreation. The stacked area chart format makes it easy to see at a glance how time allocation shifts across demographics, revealing patterns in American daily life.