Description
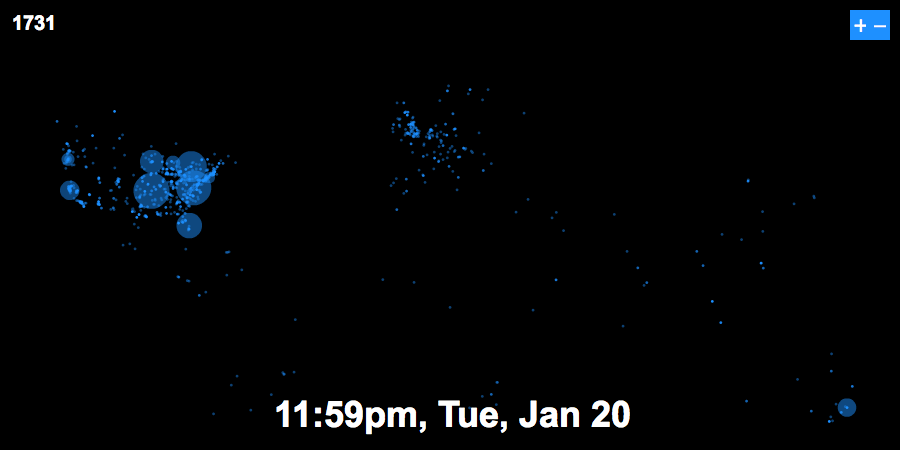
Visualization of Twitter activity during Barack Obama's 2009 presidential inauguration on January 20, featured on Nathan Yau's FlowingData. The visualization shows tweets plotted on a map starting early Monday morning, with increasing volume building through the ceremony as Obama was sworn in as the 44th president. The graphic captured a pivotal moment when social media and historic events converged — Twitter was still a relatively new platform (launched 2006) and the inauguration generated unprecedented tweet volume, famously crashing the service at peak moments. The visualization demonstrated how geographic social media data could capture the pulse of a national event in real time.