Description
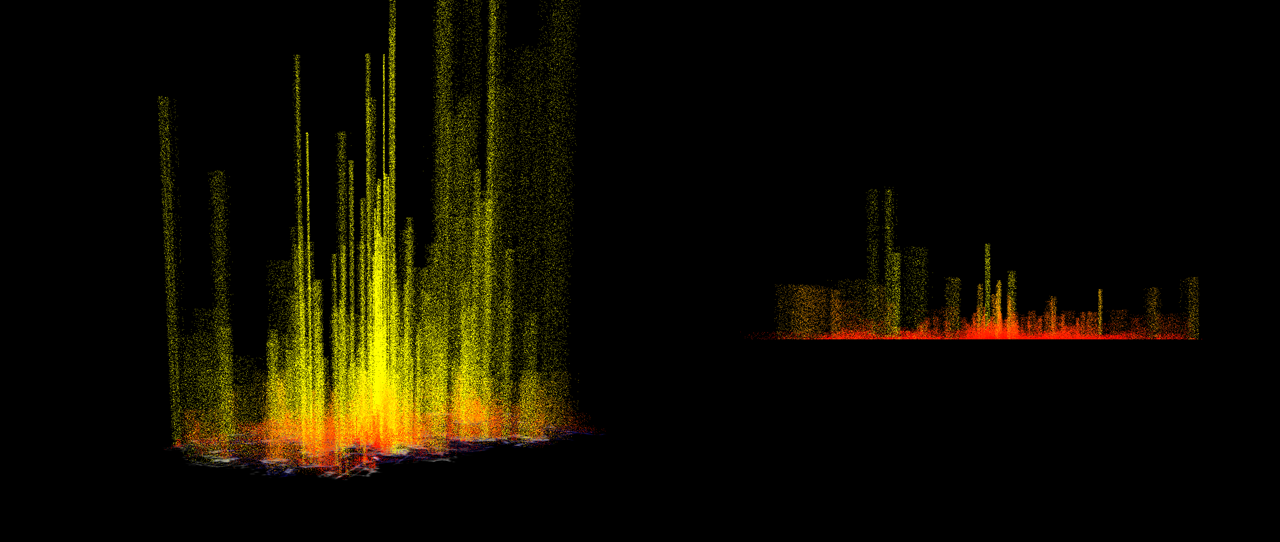
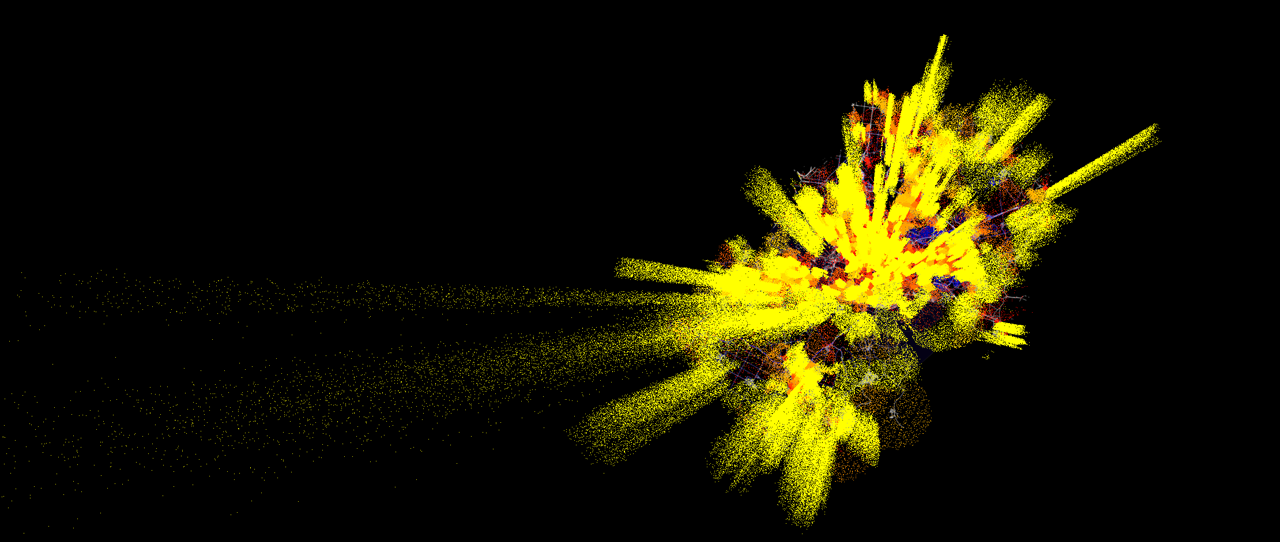
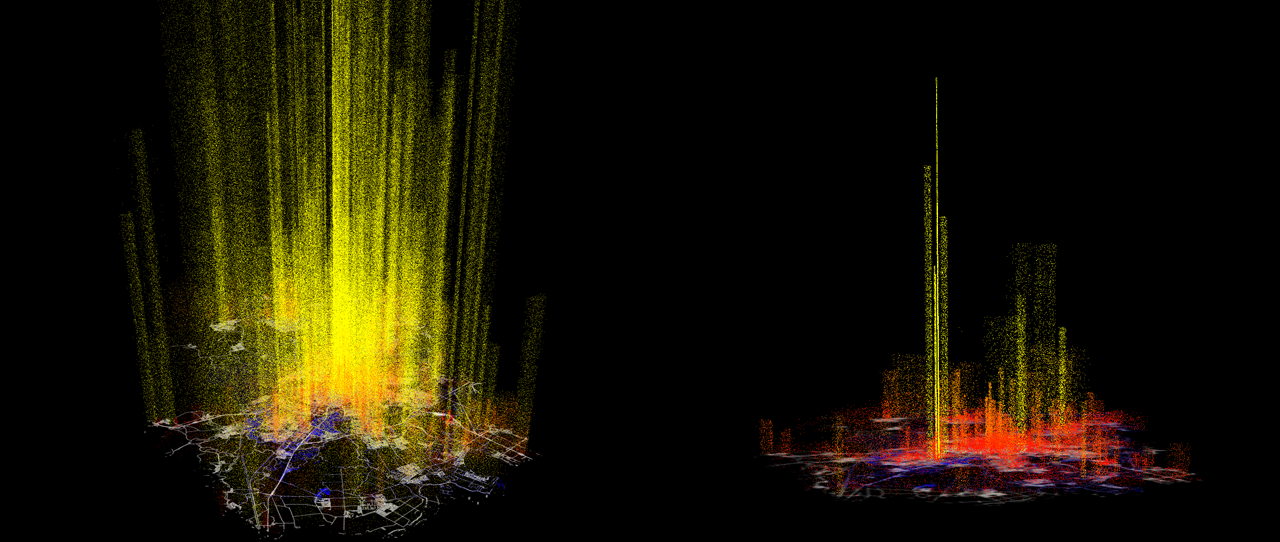
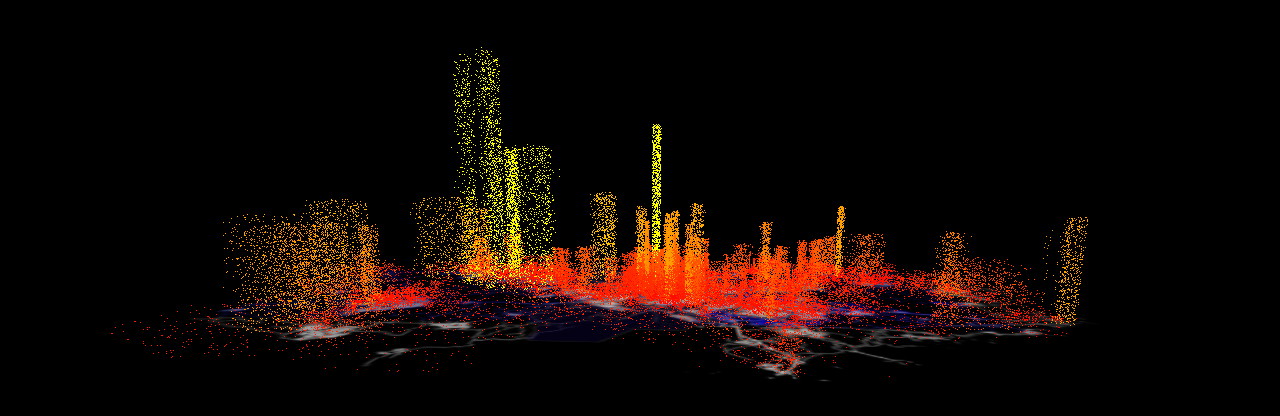
Visualization of global New Year's Eve celebrations through Twitter activity, tracking "Happy New Year" tweets sweeping across time zones from east to west as midnight arrives in each region. The animation reveals the rolling wave of celebration circling the globe over 24 hours, with spikes of activity as major cities reach midnight. A well-known version was created by Twitter's data visualization team, as featured on FlowingData; the creator attribution to Aaron Koblin may be incorrect — Koblin was Google's Creative Director of the Data Arts Team, not Twitter's. The visualization became a recurring annual feature, demonstrating how social media data can capture synchronized global human behavior.