Description
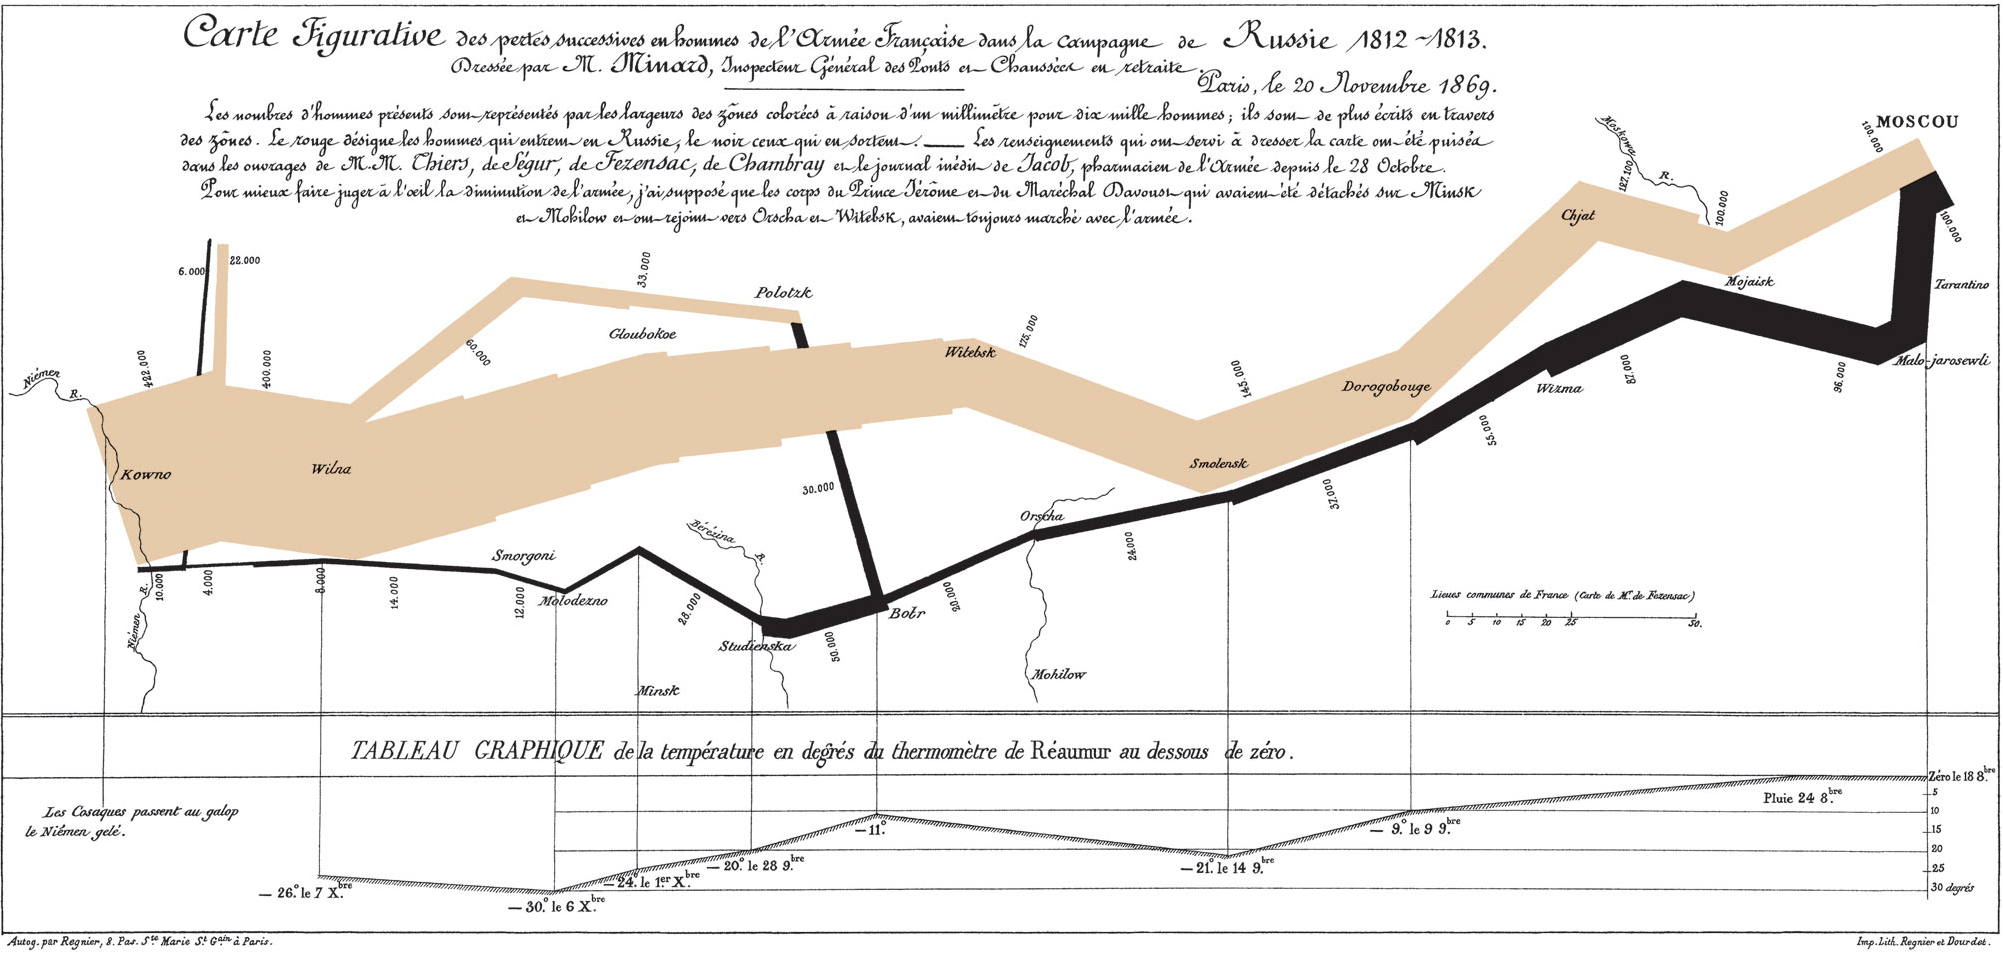
Charles Joseph Minard's 1869 flow map depicting Napoleon's catastrophic 1812 Russian campaign, often cited as one of the best statistical graphics ever made. The lithograph encodes six variables simultaneously: the army's size (band width), geographic location (x/y coordinates), direction of travel (color: tan for advance, black for retreat), and temperature during the retreat (scale at bottom). It shows the Grande Armée diminishing from 422,000 soldiers at the Polish border to 100,000 at Moscow, and collapsing to just 10,000 by the return. Edward Tufte called it "probably the best statistical graphic ever drawn." Minard (1781-1870) was a French civil engineer who created the chart at age 88.