Description
Dotspotting is the first project Stamen is releasing as part of Citytracking. There's currently a whole chain of elements involved in building digital civic infrastructure for the public, and these are represented by various Stamen projects and those of others. At the moment, the current hodgepodge of bits—including APIs [2] and official sources, scraped websites, sometimes-reusable data formats and datasets, visualizations, embeddable widgets etc.—is fractured, overly technical and obscure, held in the knowledge base of a relatively small number of people, and requires considerable expertise to harness. That is, unless you're willing to use generic tools like Google Maps. We want to change this. Visualizing city data shouldn't be this hard, or this generic.
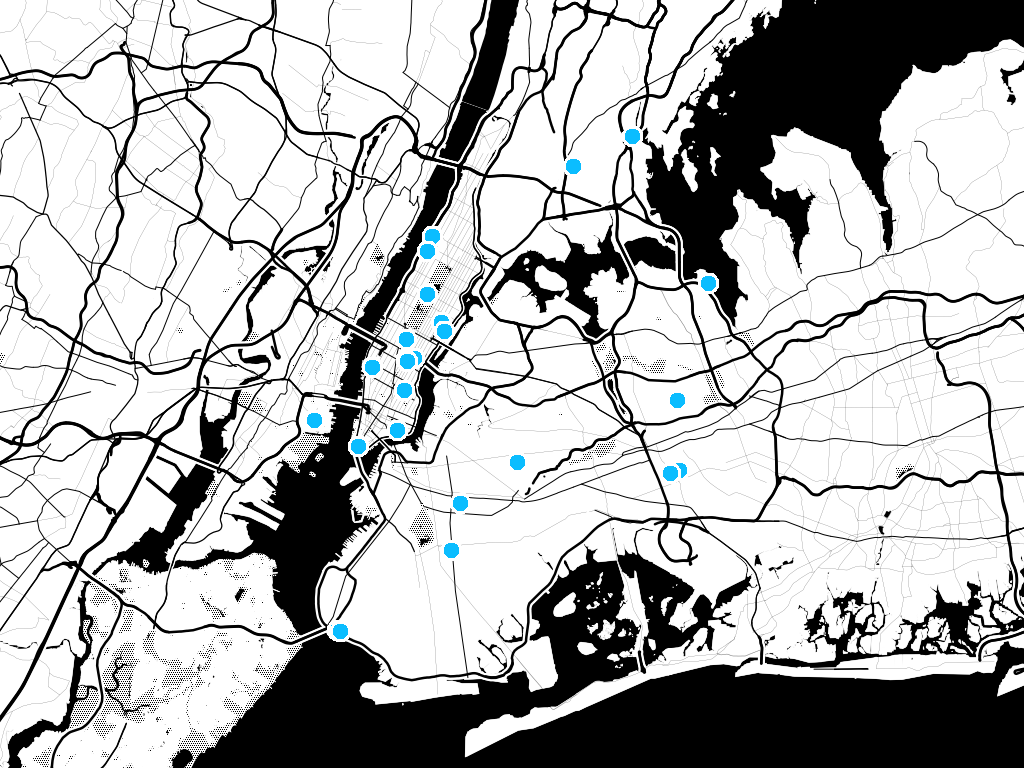
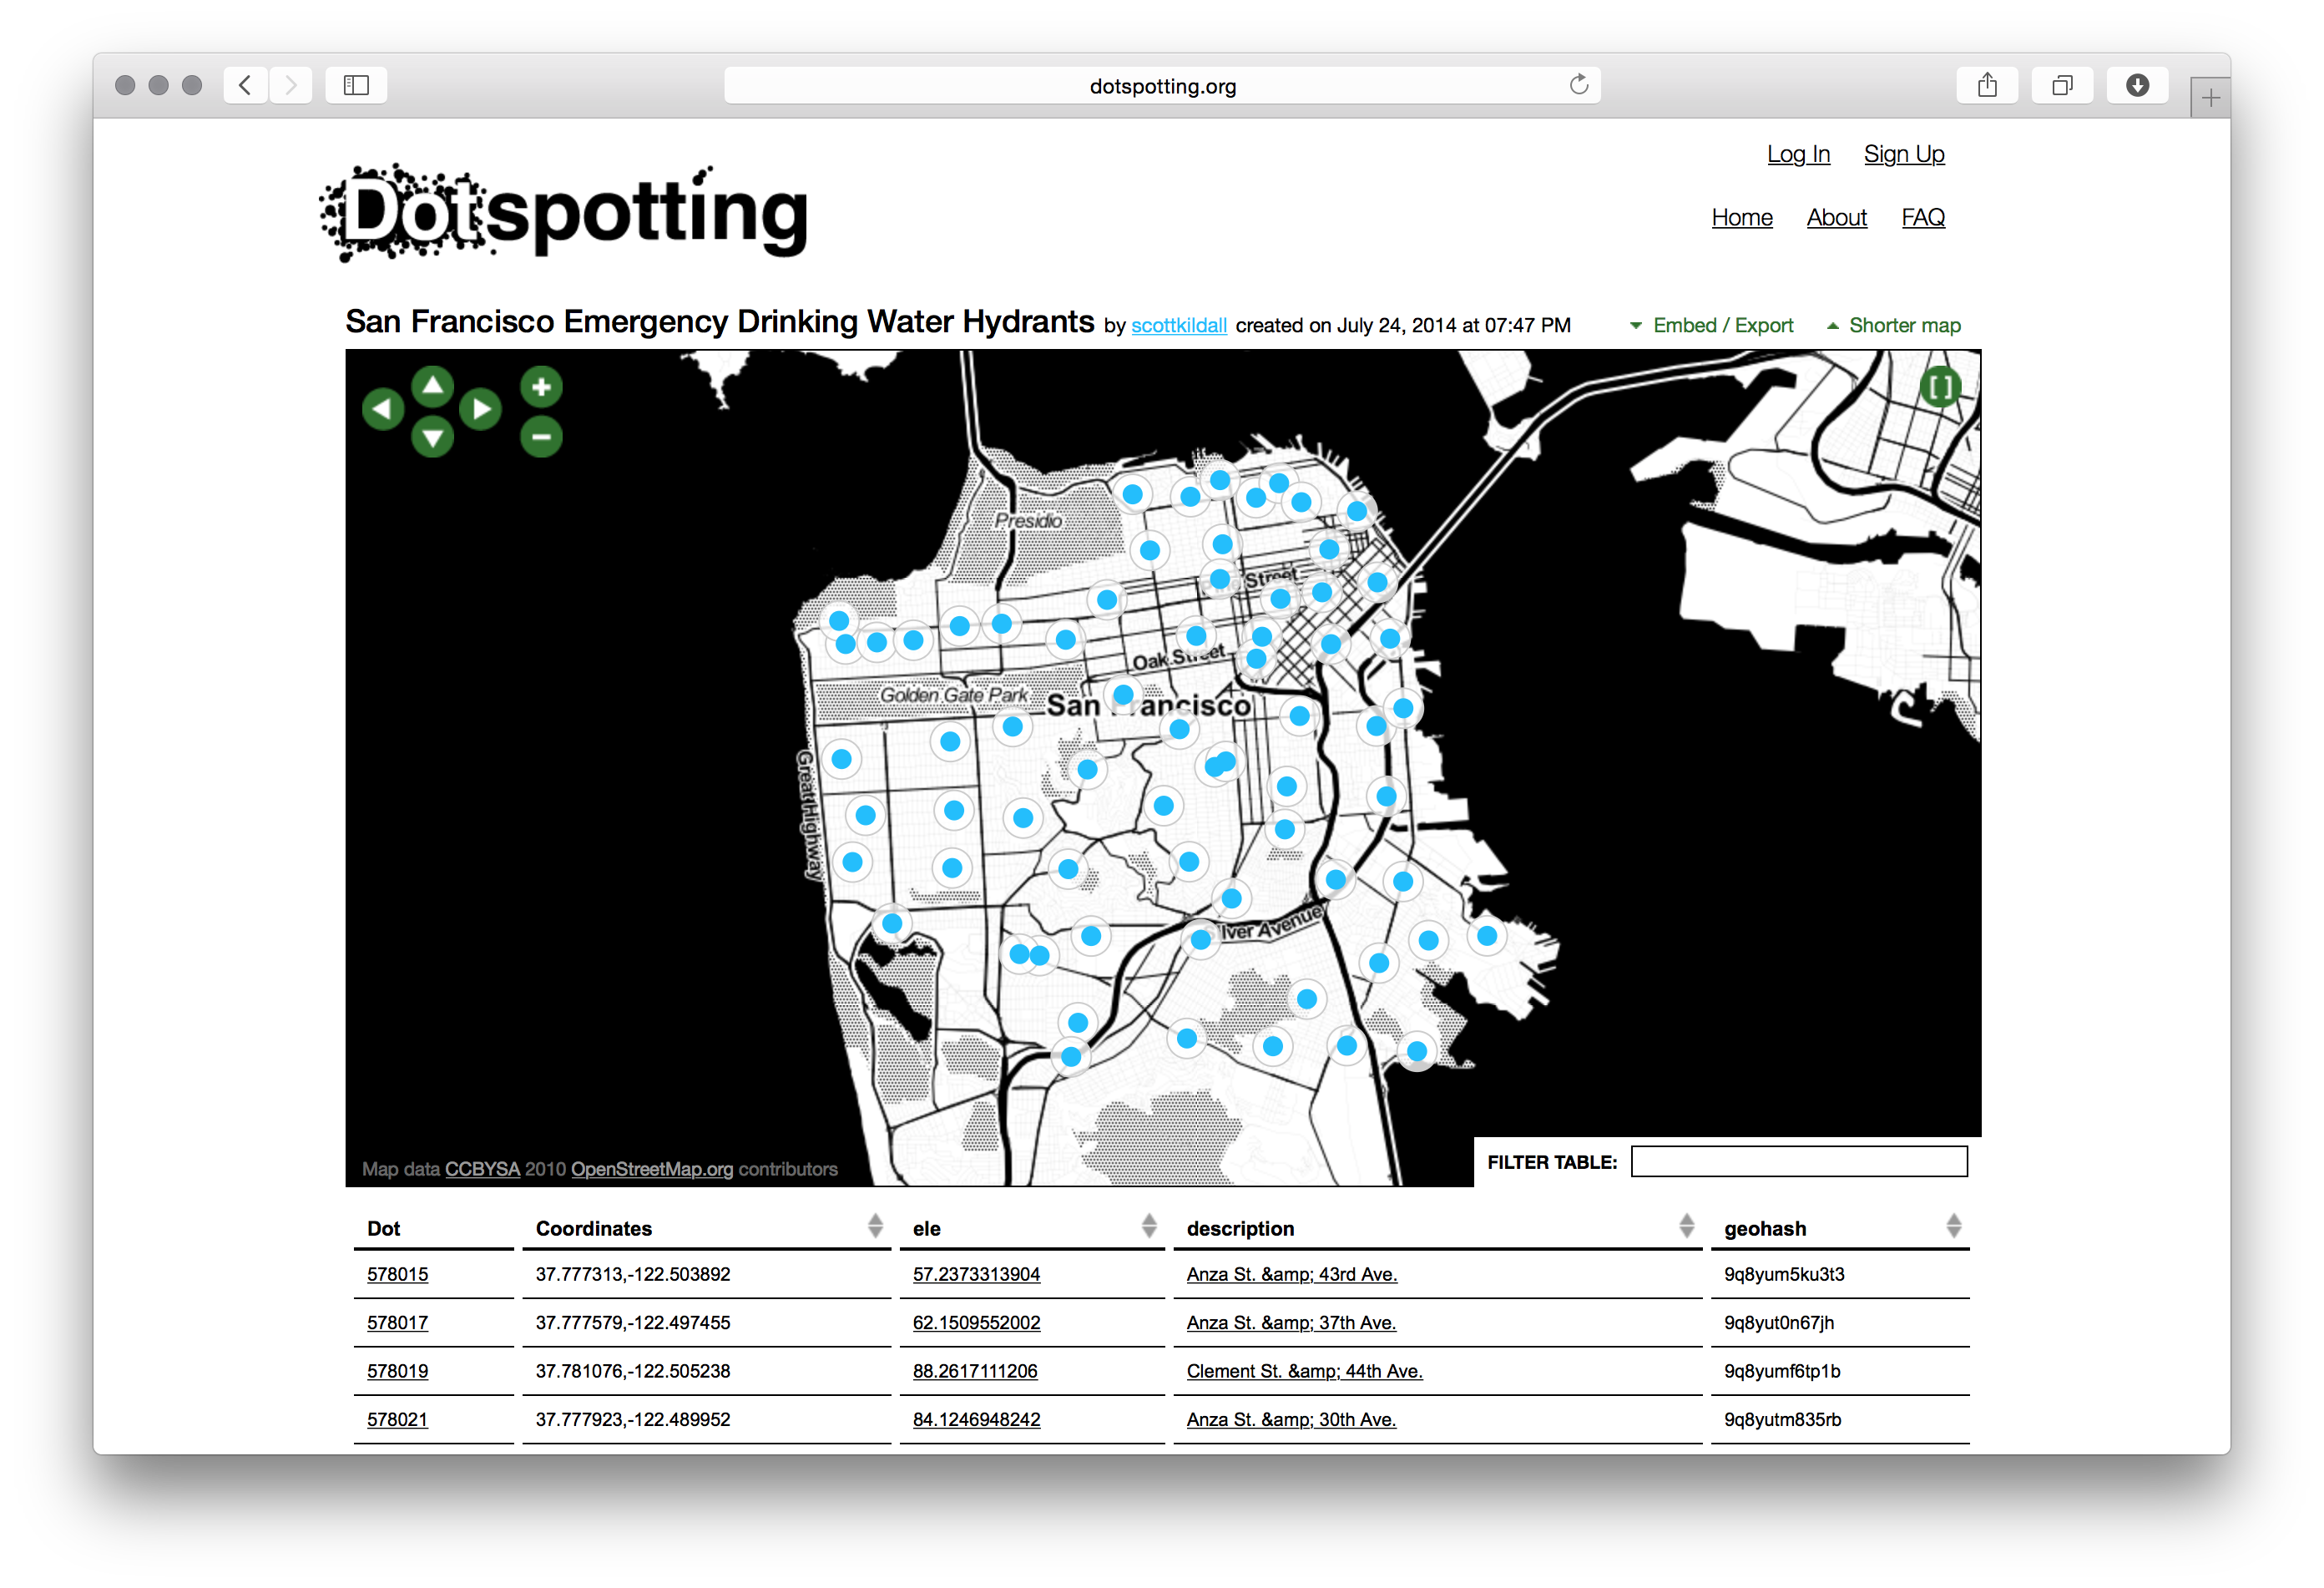
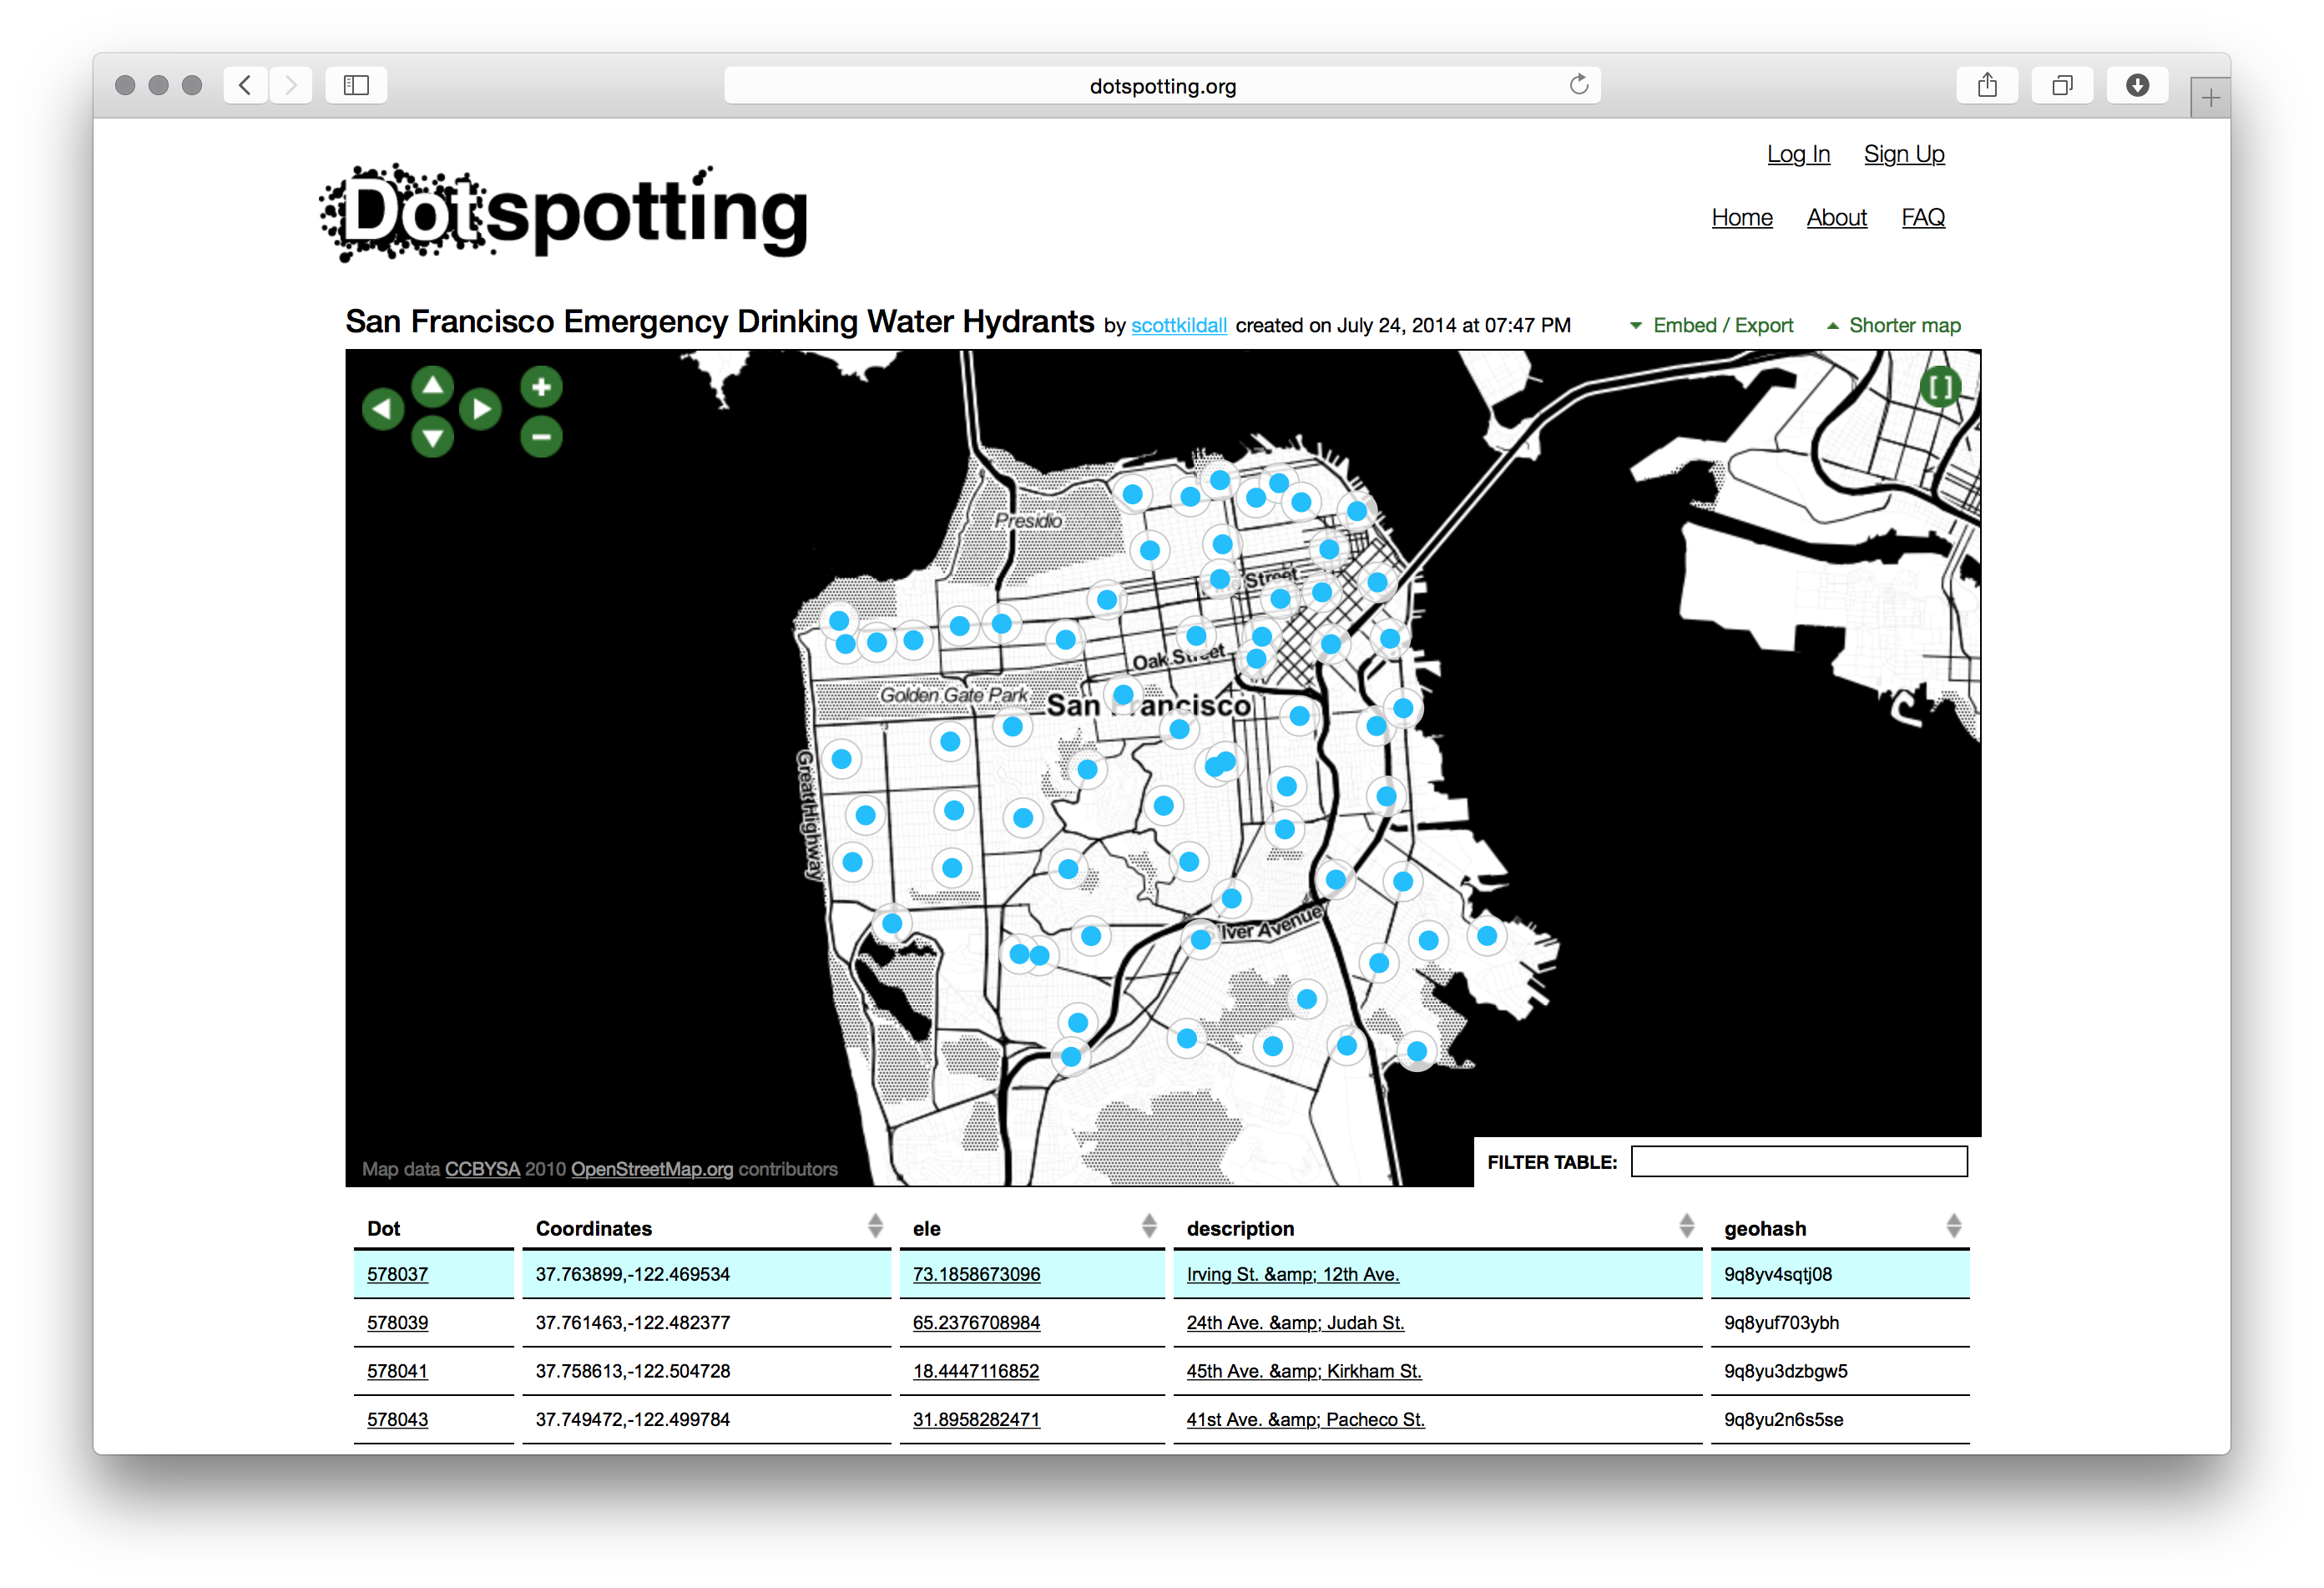
So the first part of this project is to start from scratch, in a 'clean room' environment. We've started from a baseline that's really straightforward, tackling the simplest part: getting dots on maps, without legacy code or any baggage. Just that, to start. Dots on maps.
But dots on maps implies a few other things: getting the locations, putting them on there, working with them, and—crucially—getting them out in a format that people can work with.