Description
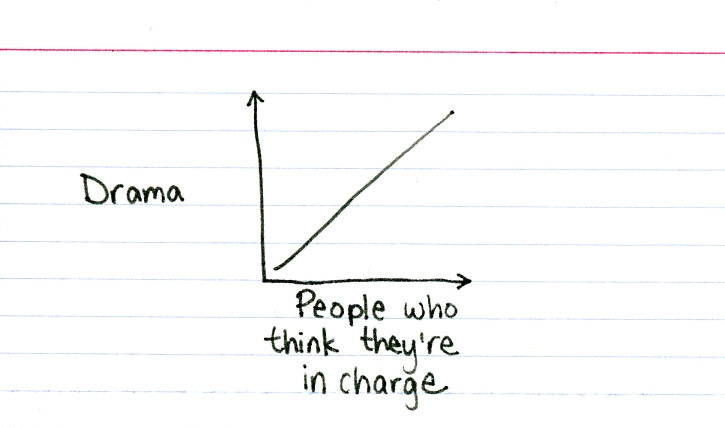
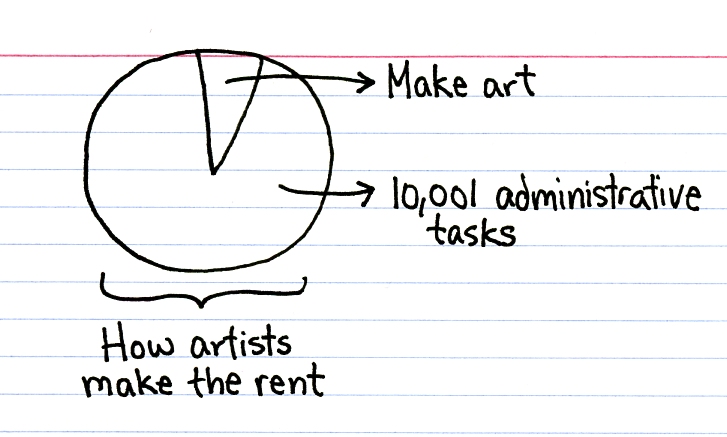
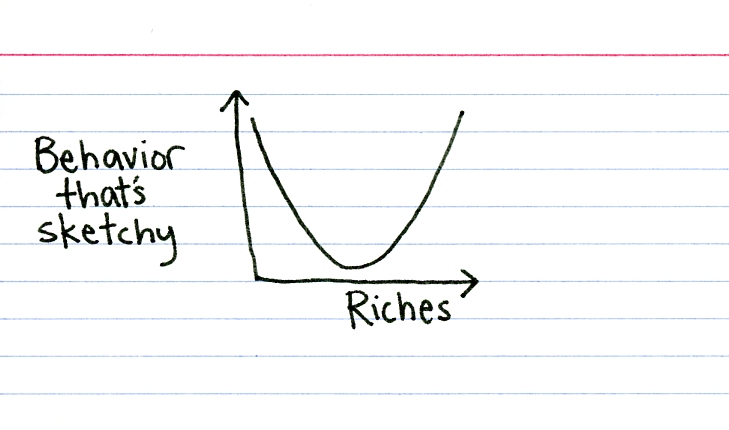
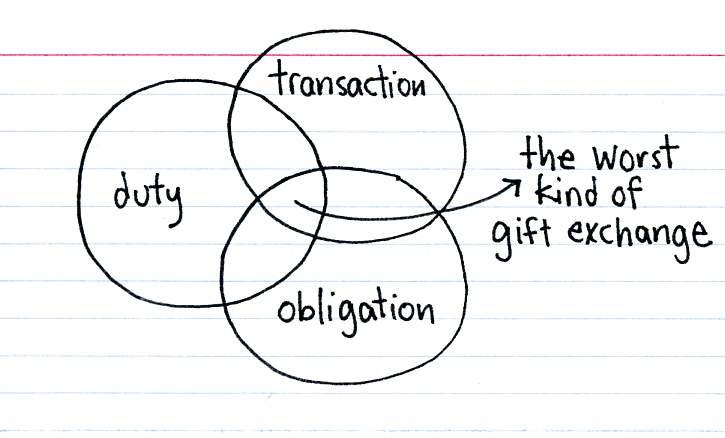
Hand-drawn Venn diagrams and graphs by Jessica Hagy exploring life, relationships, and society through simple but insightful data visualizations on index cards. The blog "Indexed" (thisisindexed.com) has been running since 2006, with Hagy posting a new card almost every weekday. Each one uses the visual language of charts — Venn diagrams, scatter plots, line graphs, bar charts — to make pithy observations about human behavior, culture, and modern life. Hagy published a book based on the blog in 2008. The project demonstrates how the basic vocabulary of data visualization can be repurposed as a medium for humor, philosophy, and social commentary with minimal means.