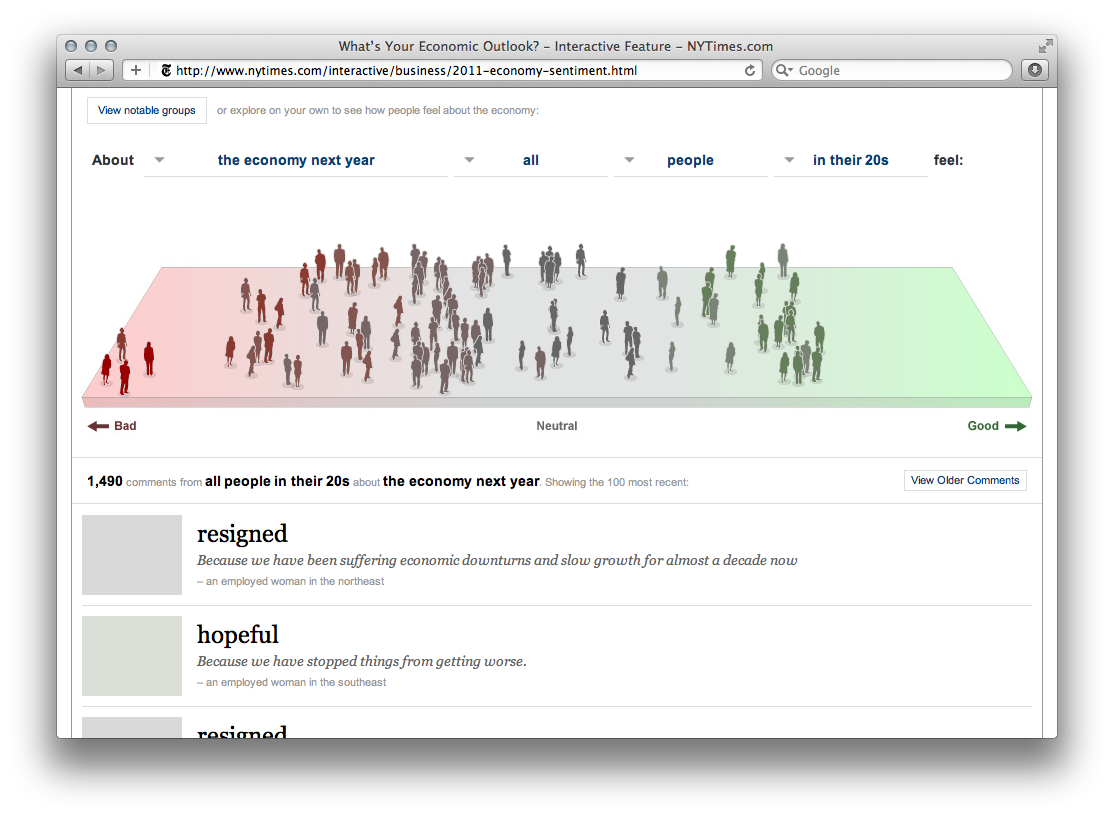
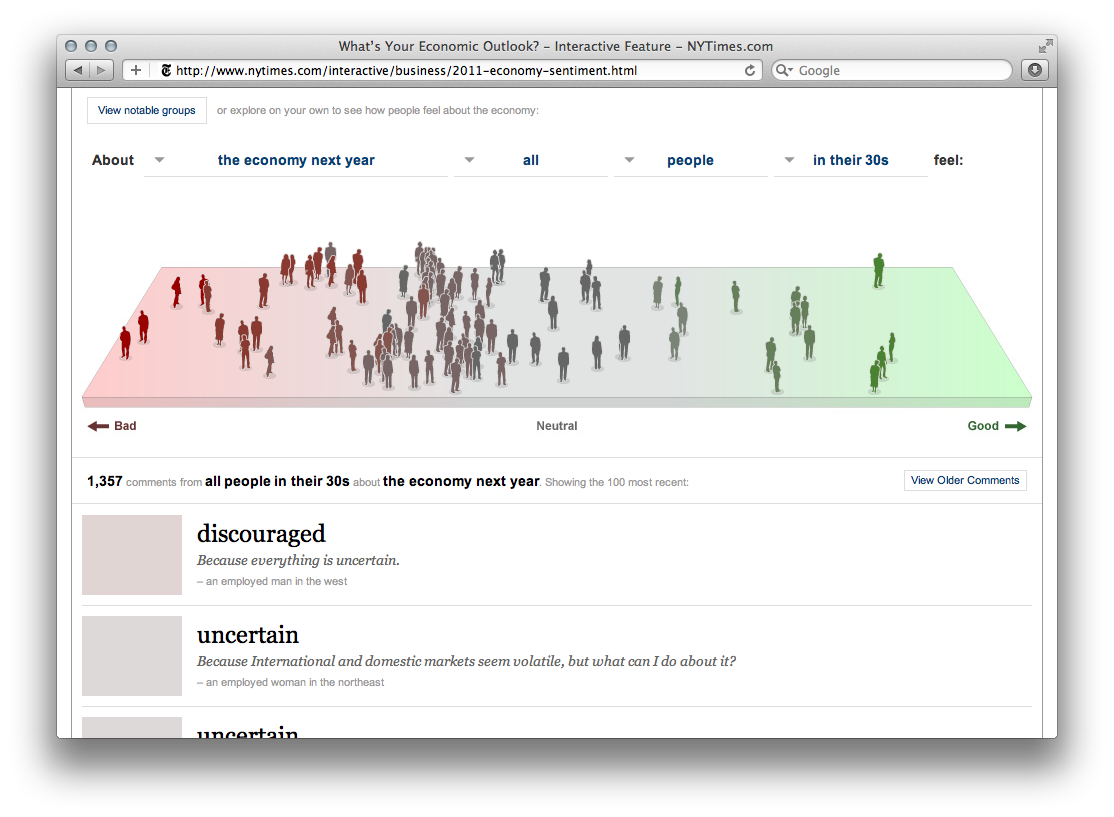
Description
New York Times visualization of economic indicators and forecasts, presenting complex financial data accessibly. The NYT graphics desk, led by figures like Amanda Cox and Kevin Quealy, regularly produced interactive pieces tracking GDP growth, unemployment rates, housing markets, consumer confidence, and Federal Reserve policy decisions. These visualizations helped general readers understand economic trends that are typically communicated through dense government reports and financial jargon, using annotated line charts, small multiples, and interactive comparison tools. The work was especially prominent during and after the 2008 financial crisis, when public hunger for economic data visualization surged alongside economic anxiety.