Description
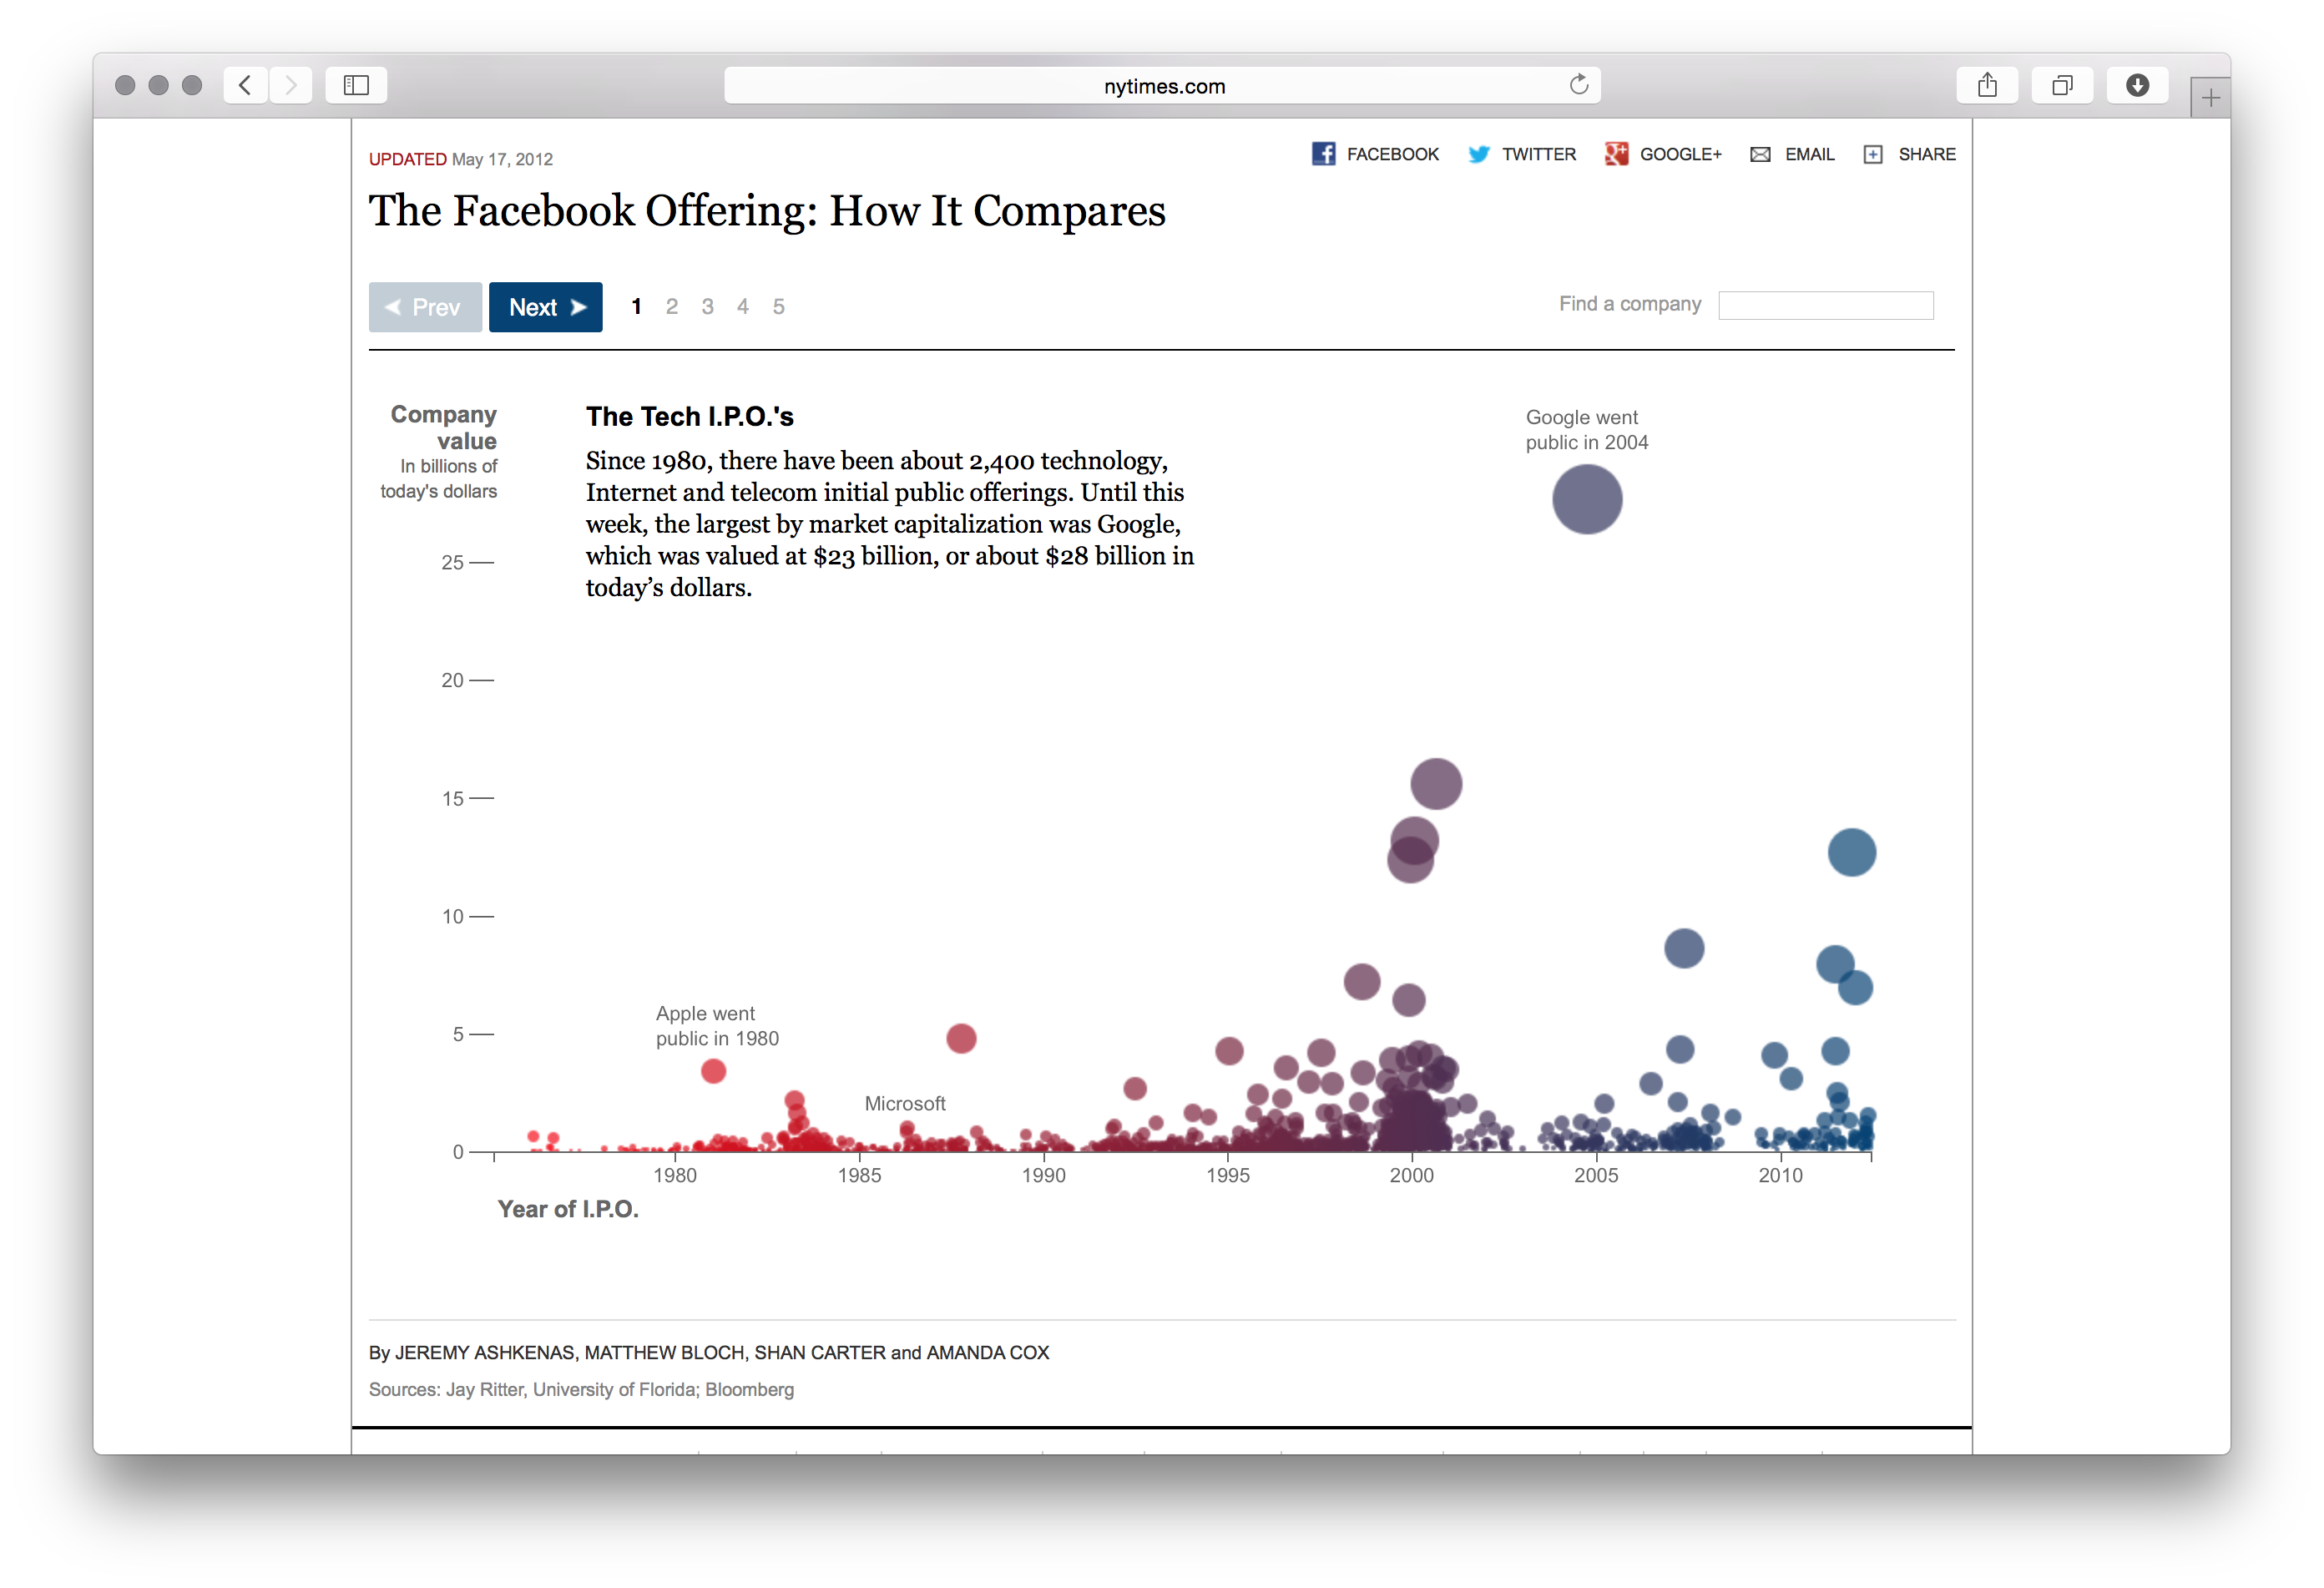
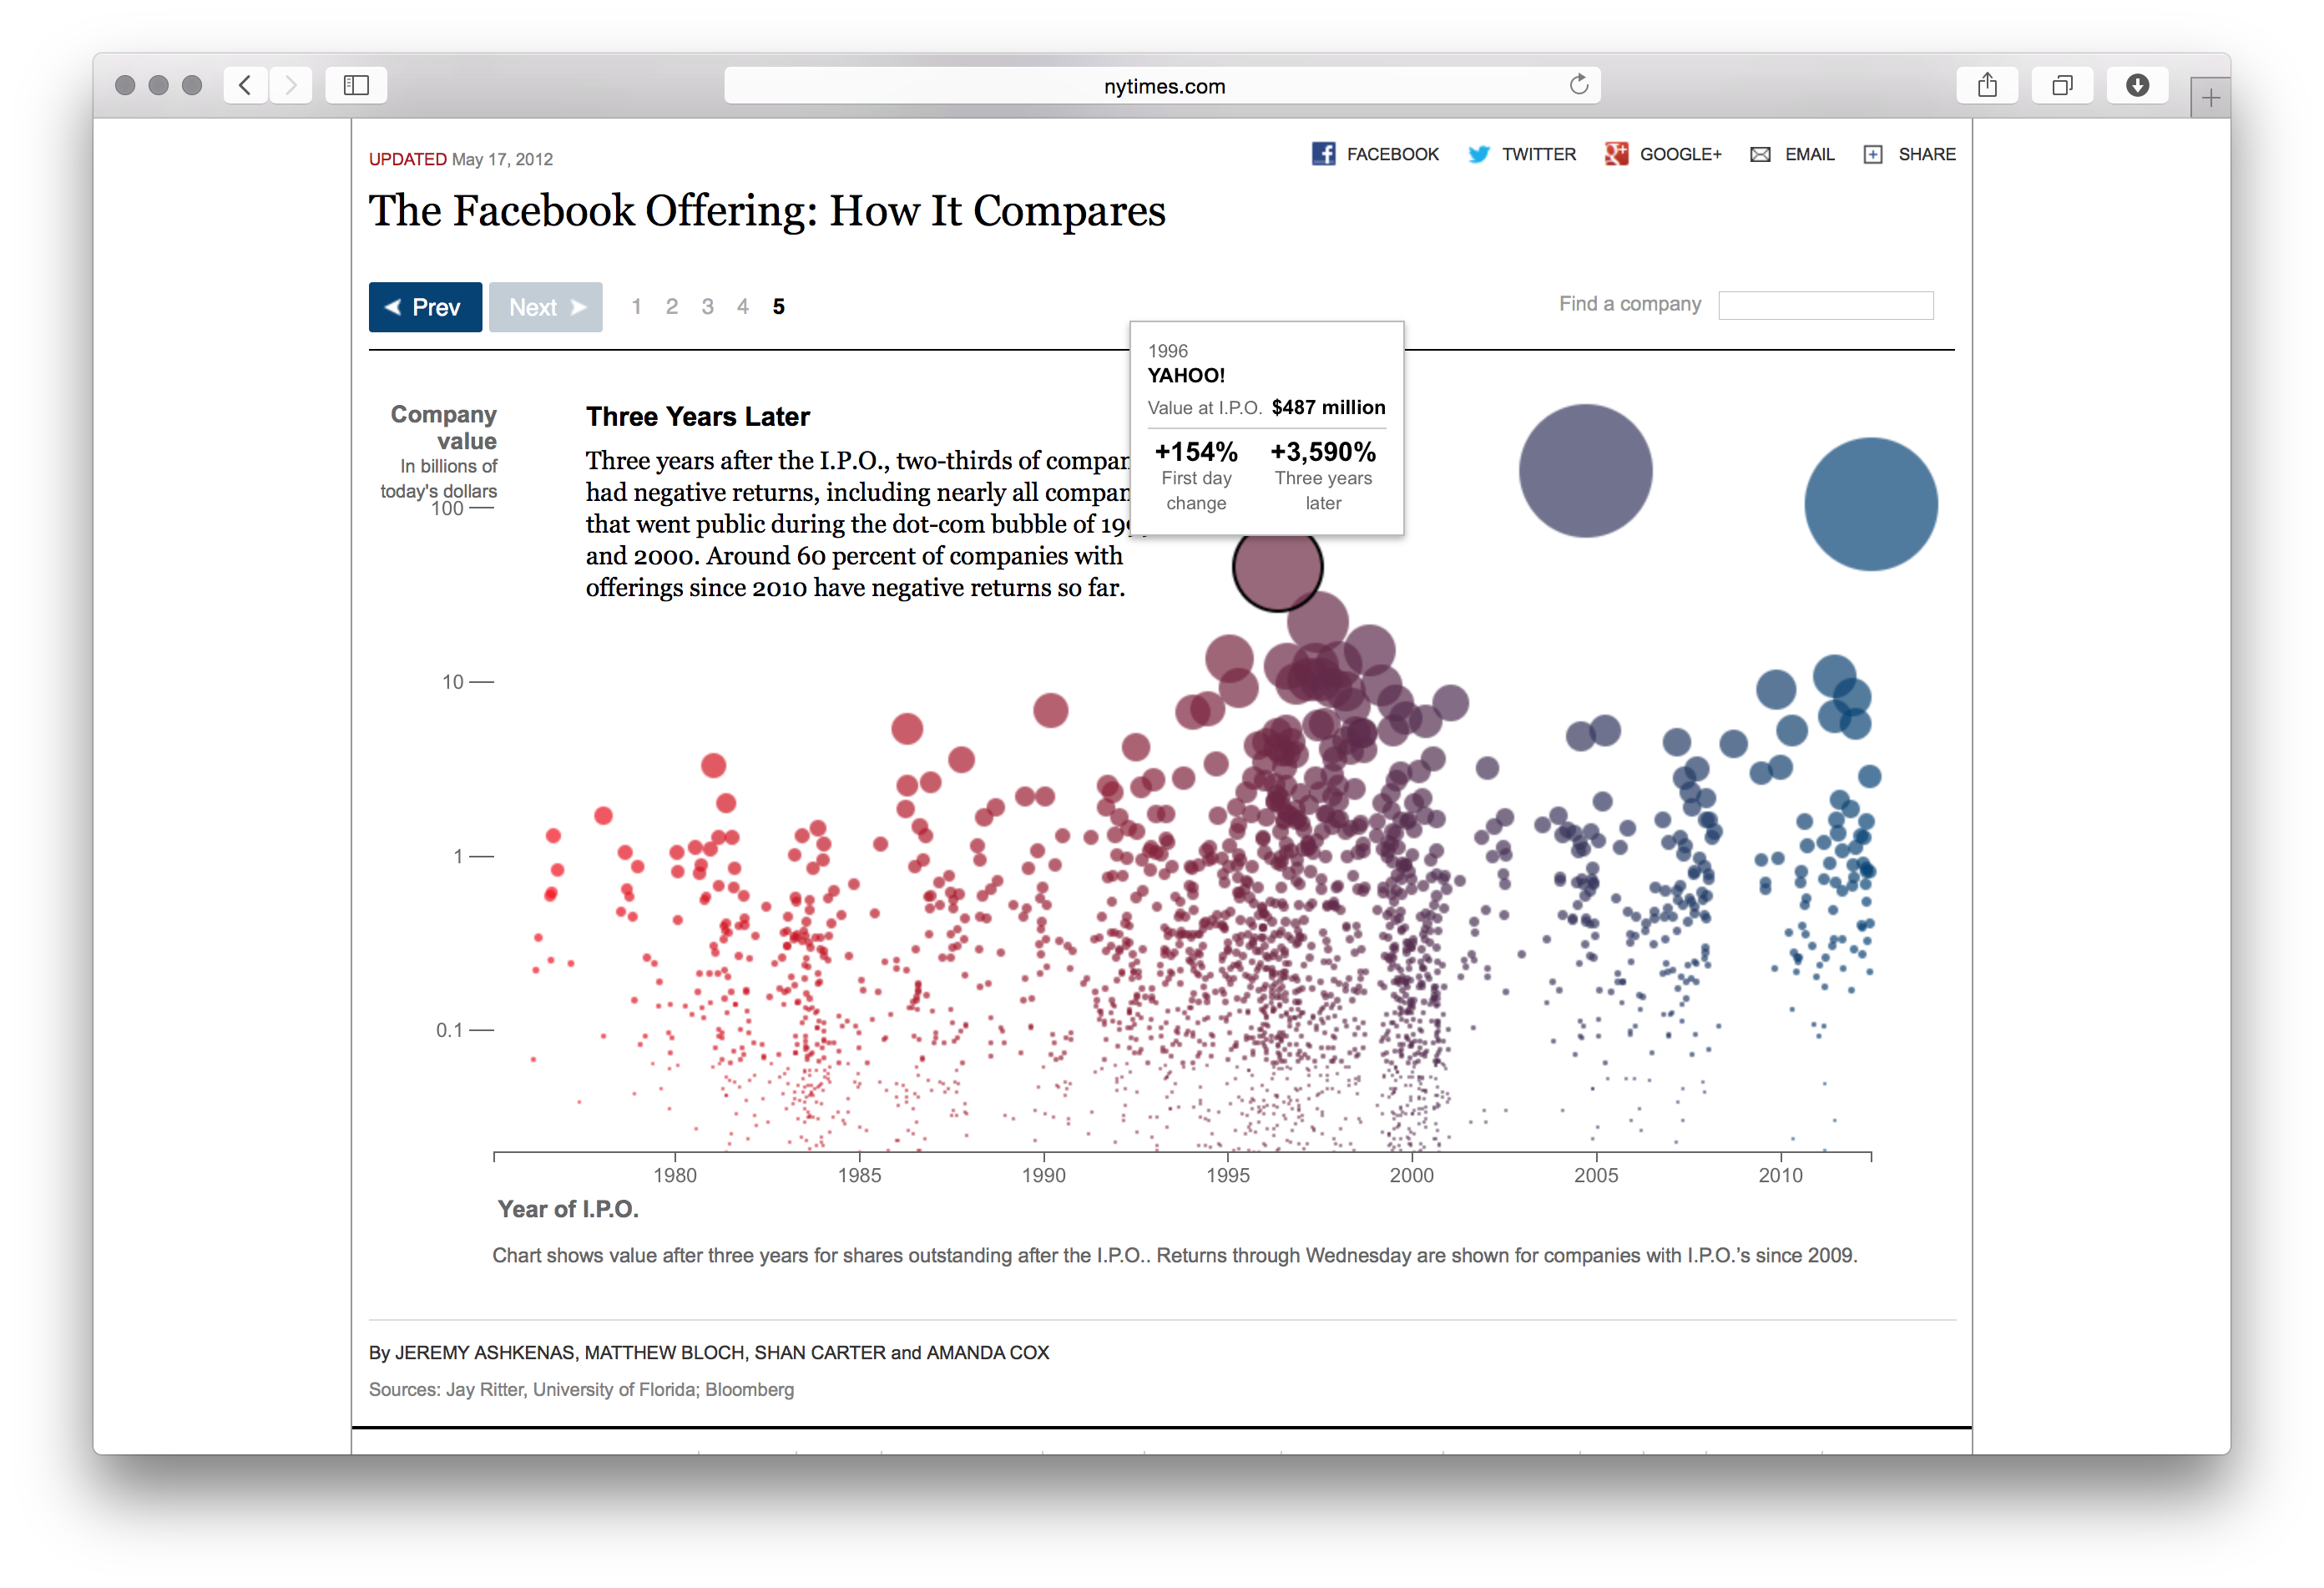
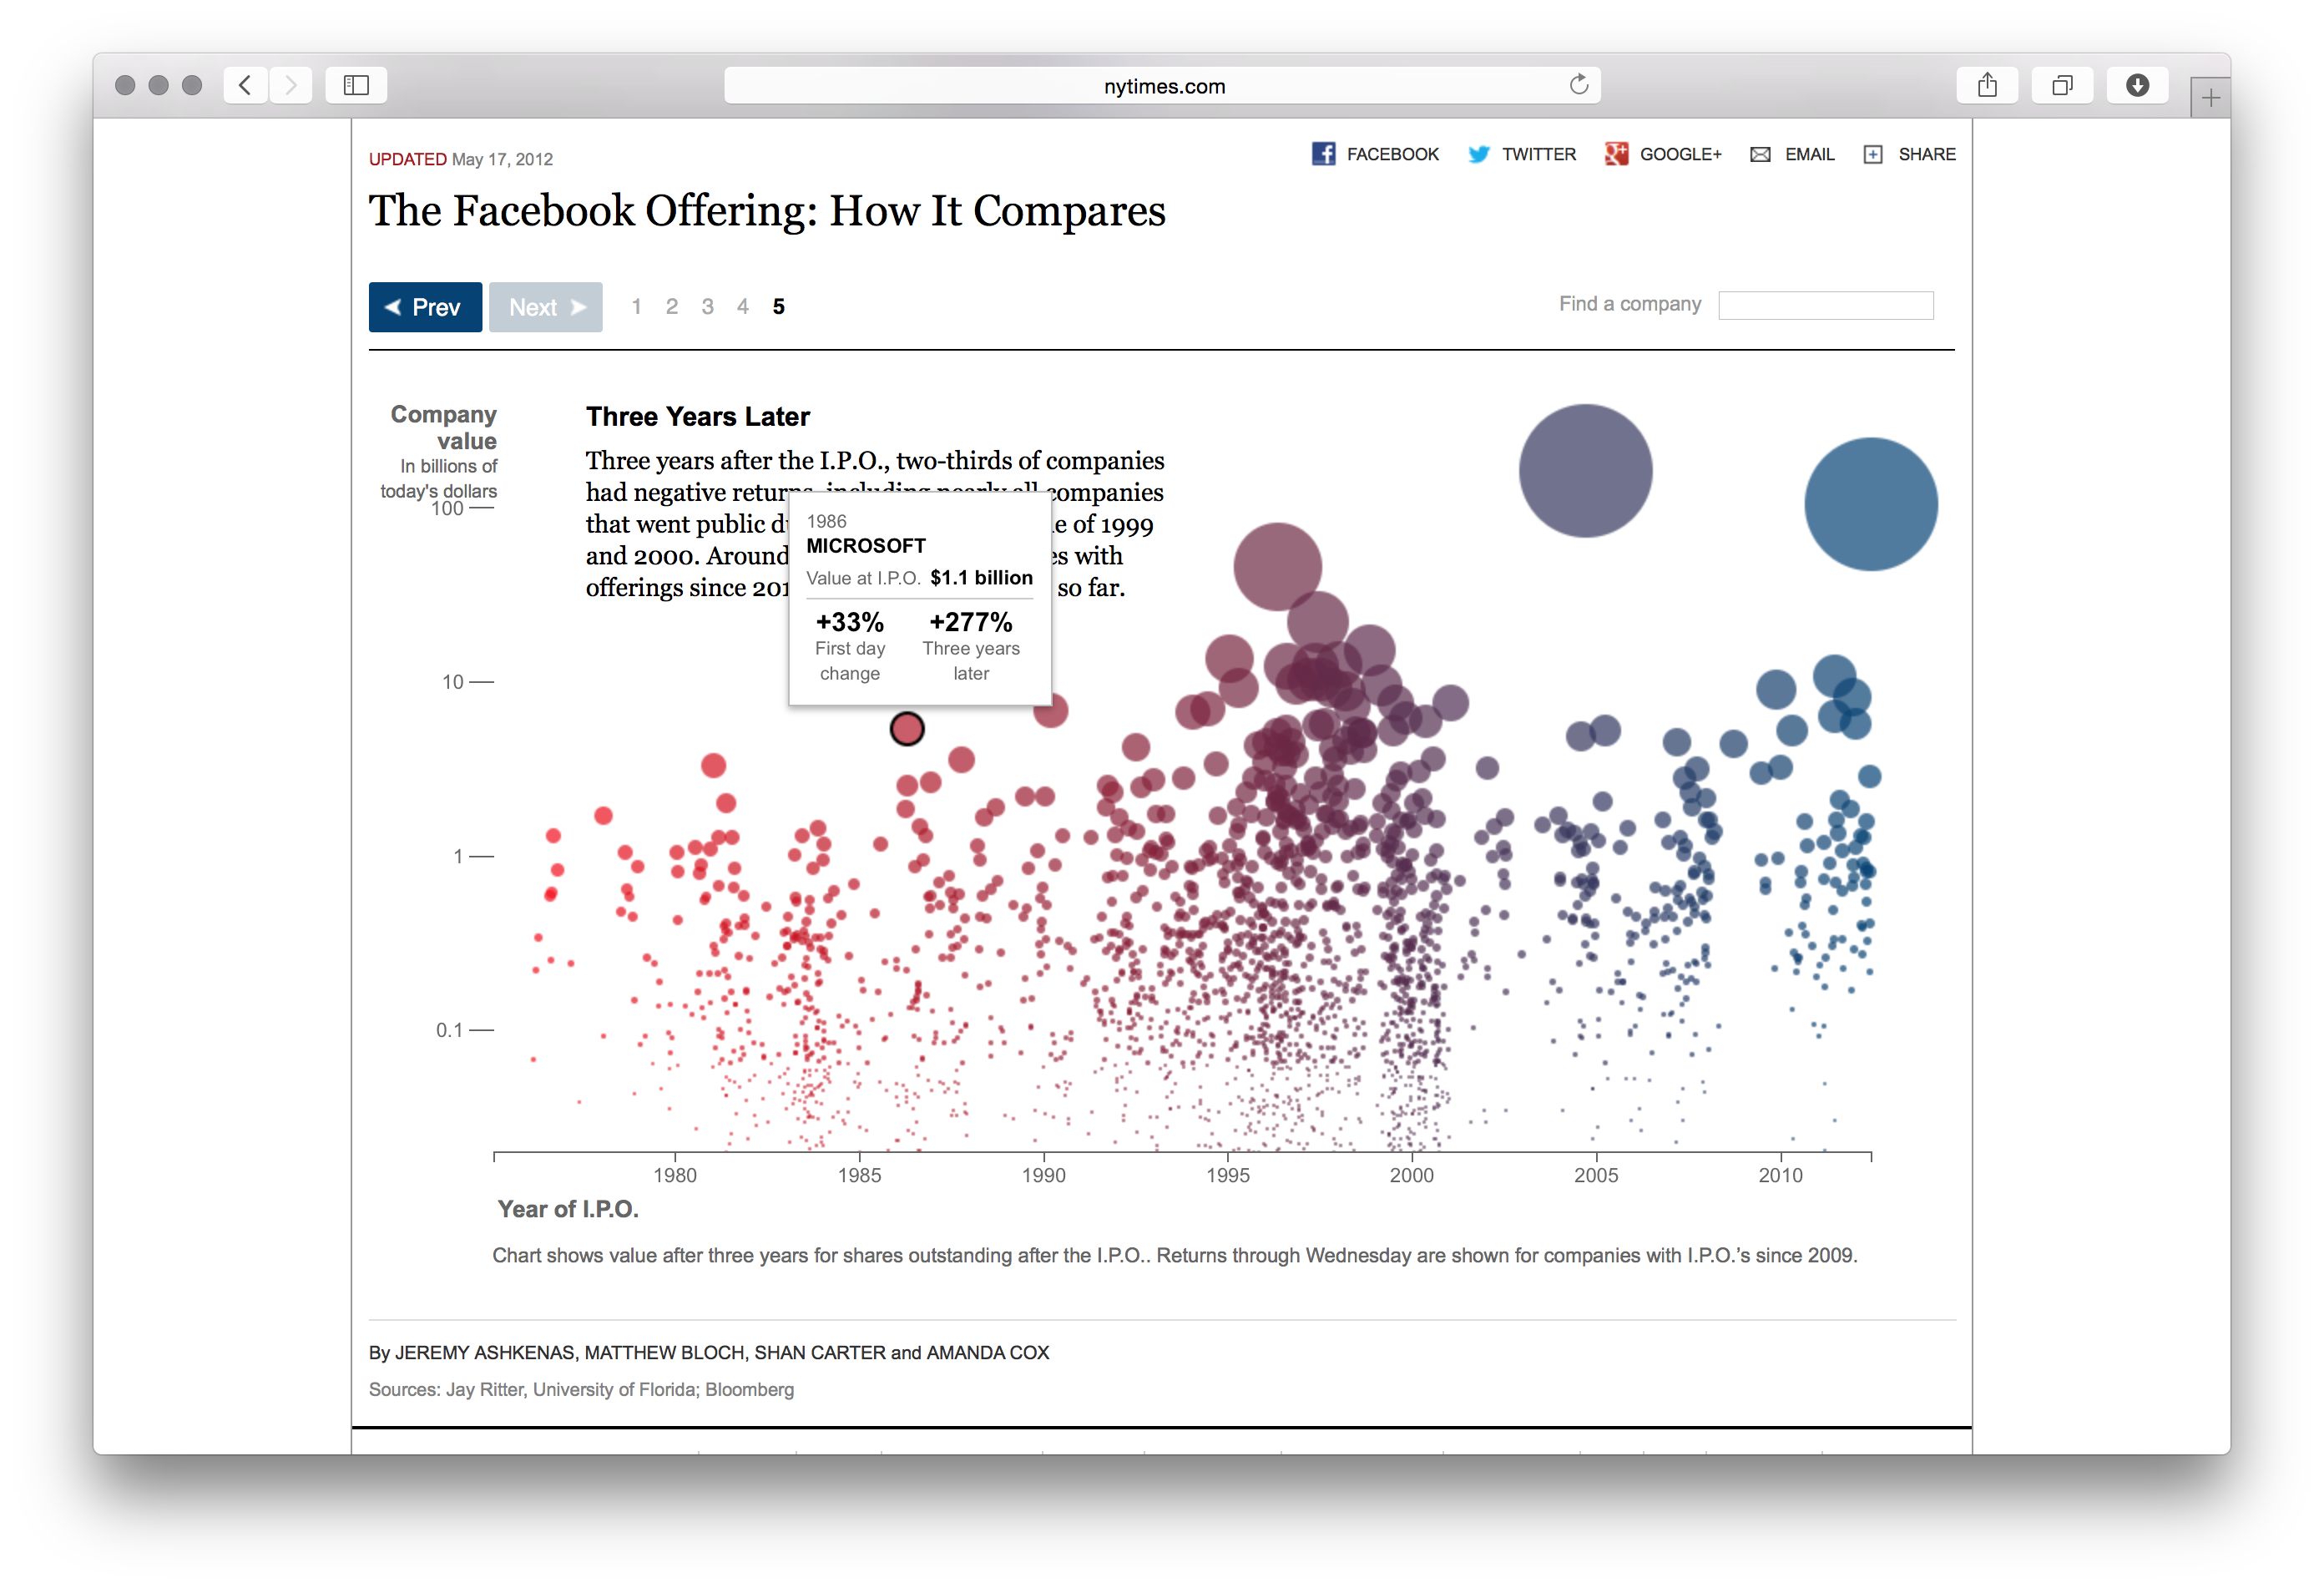
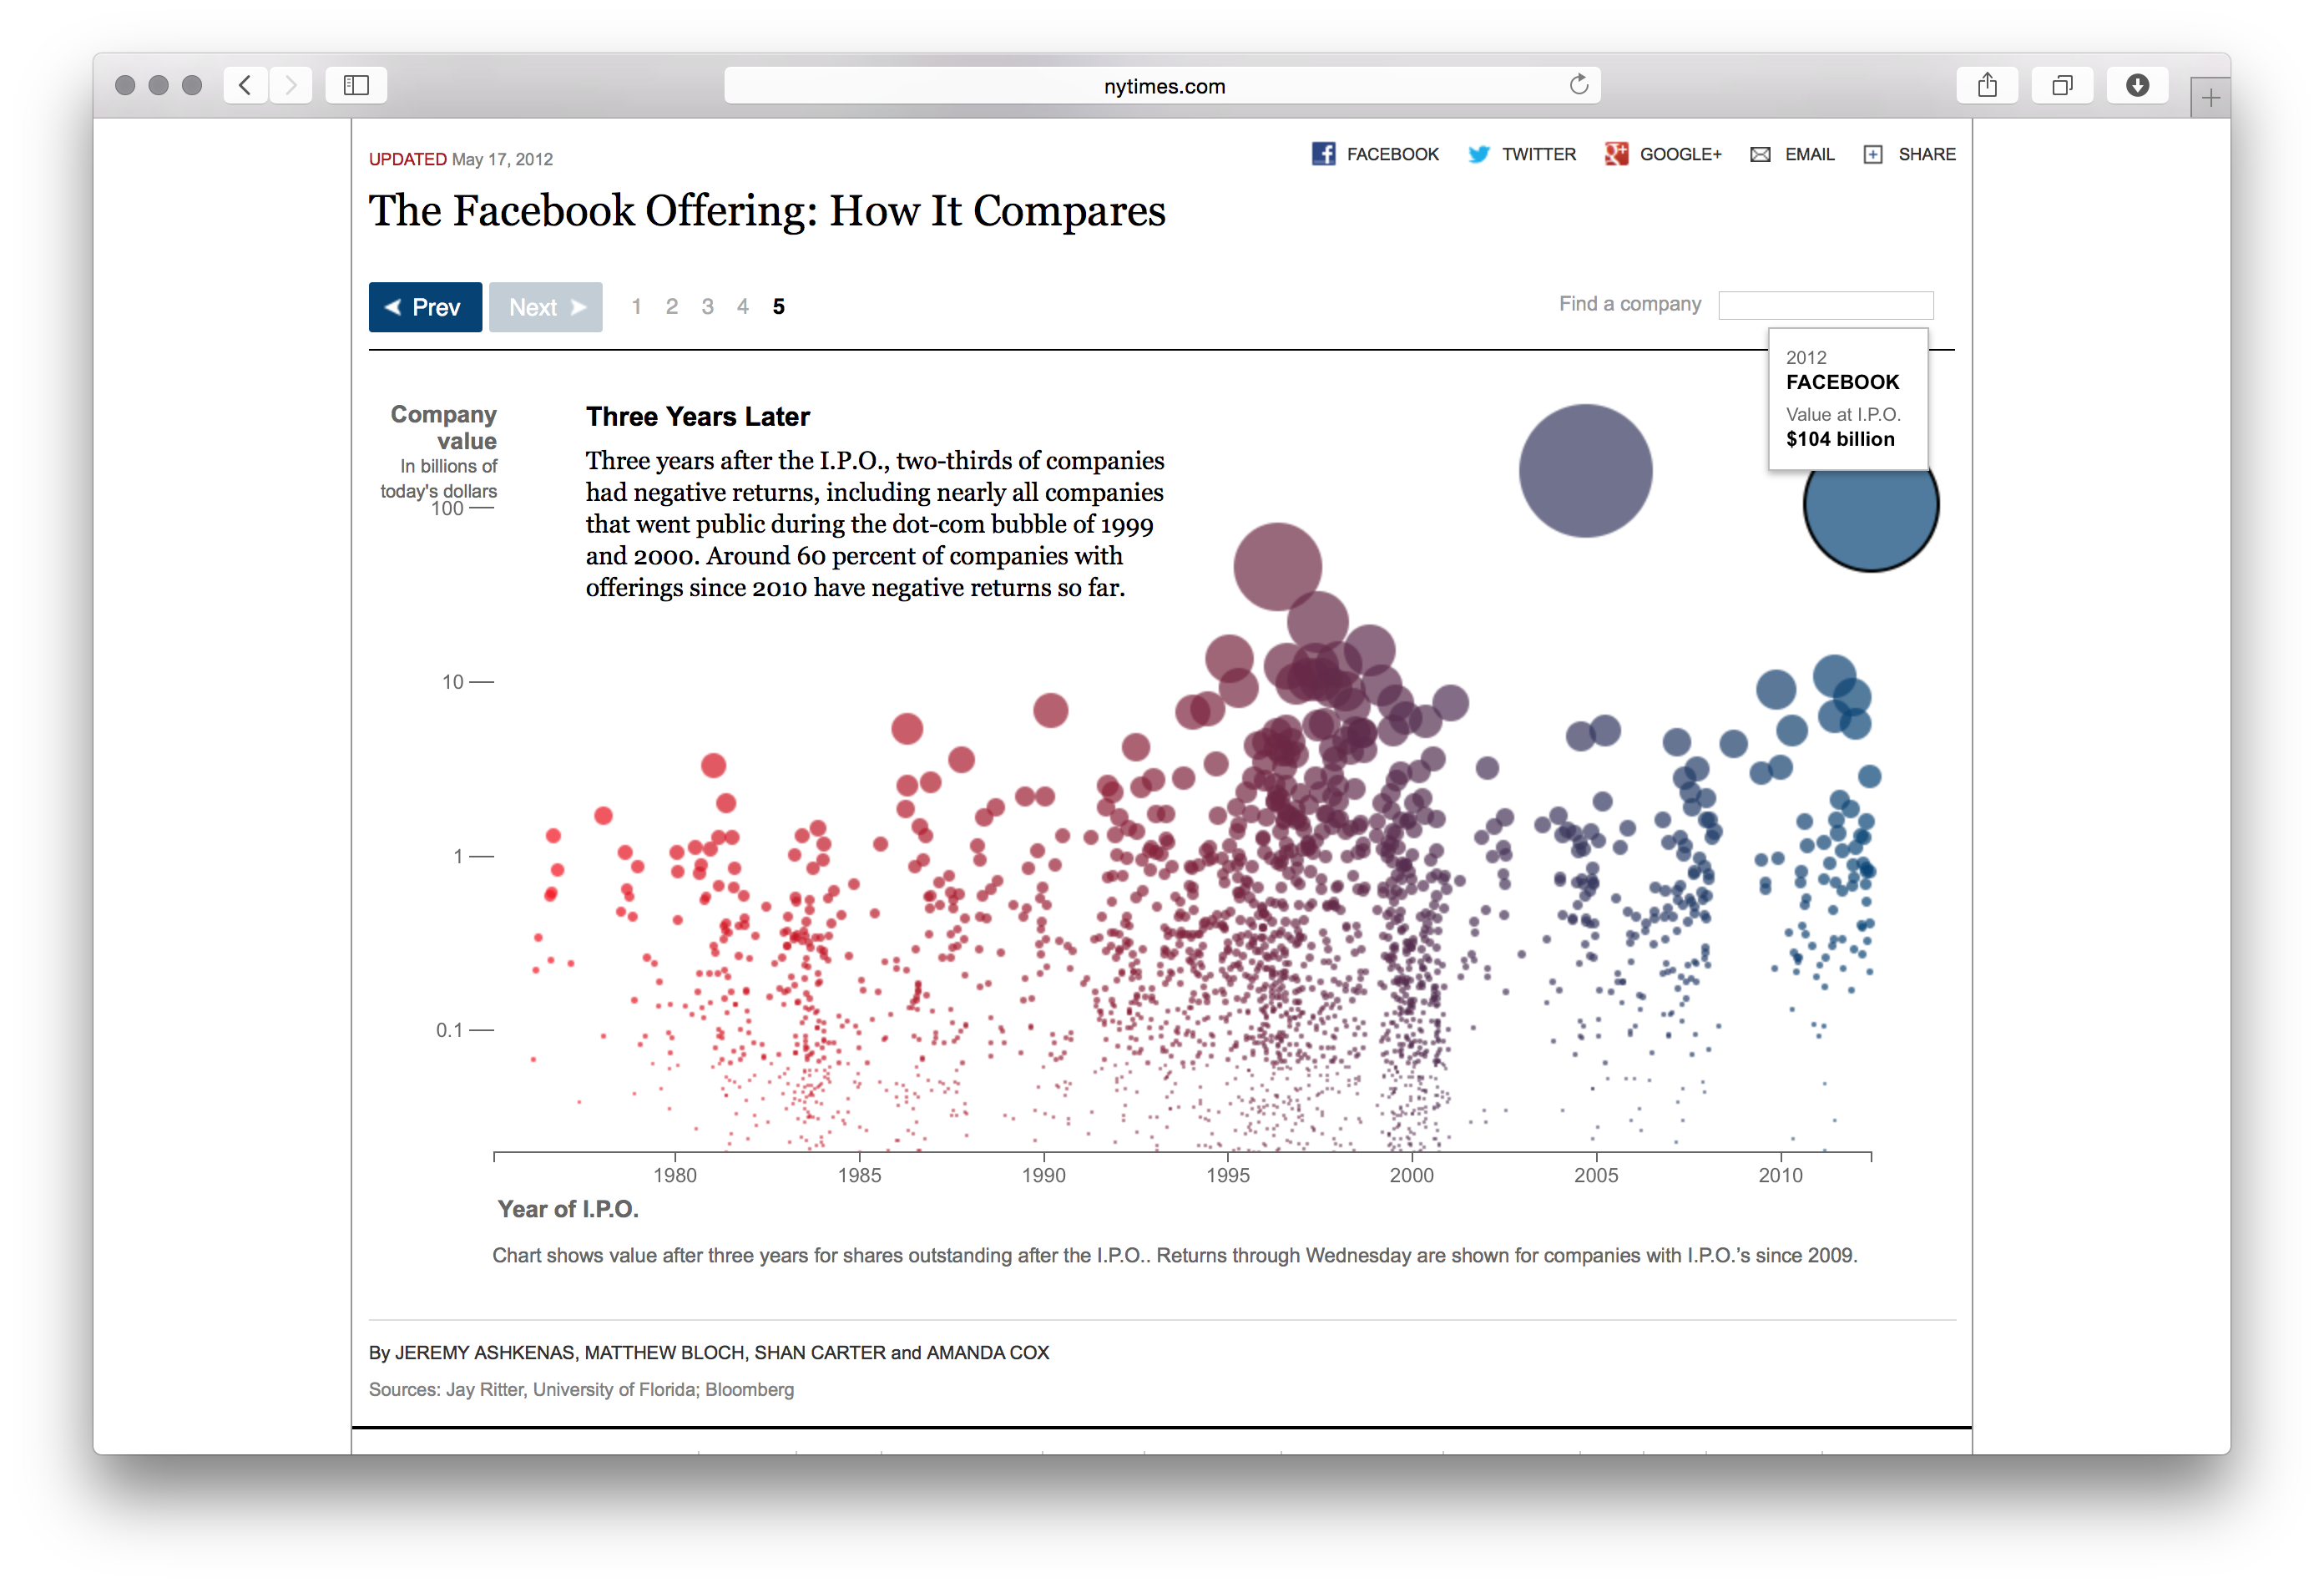
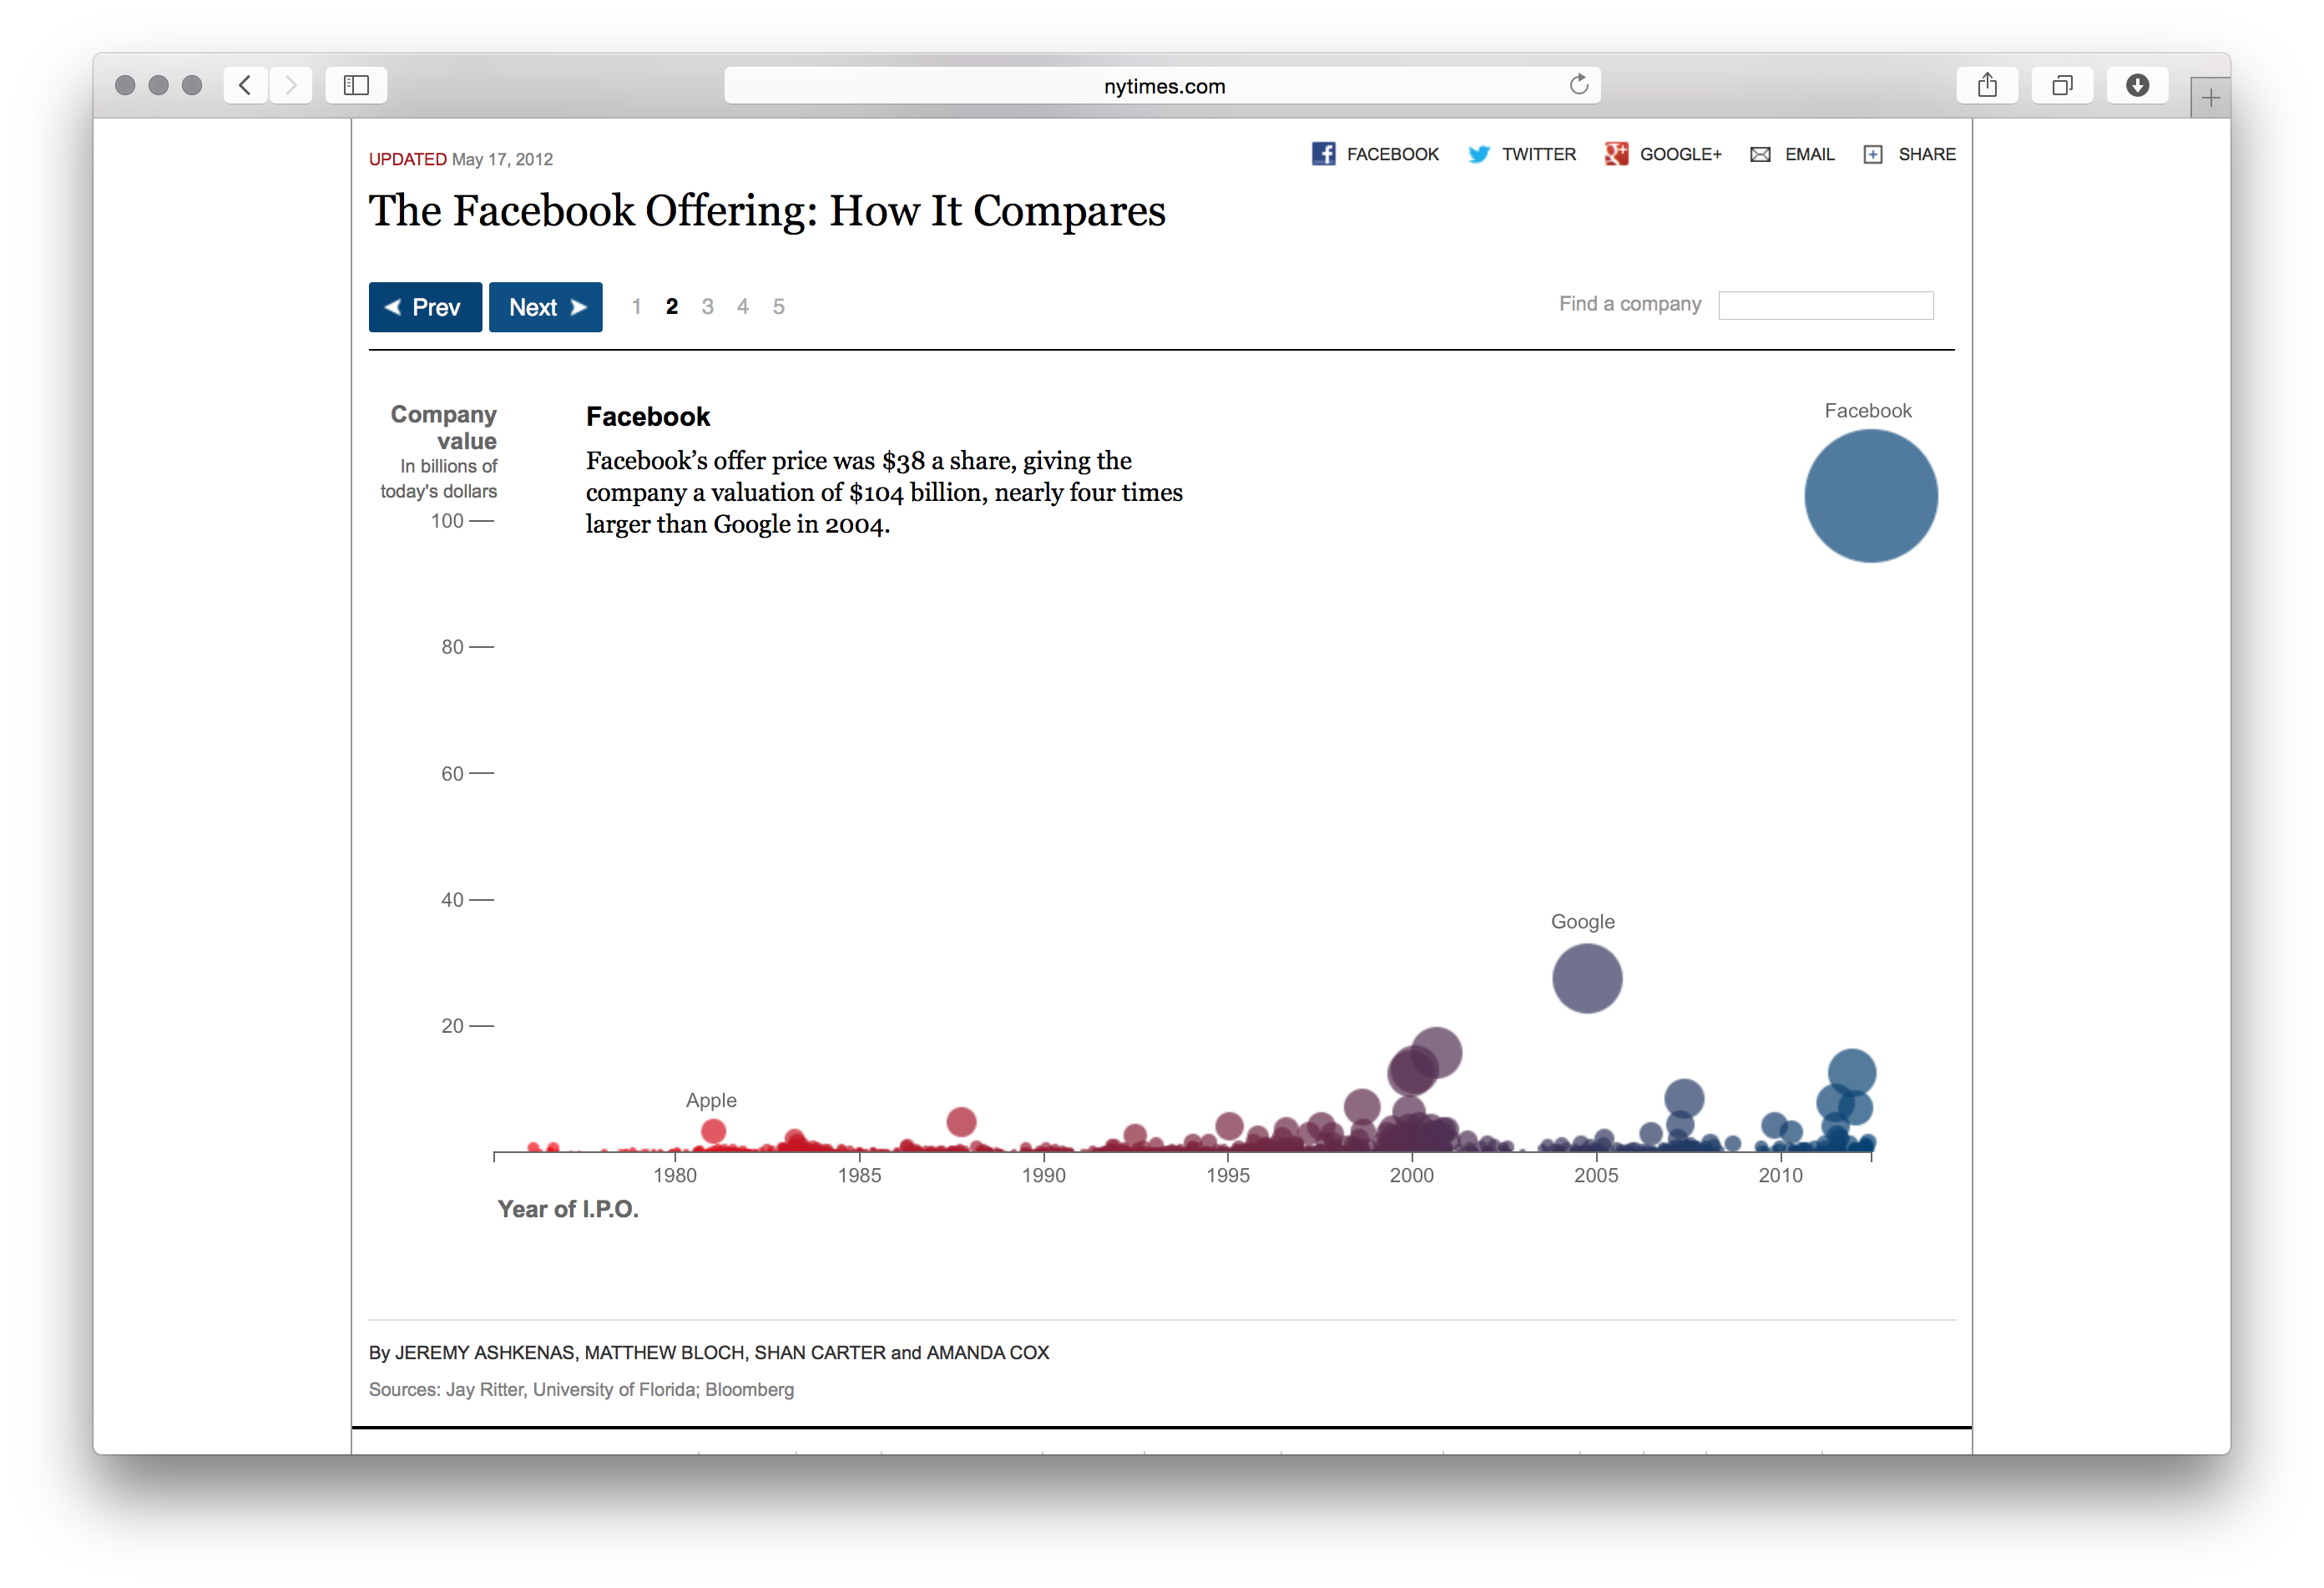
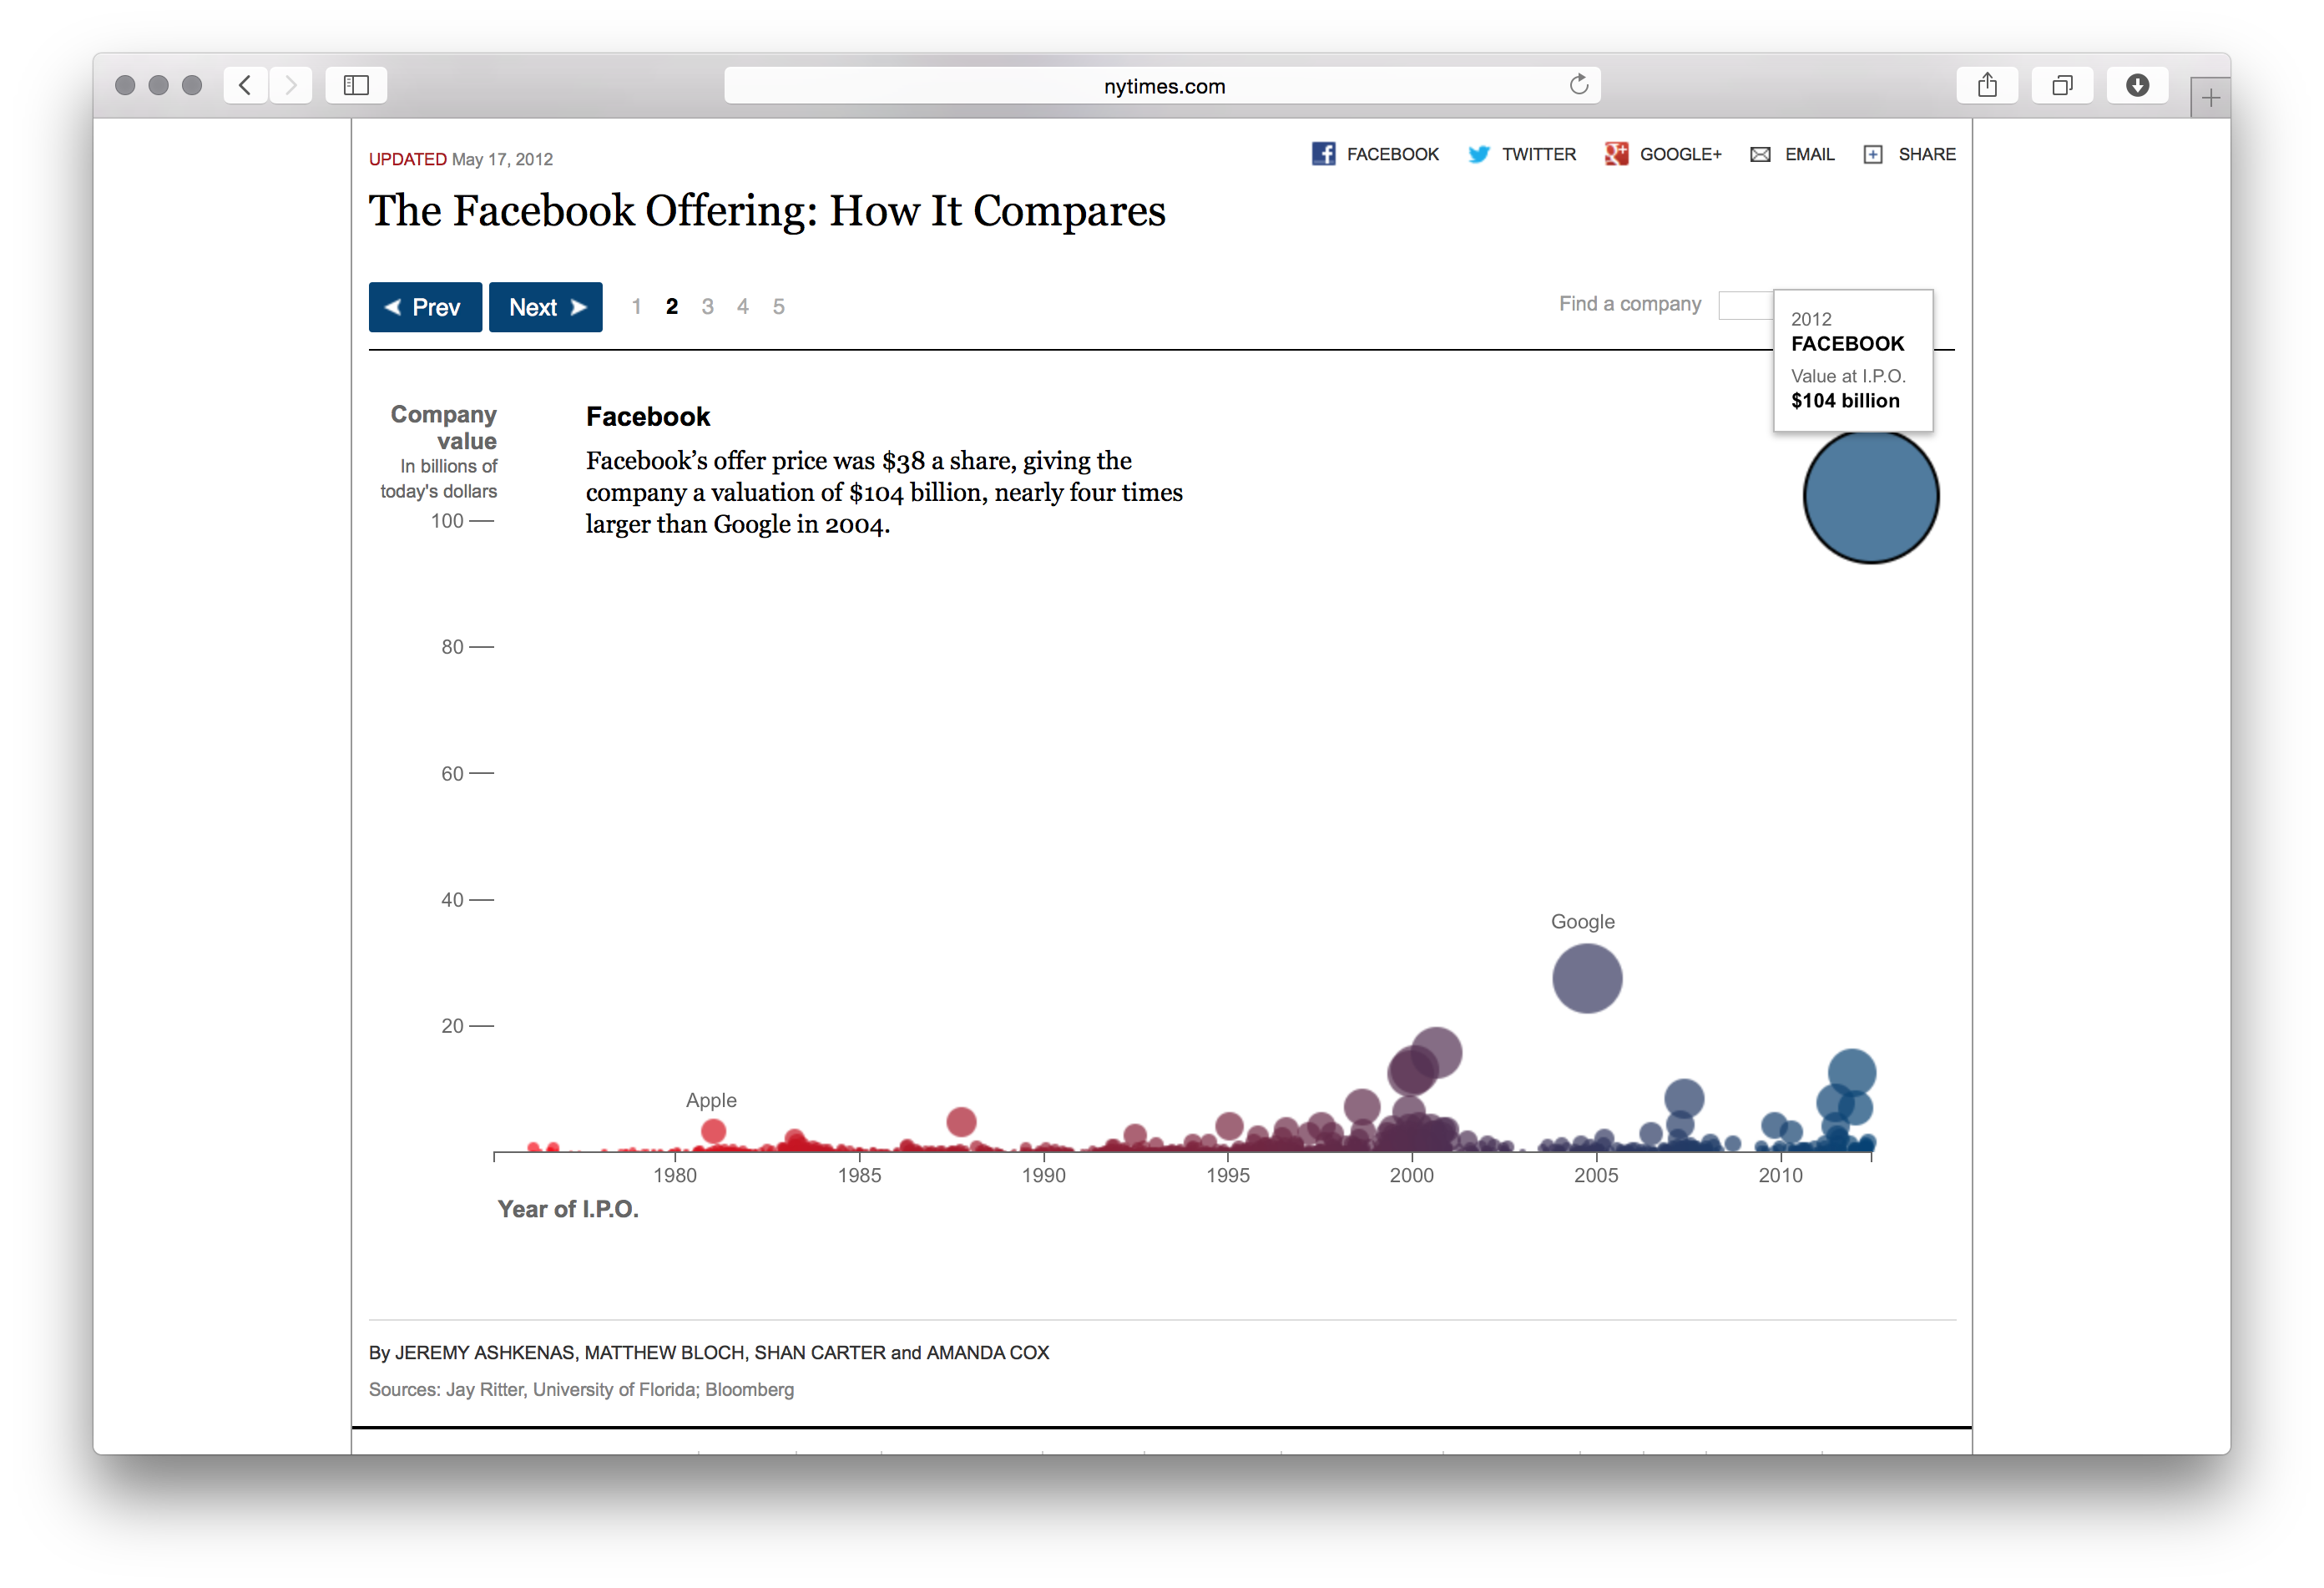
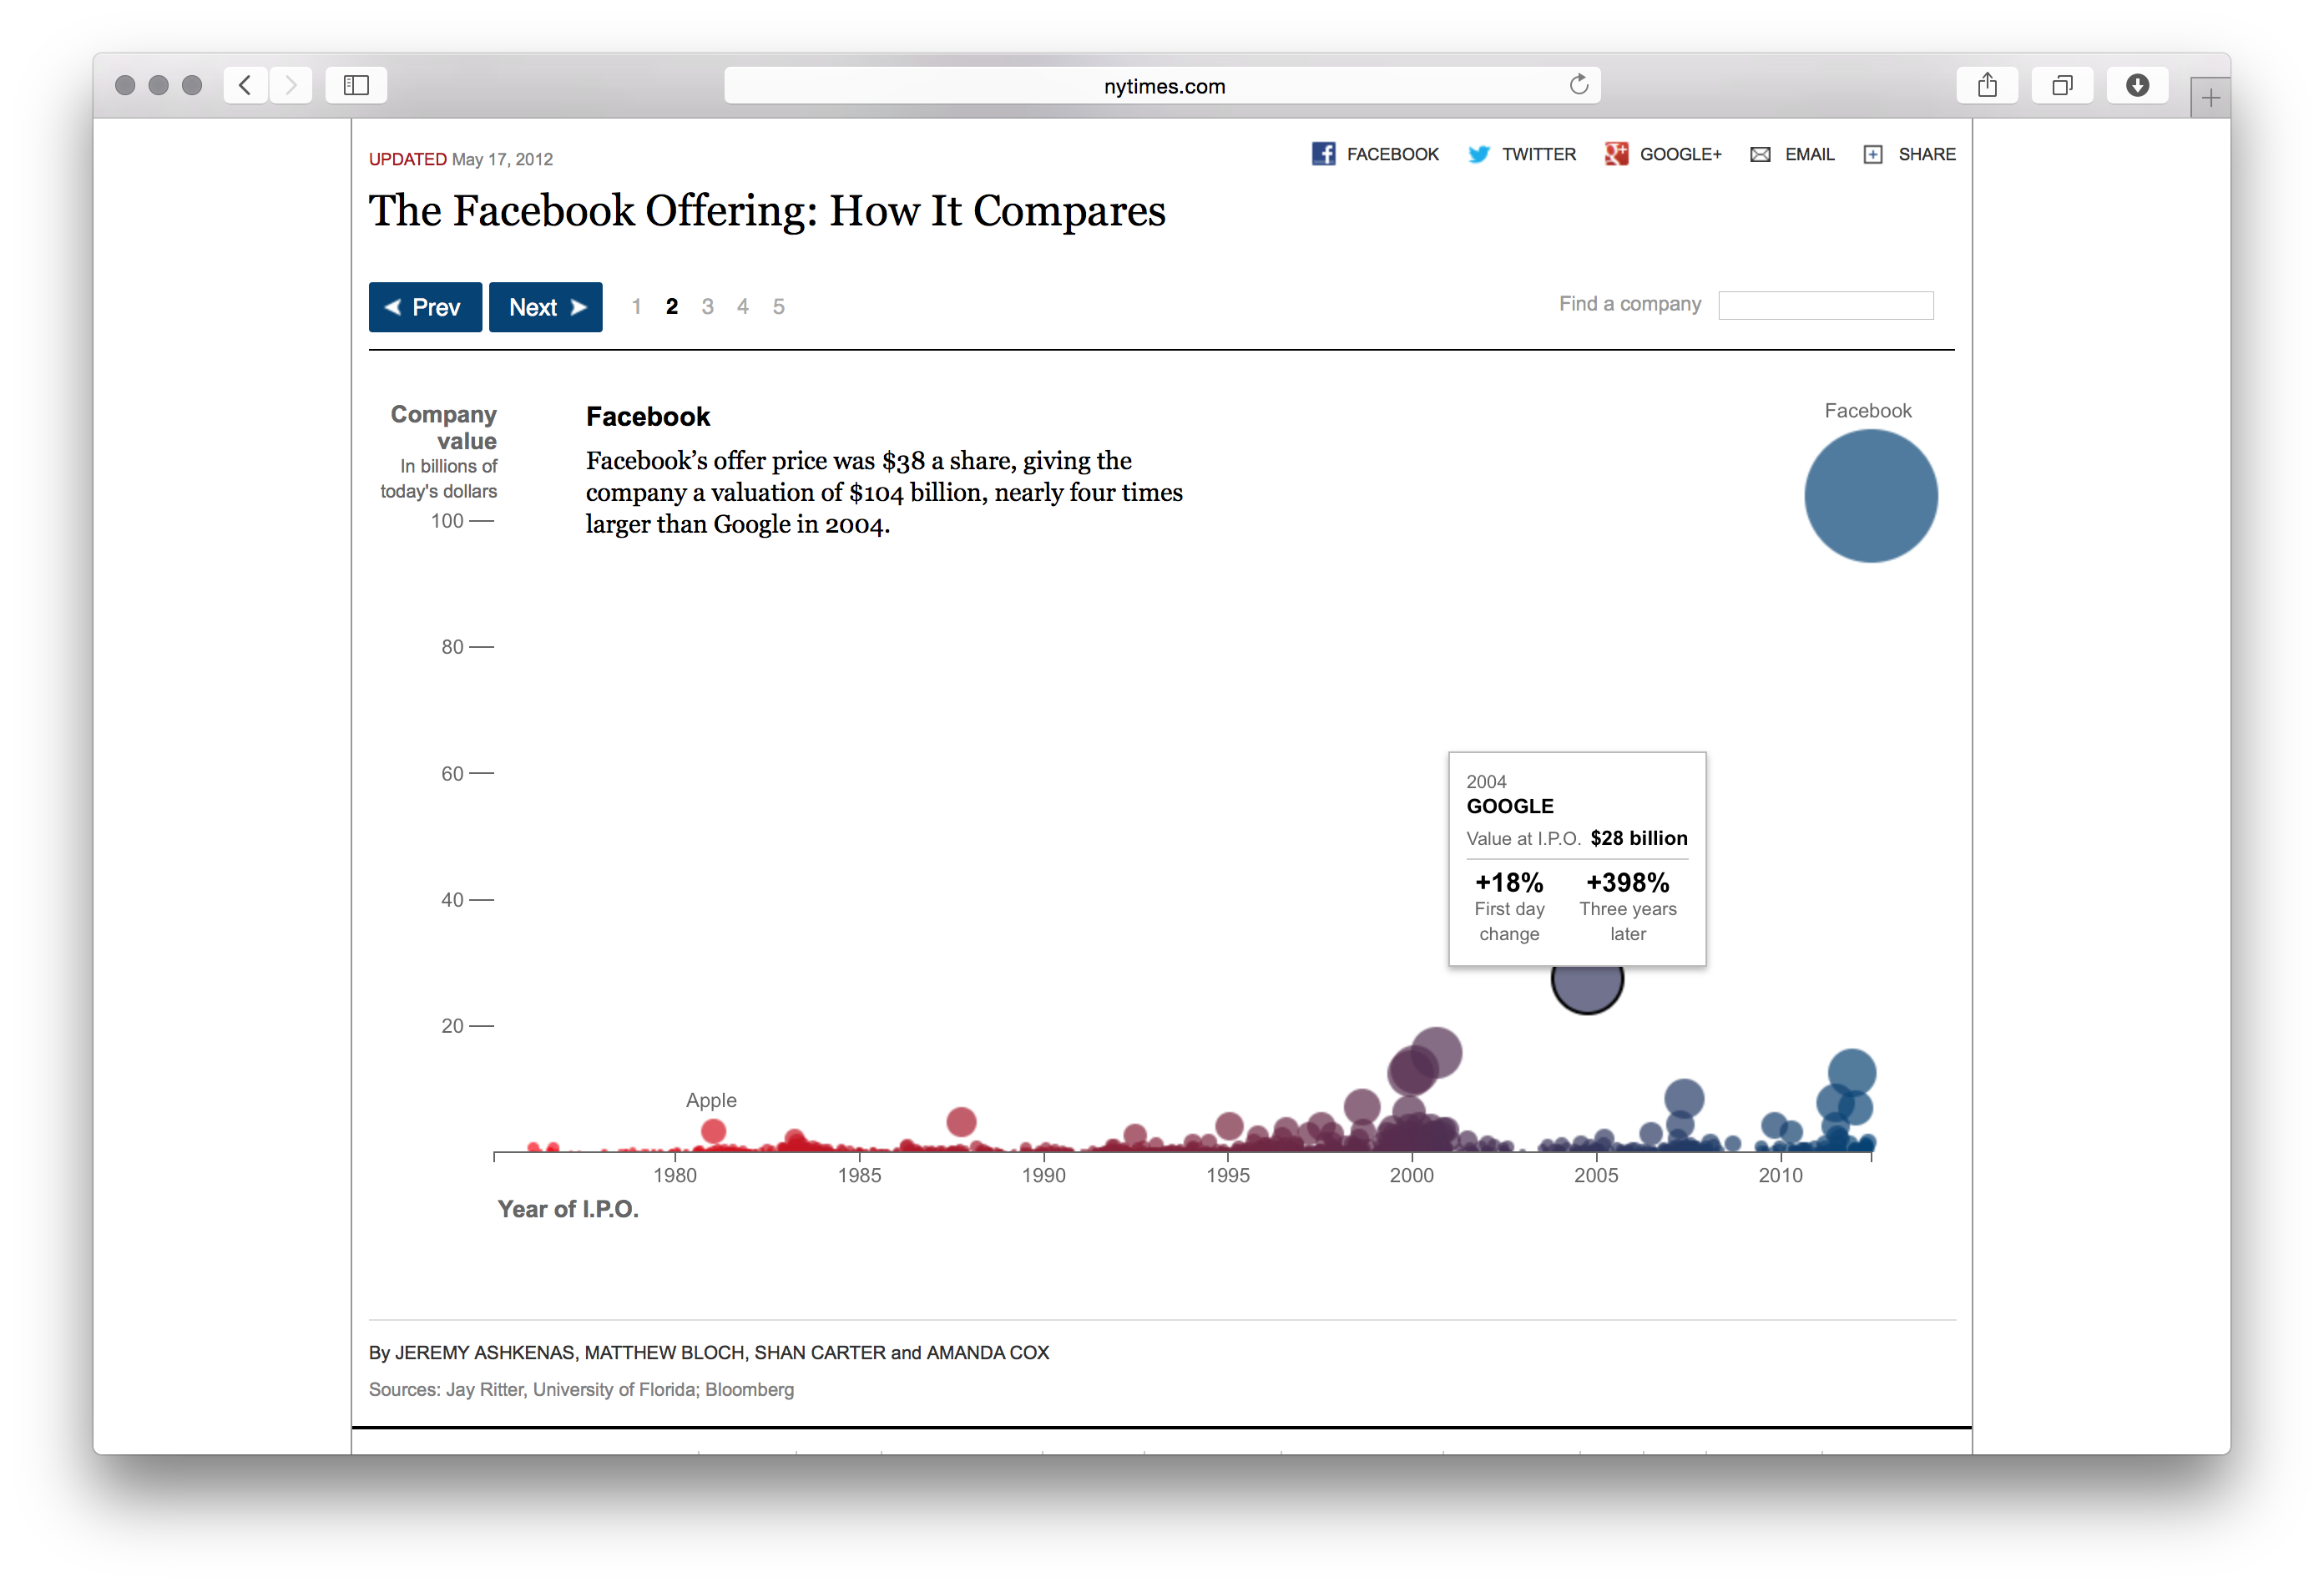
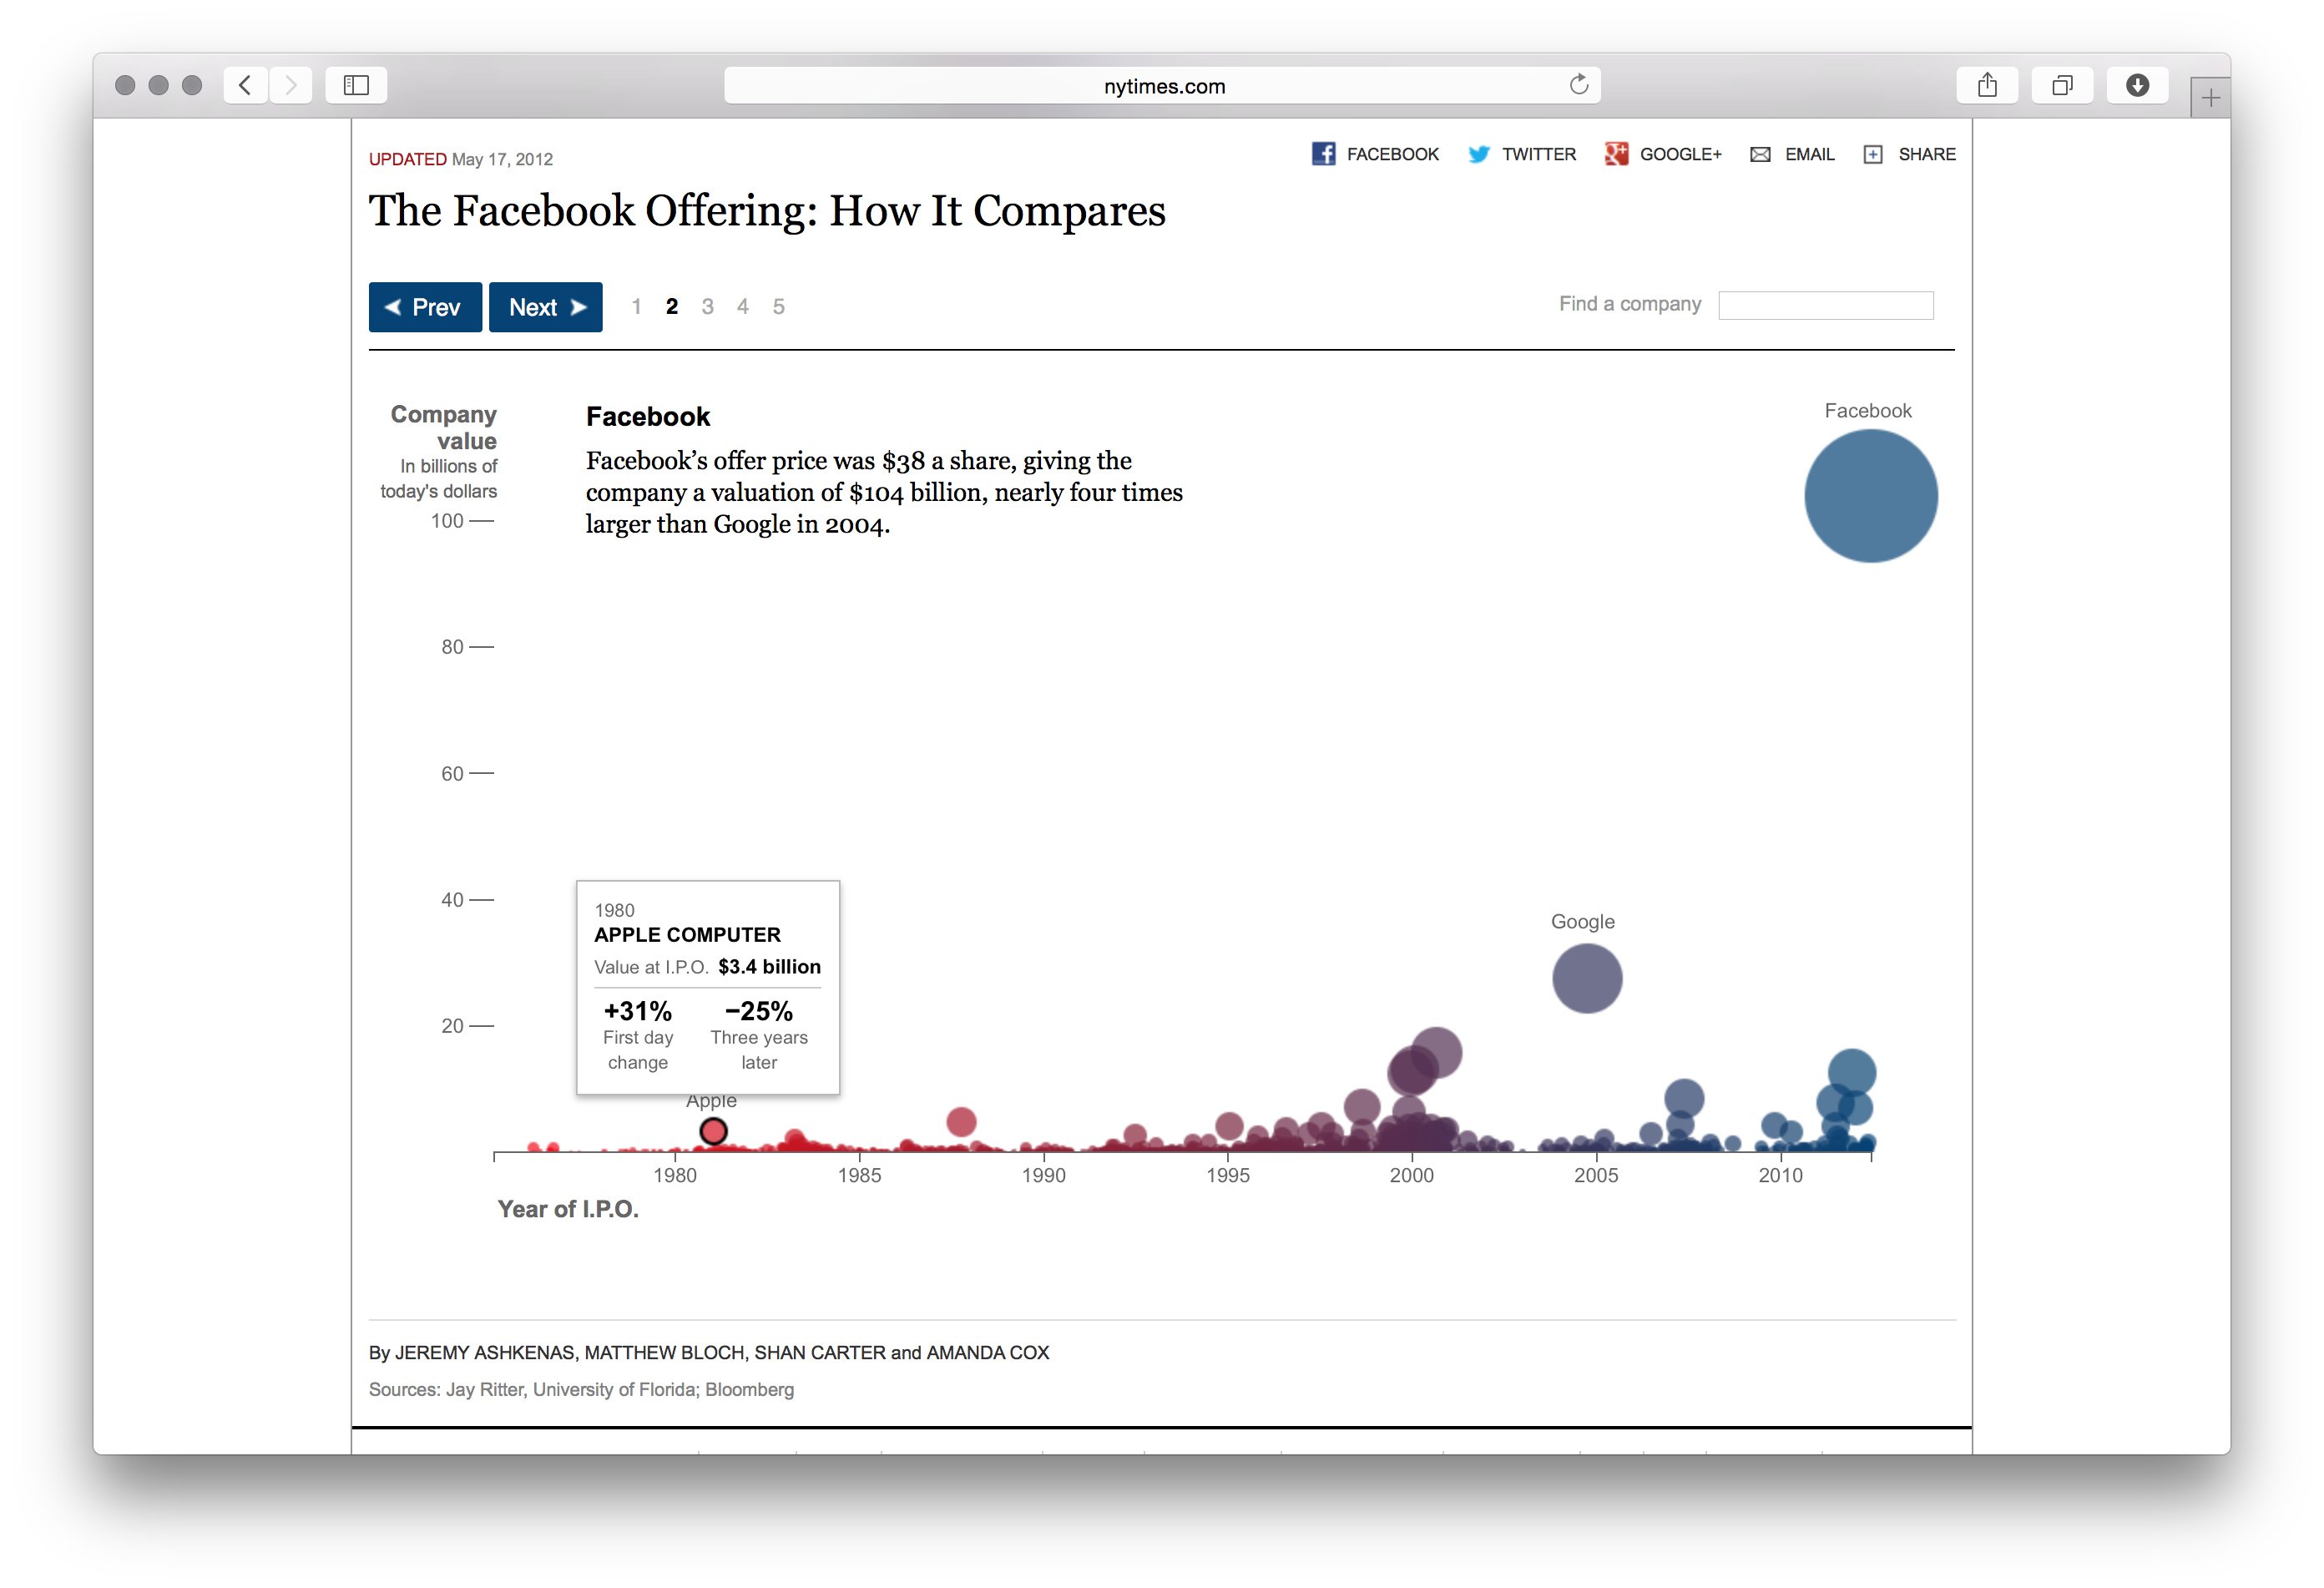
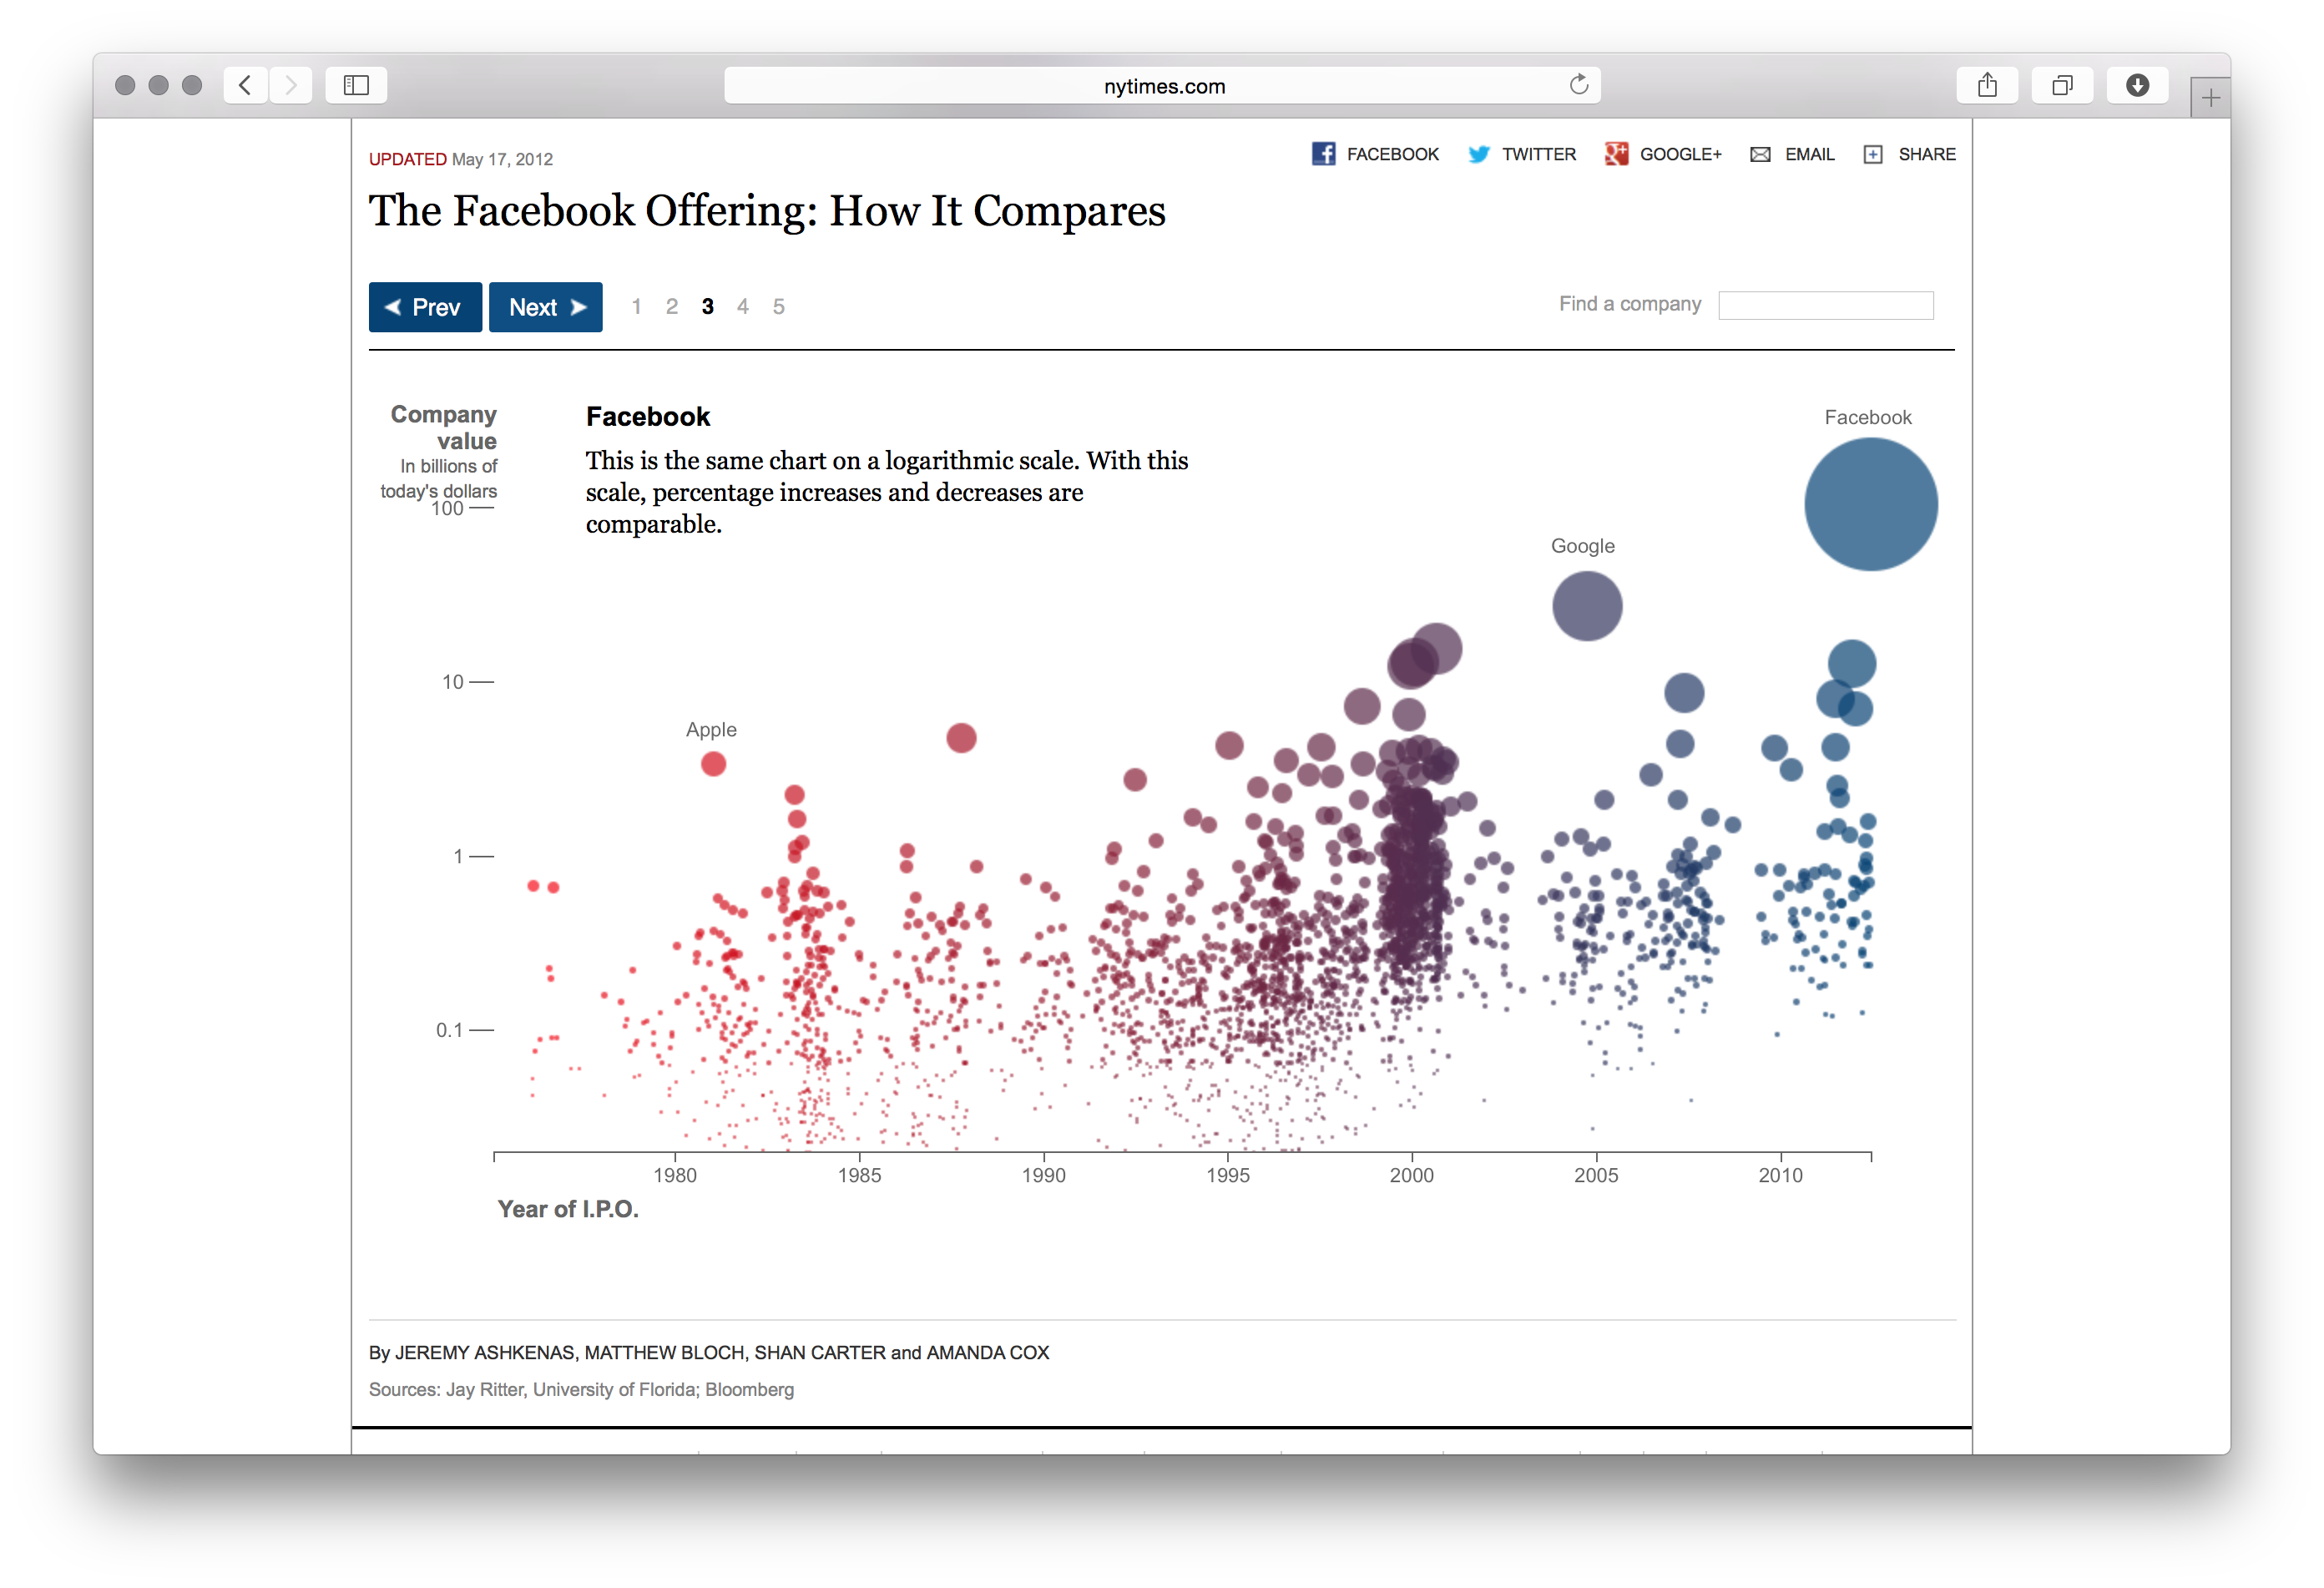
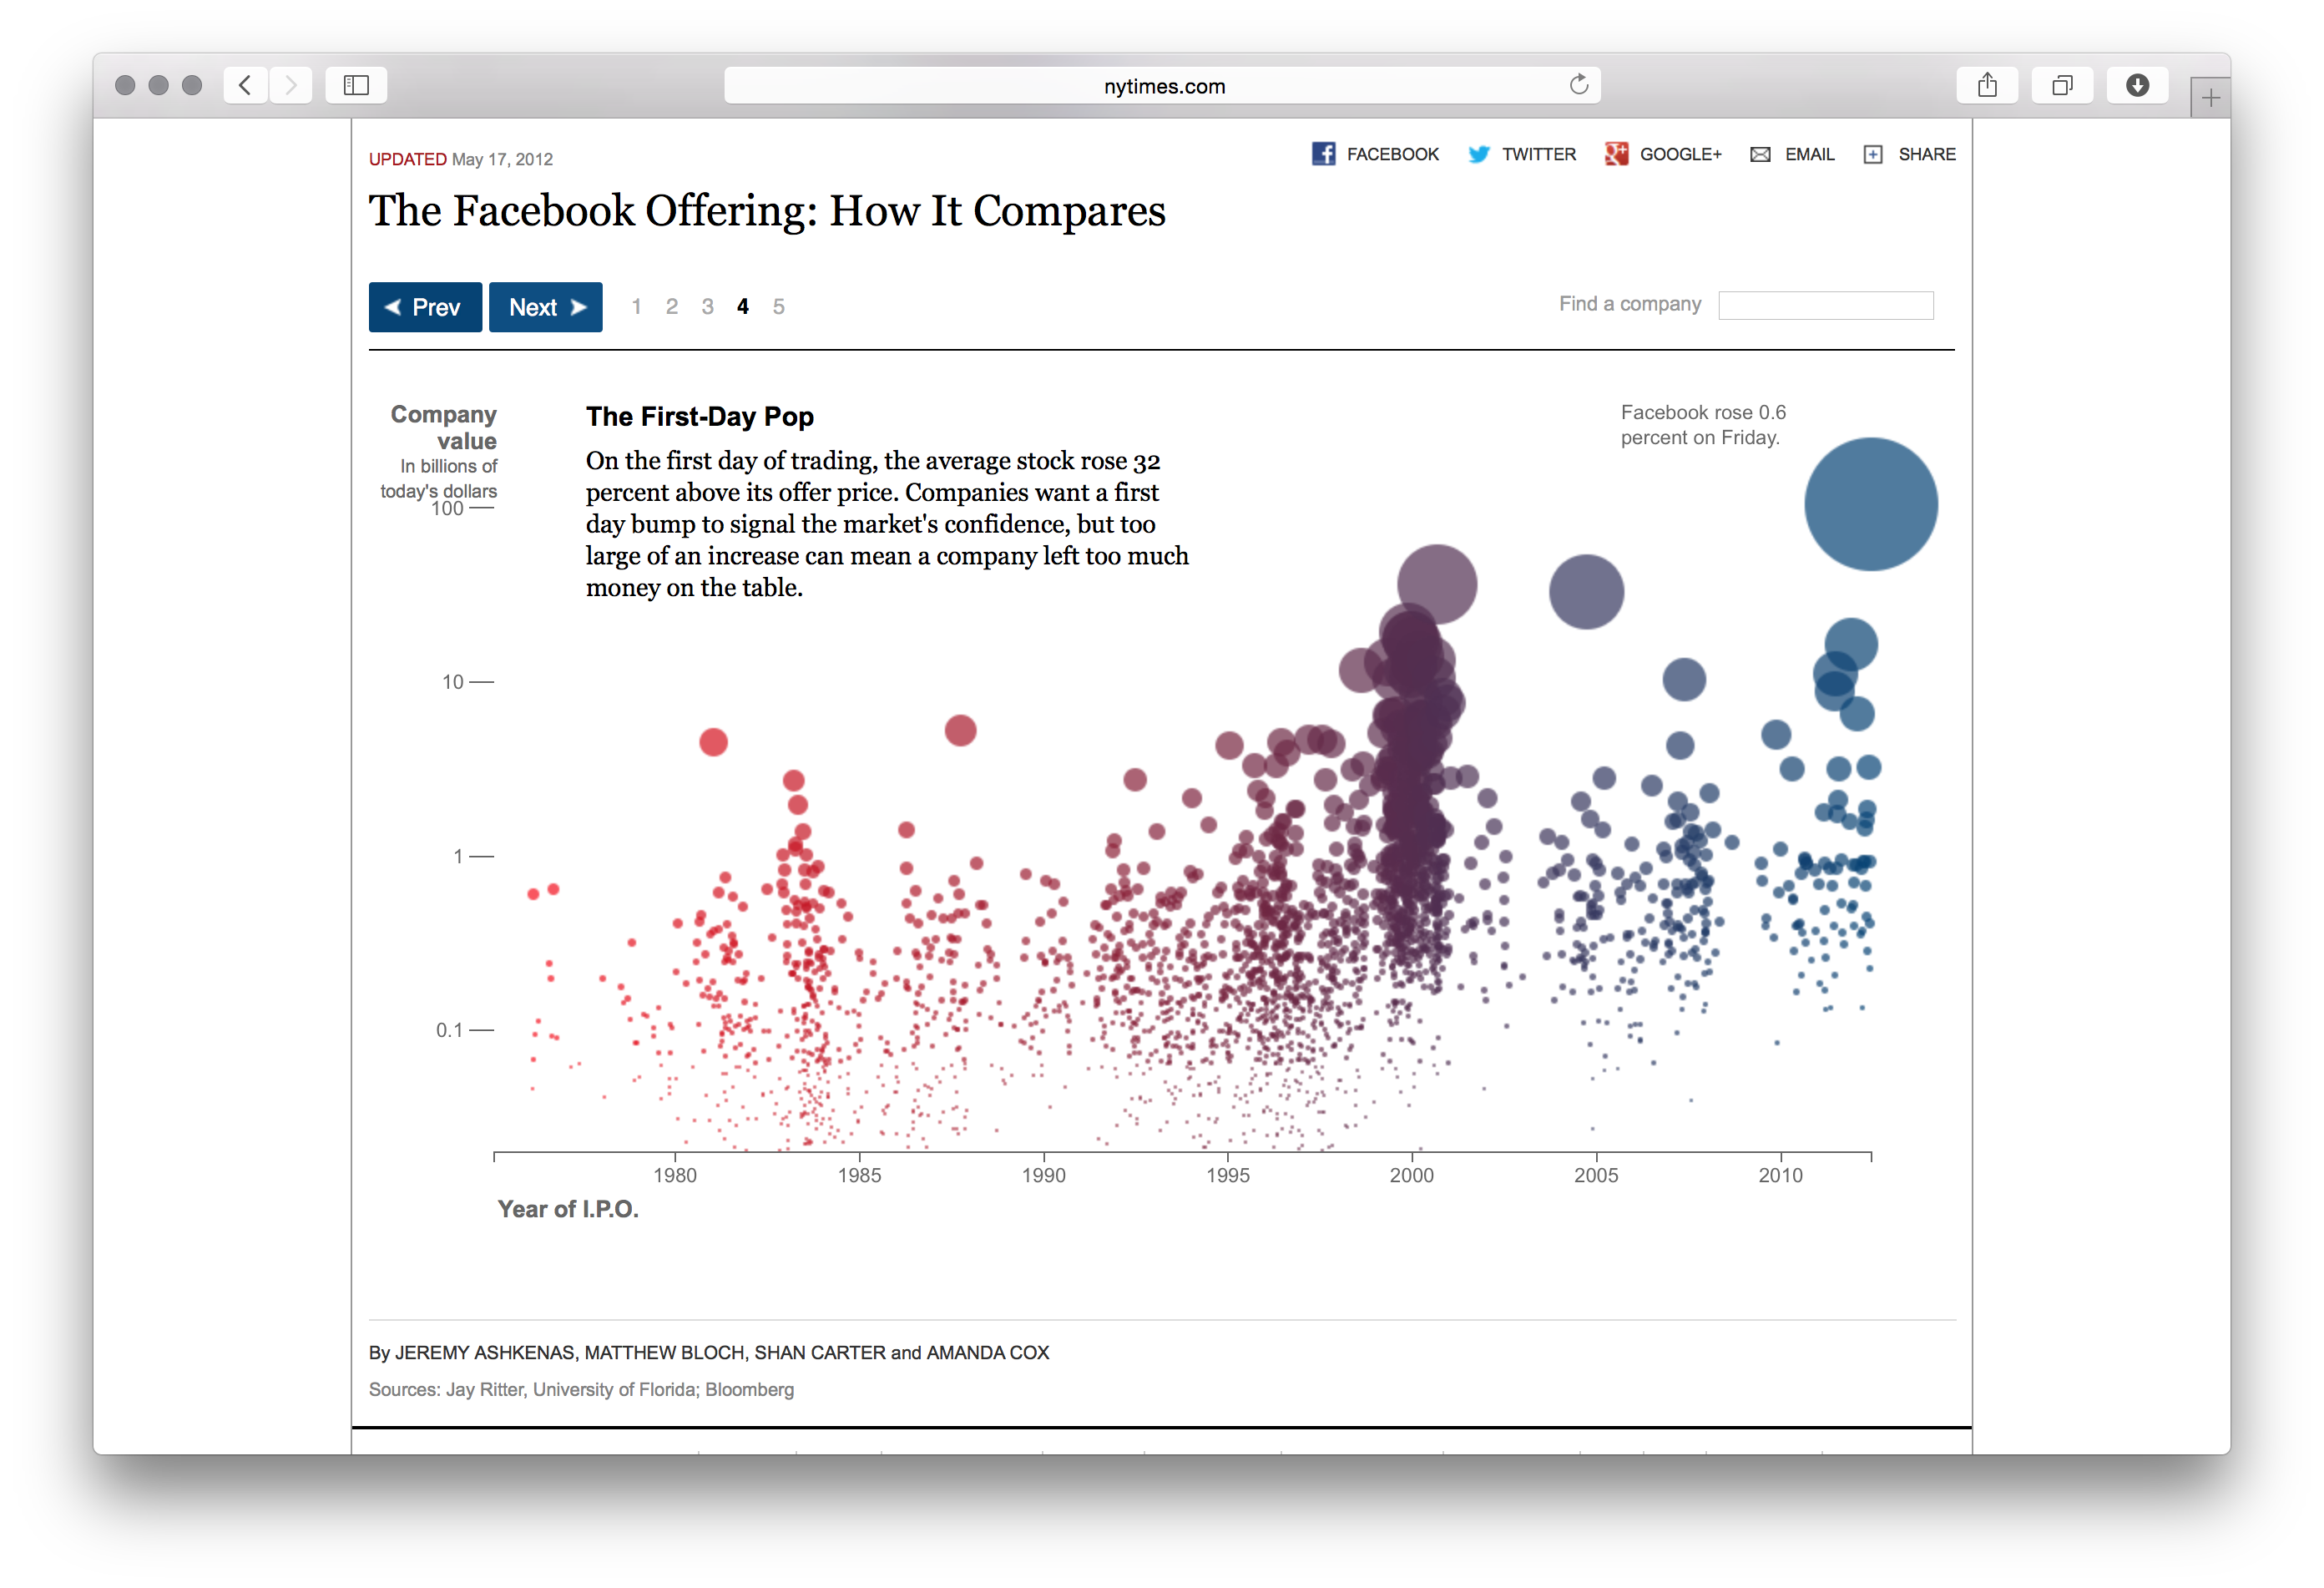
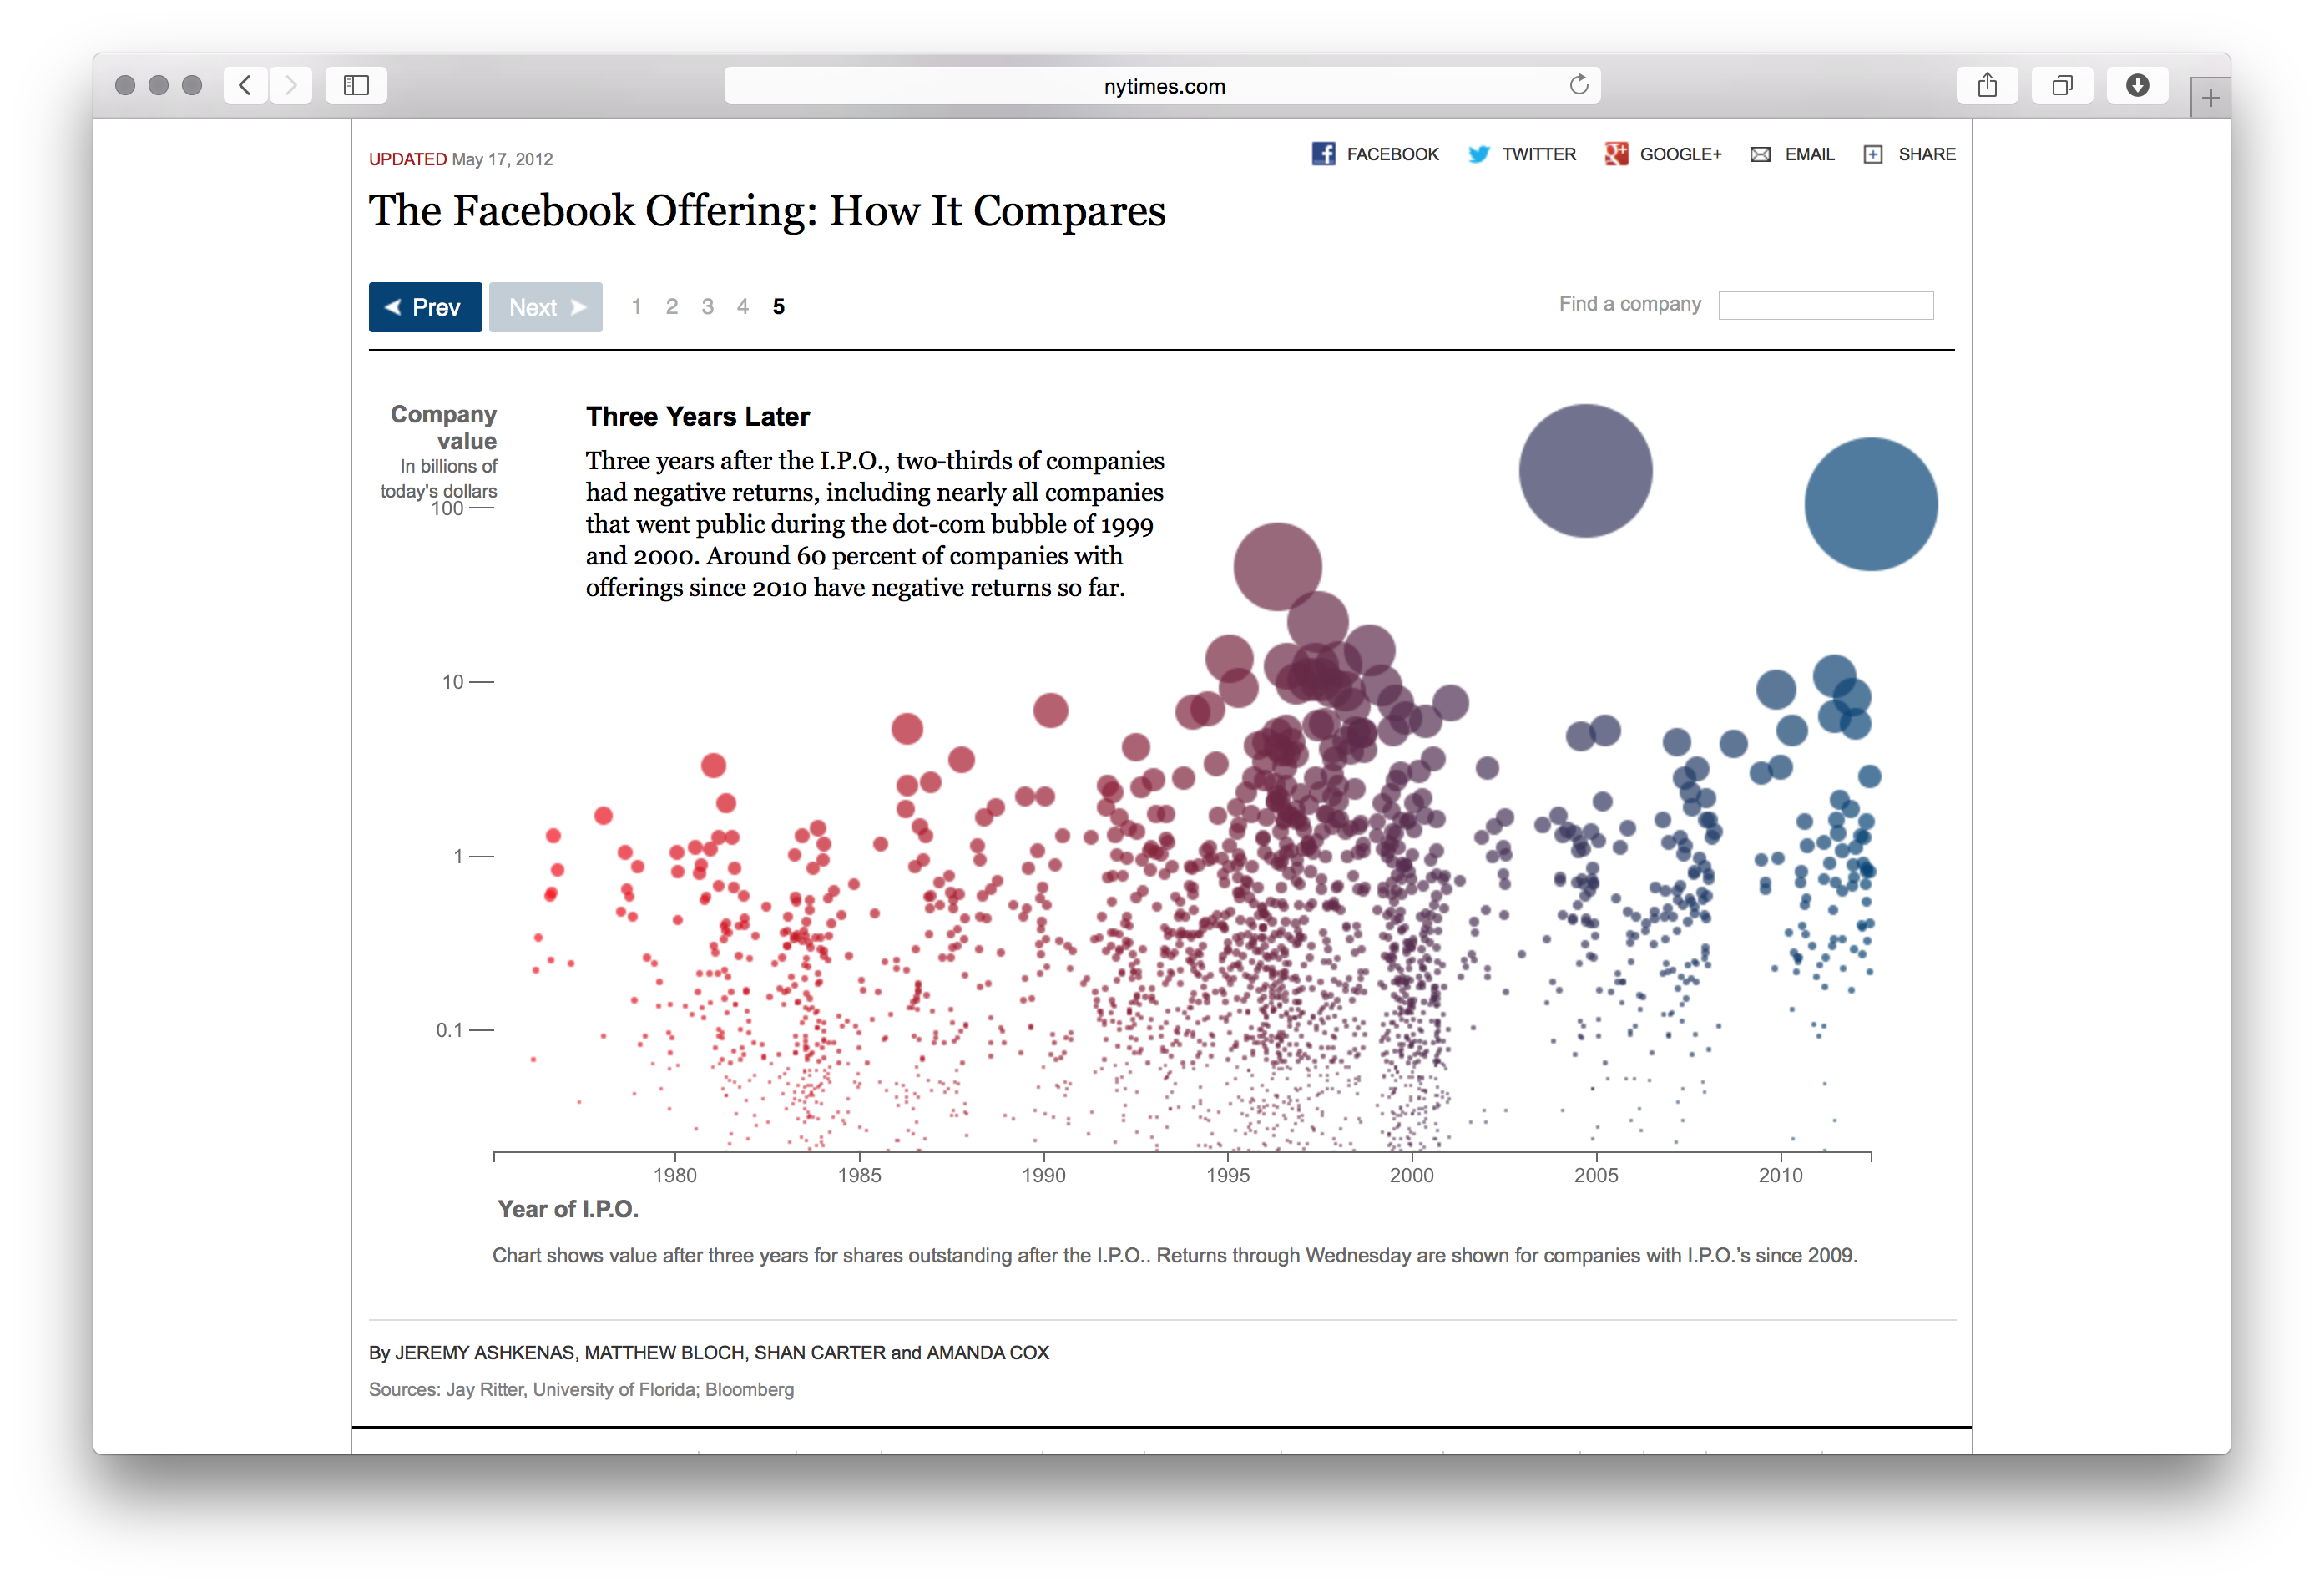
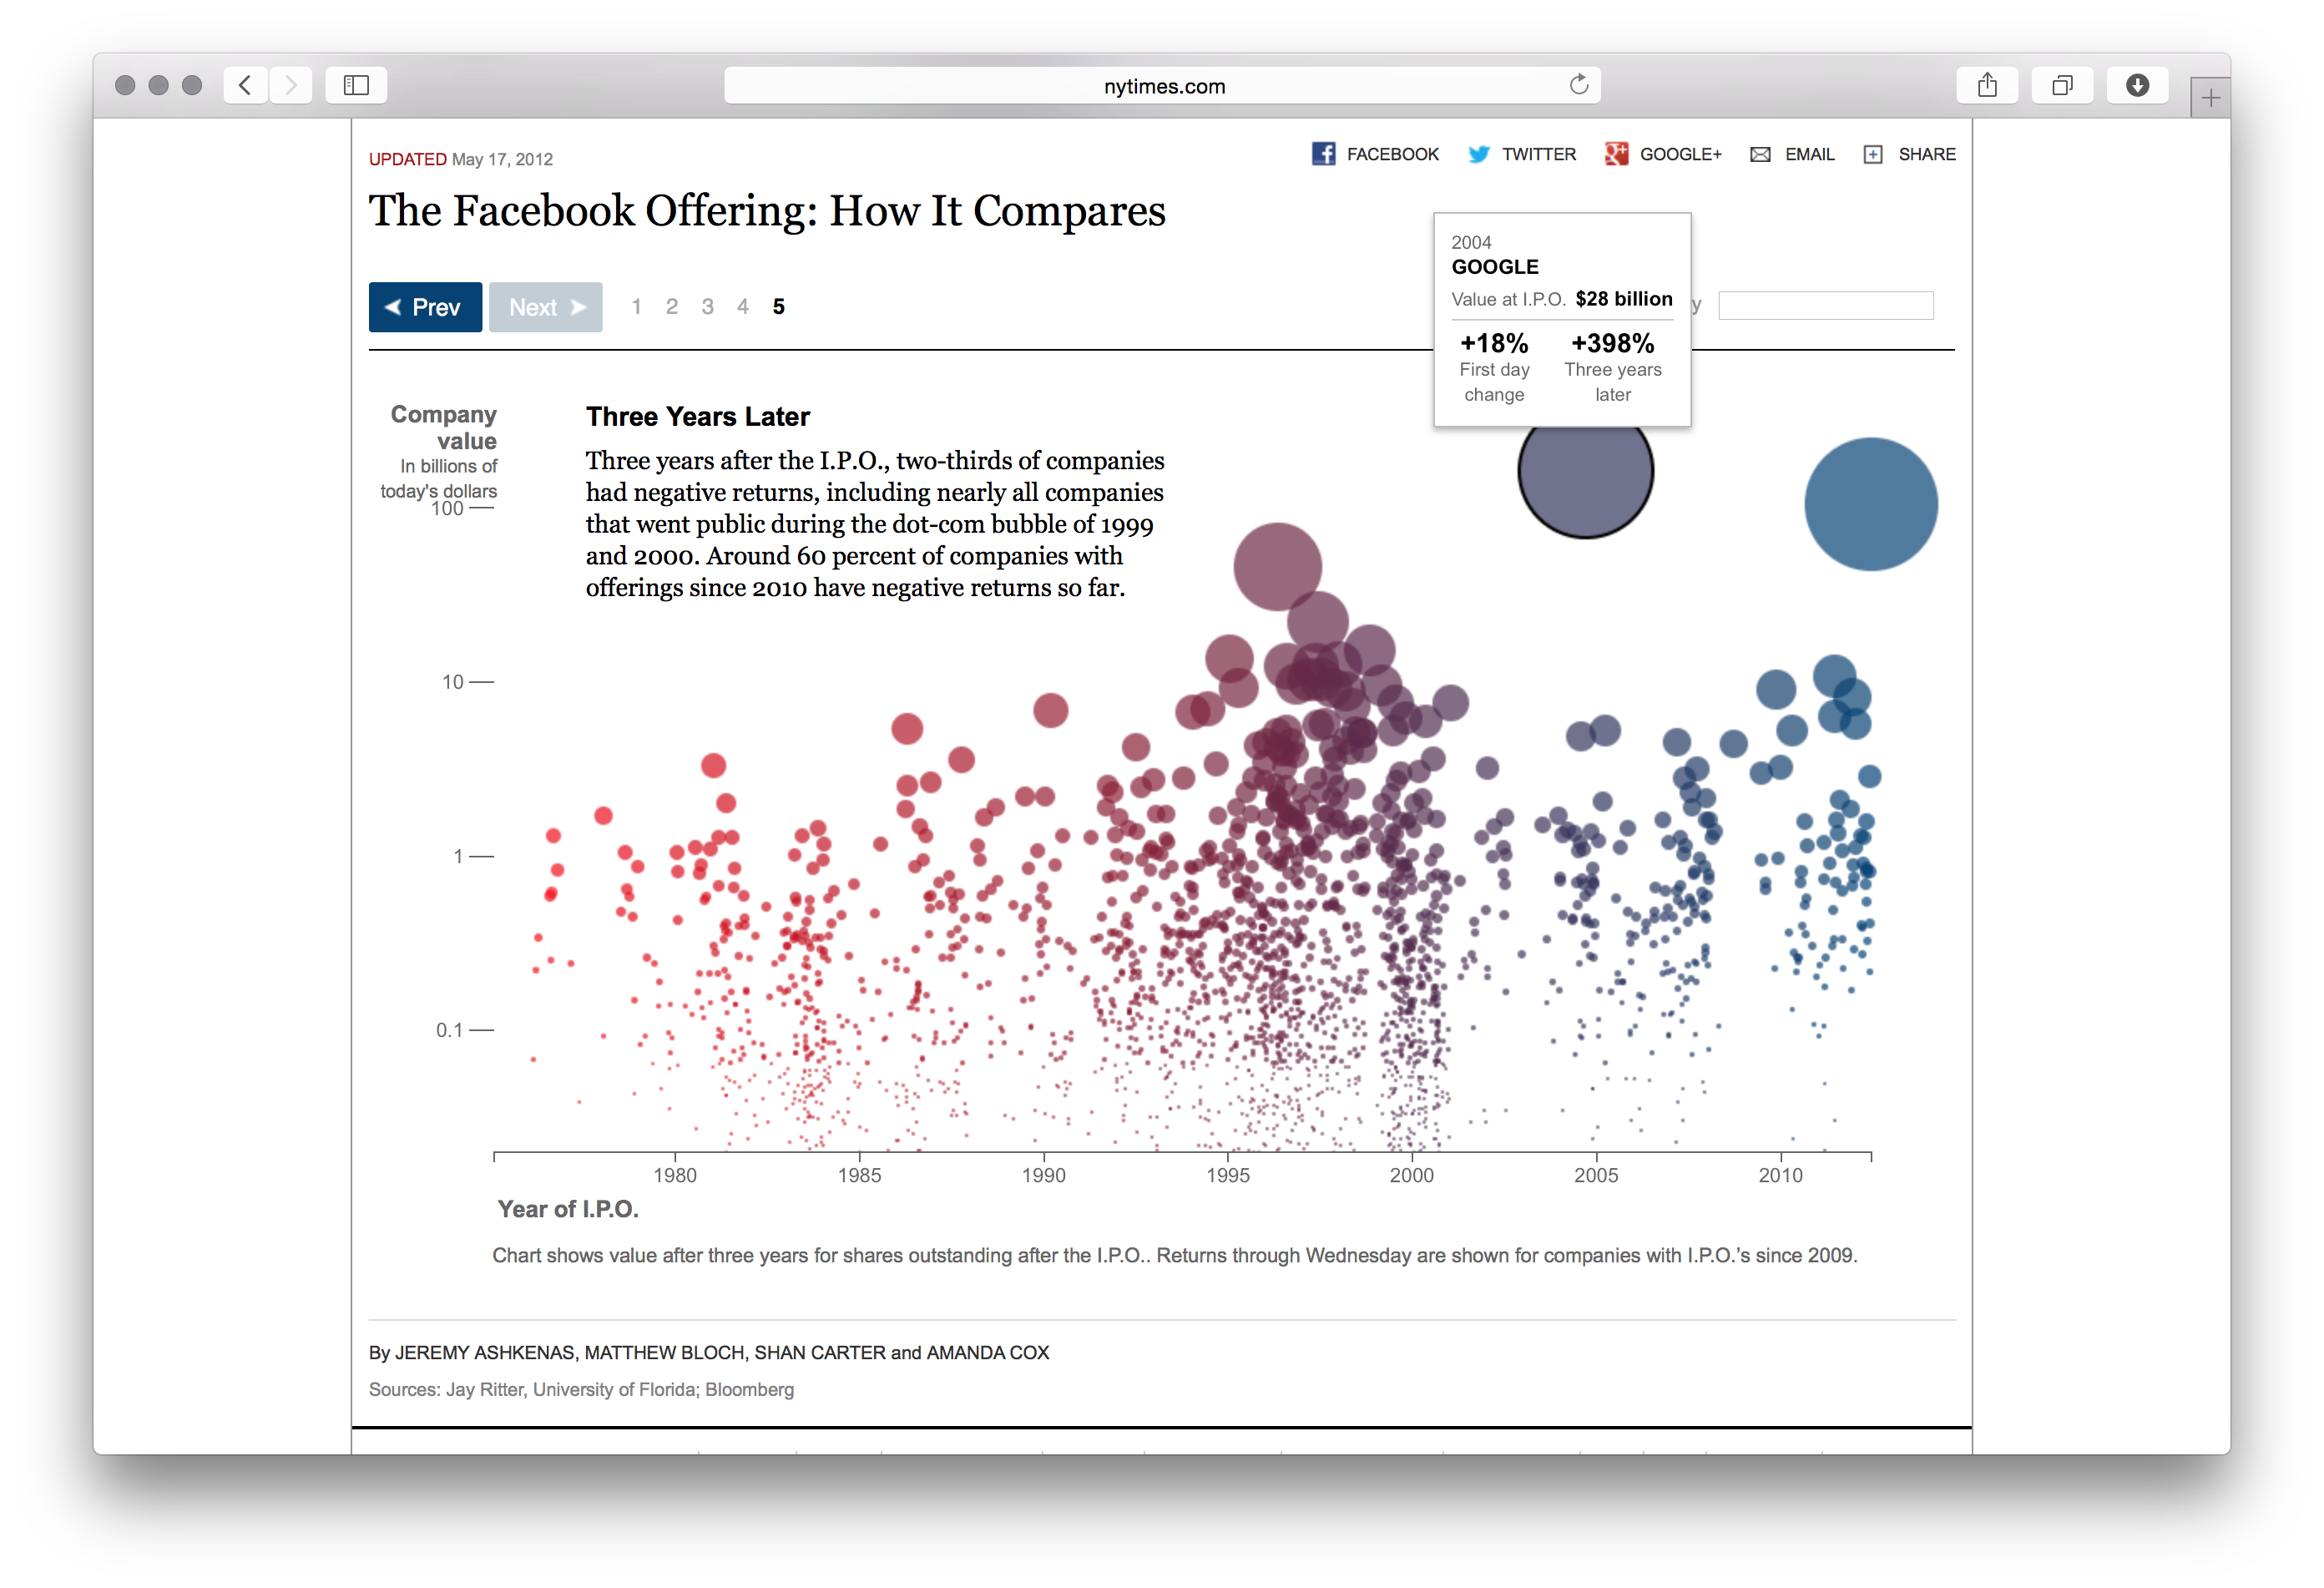
New York Times interactive visualization (May 2012) of Facebook's $104 billion initial public offering by Amanda Cox and the NYT graphics team. The piece addresses how words like "billion" and "trillion" feel like synonyms for "a lot," and asks: just how big was the Facebook I.P.O.? And how often do new technology stocks turn out to be good investments? To answer this, the graphic compares the Facebook I.P.O. with 2,400 other companies that went public, plotting their first-day performance and long-term returns. The interactive lets users explore whether tech IPOs live up to their hype — most don't. Cox, widely considered one of the most influential data journalists of her generation, joined the NYT as a graphics editor in 2005, became editor of The Upshot in 2016, and left in January 2022.