Description
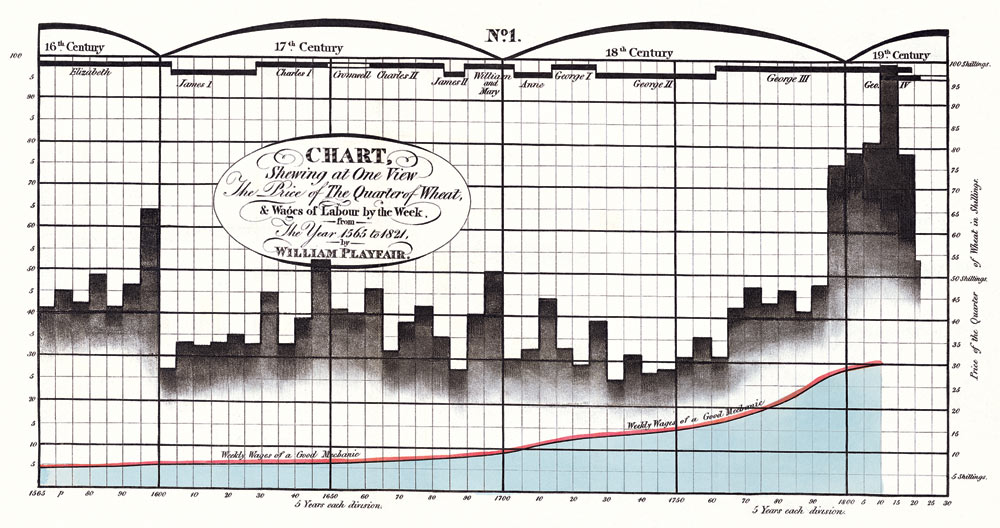
Historical data visualization examples from William Playfair (1759-1823) and Florence Nightingale (1820-1910), as reproduced in The Economist. Playfair, a Scottish engineer and political economist, single-handedly invented the line chart (1786), bar chart (1786), and pie chart (1801) in his "Commercial and Political Atlas" and "Statistical Breviary." Nightingale created the polar area diagram ("coxcomb chart") in 1858 to show preventable deaths in the Crimean War. Both are foundational figures in data visualization history — Playfair as the inventor of its basic vocabulary, Nightingale as a pioneer of using visual evidence to change policy. Their innovations remain the most widely used chart types today.