Description
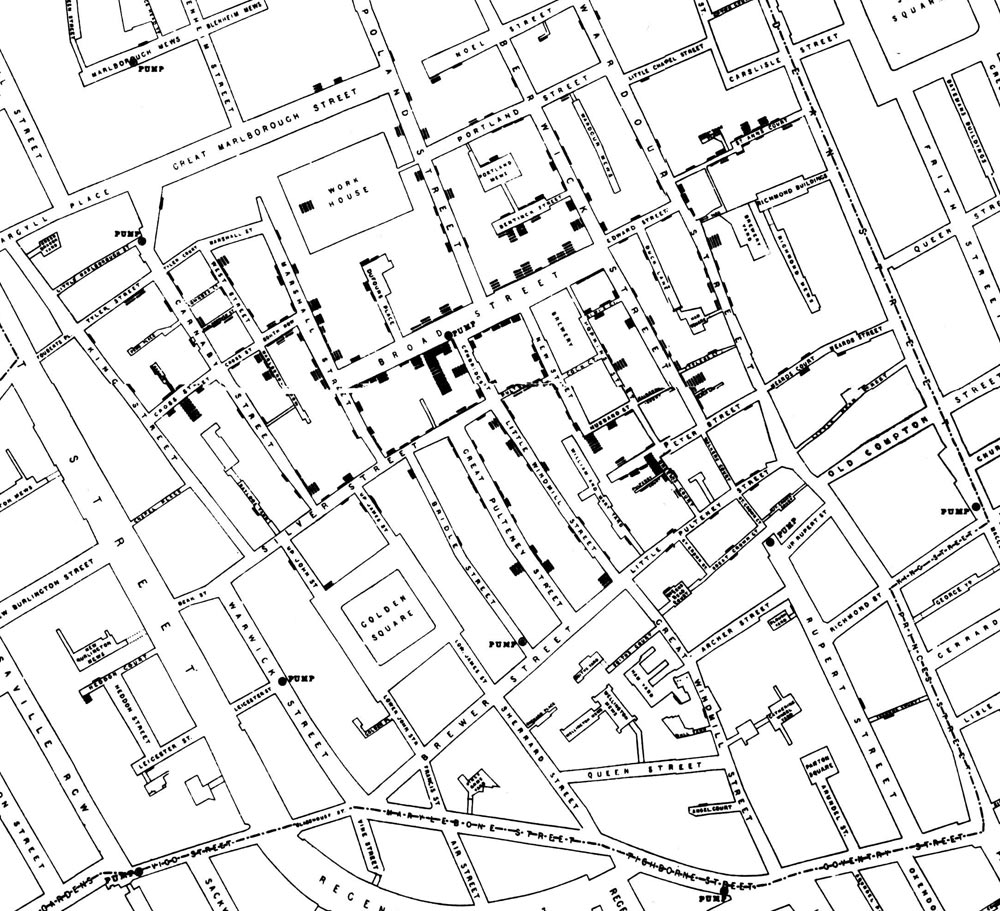
John Snow's 1854 map of cholera deaths in Soho, London, identifying the Broad Street water pump as the outbreak source. Snow plotted each cholera death as a bar stacked along the street where it occurred, creating a dot-density map that made the spatial cluster around the pump visually undeniable. He used this evidence to persuade local authorities to disable the pump, and the outbreak subsided. A foundational work in epidemiology and thematic mapping, widely cited by Edward Tufte in "The Visual Display of Quantitative Information." Snow's map remains one of the most famous examples of data visualization in history, demonstrating how spatial analysis can reveal causation.