Description
I'm interested in building systems that create visual constructions from large bodies of information. The methods used in designing static chunks of data: charting, graphing, sorting and the rest (see the books by Tufte for the complete run-down) are well understood, but much interesting work remains in finding models and representations for examining dynamic sources of data, or very very large data sets. For this work, I'm employing behavioral methods and distributed systems which treat individual pieces of information as elements in an environment that produce a representation based on their interactions. Valence is a software experiment that addresses these issues.
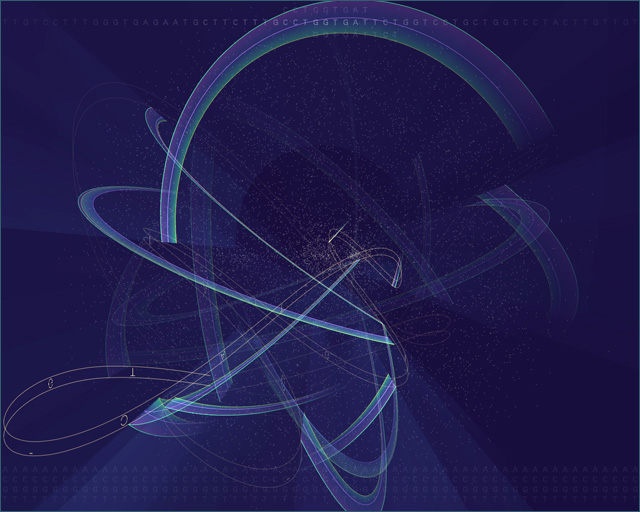
The image on this page is taken from a visualization of the contents of the book "The Innocents Abroad" by Mark Twain. The program reads the book in a linear fashion, dynamically adding each word into three-dimensional space. The more frequently particular words are found, they make their way towards the outside (so that they can be more easily seen), subsequently pushing less commonly used words to the center. Each time two words are found adjacent in the text, they experience a force of attraction that moves them closer together in the visual model.
The result is a visualization that changes over time as it responds to the data being fed to it. Instead of less useful numeric information (i.e. how many times the word 'the' appeared), the piece provides a qualitative feel for the perturbations in the data, in this case being the different types of words and language being used throughout the book.
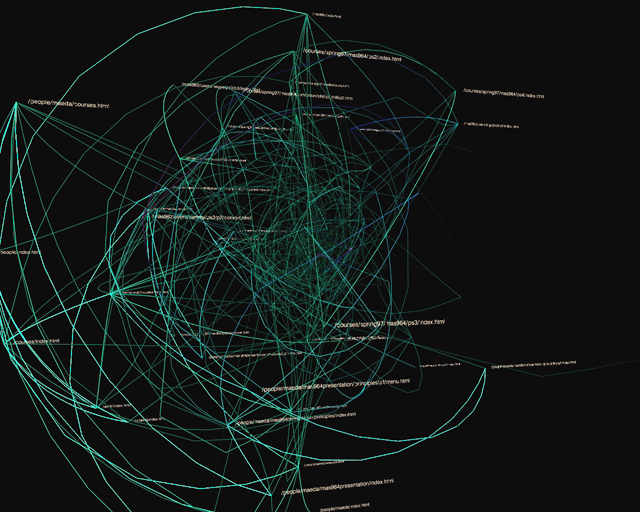
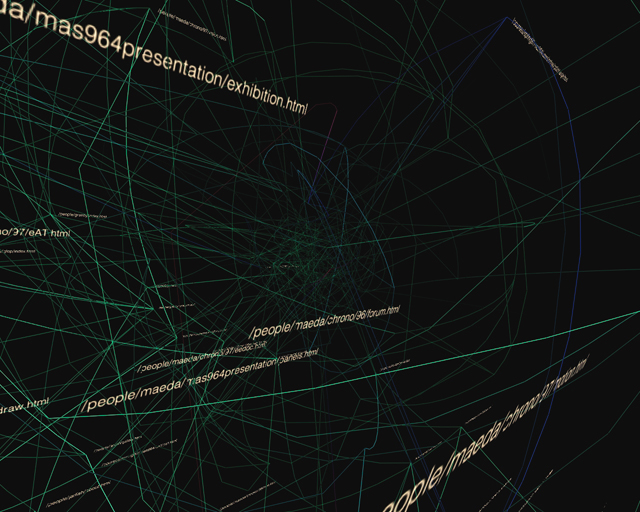
The premise is that the best way to understand a large body of information, whether it's a 200,000 word book, usage data from a web site, or financial transaction information between two multinational corporations, is to provide a feel for general trends and anomalies in the data, by providing a qualitative slice into how the information is structured. The most important imformation comes from providing context and setting up the interrelationships between elements of the data. If needed, one can later dig deeper to find out specifics, or further tweak the system to look at other types of parameters.