Description
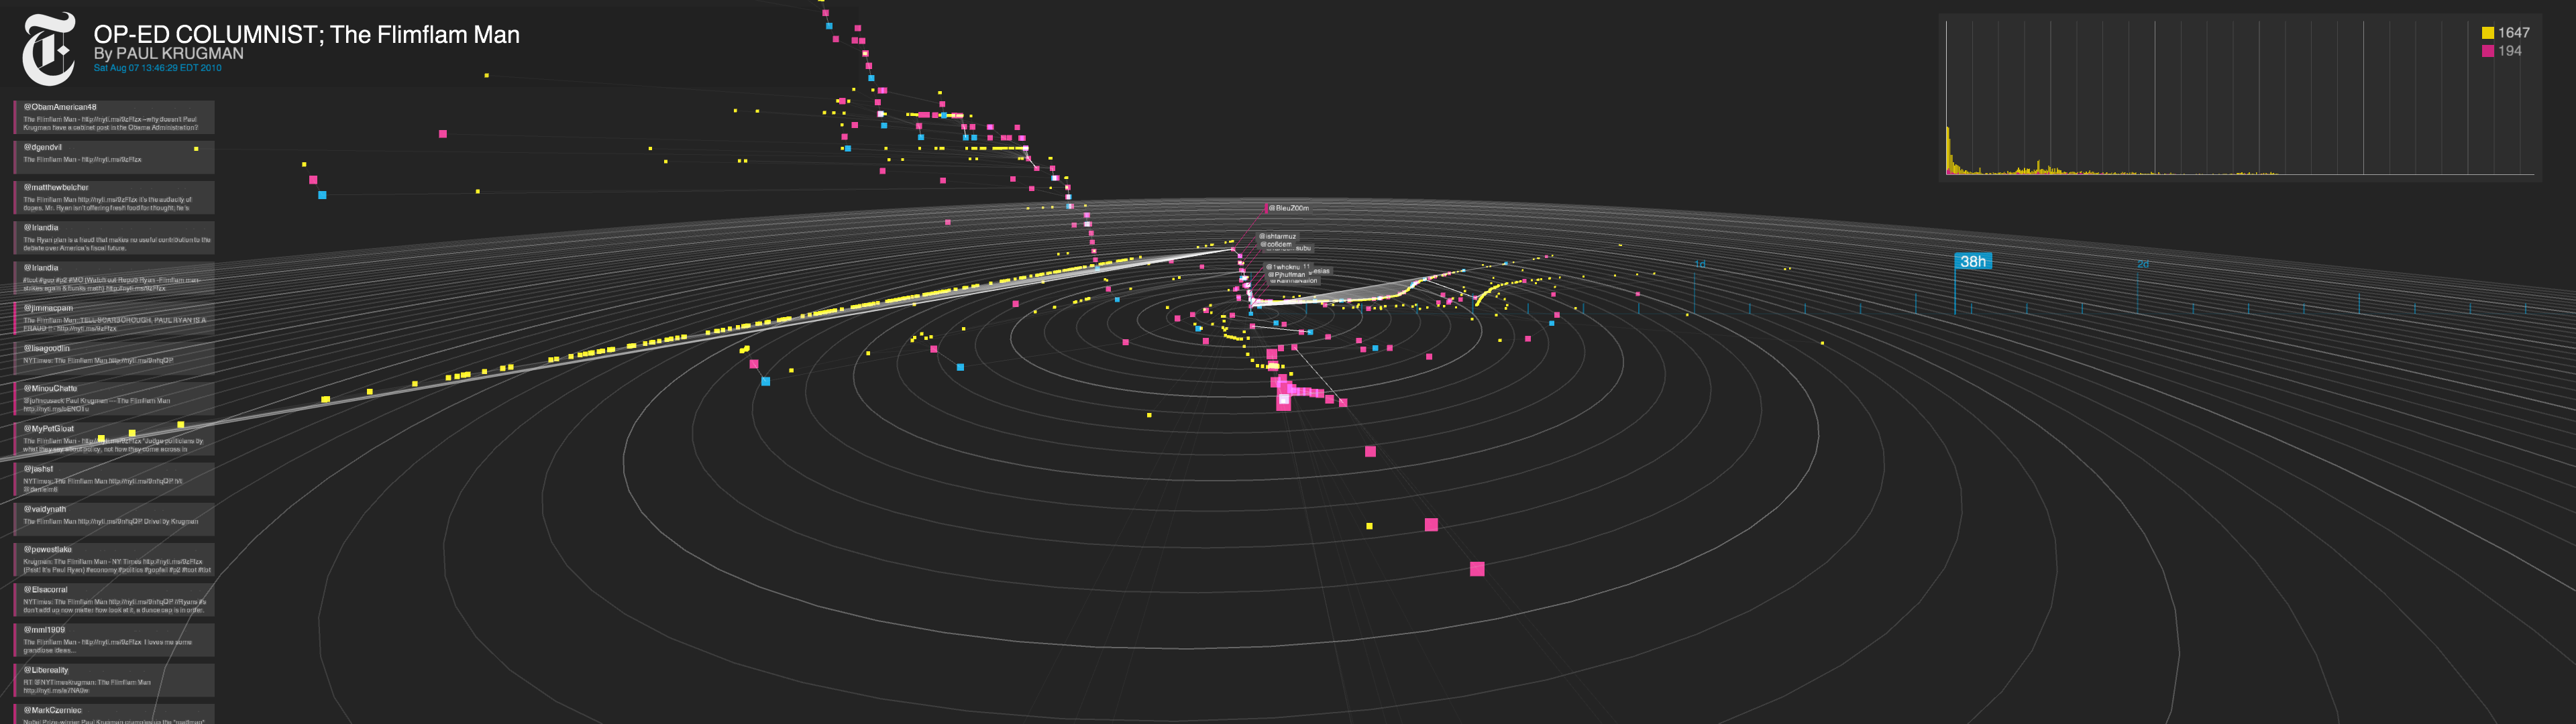
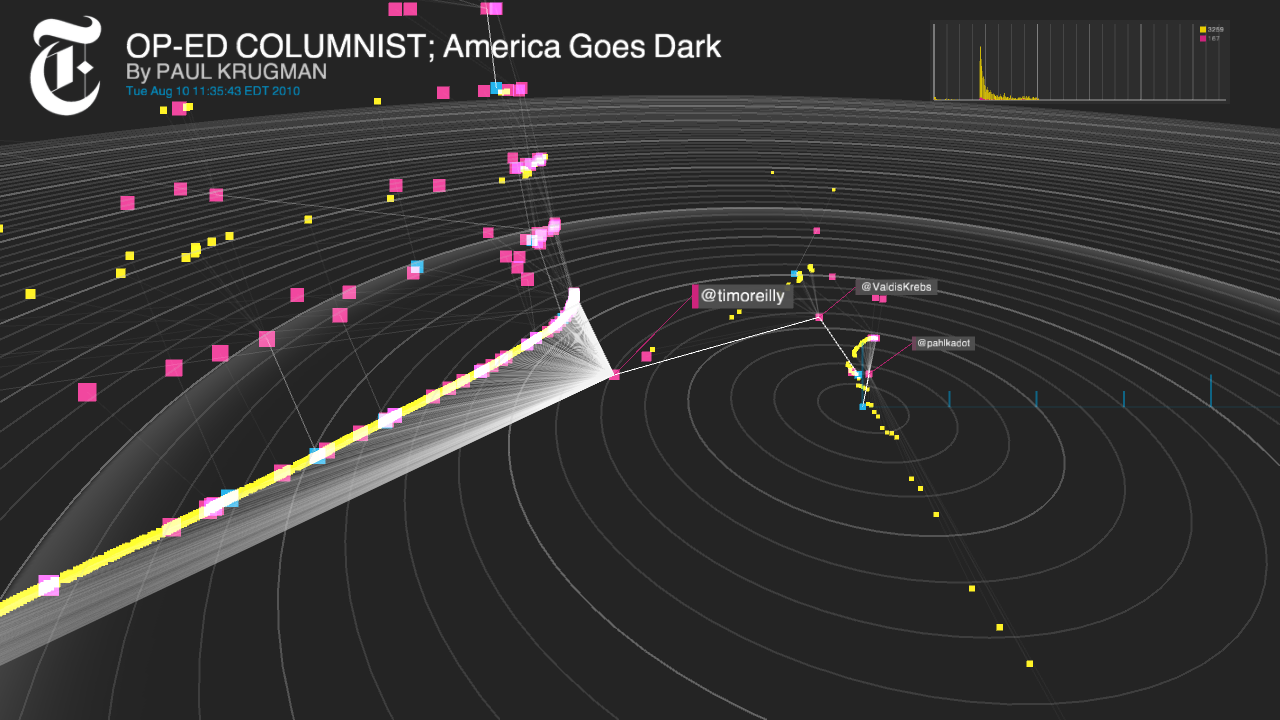
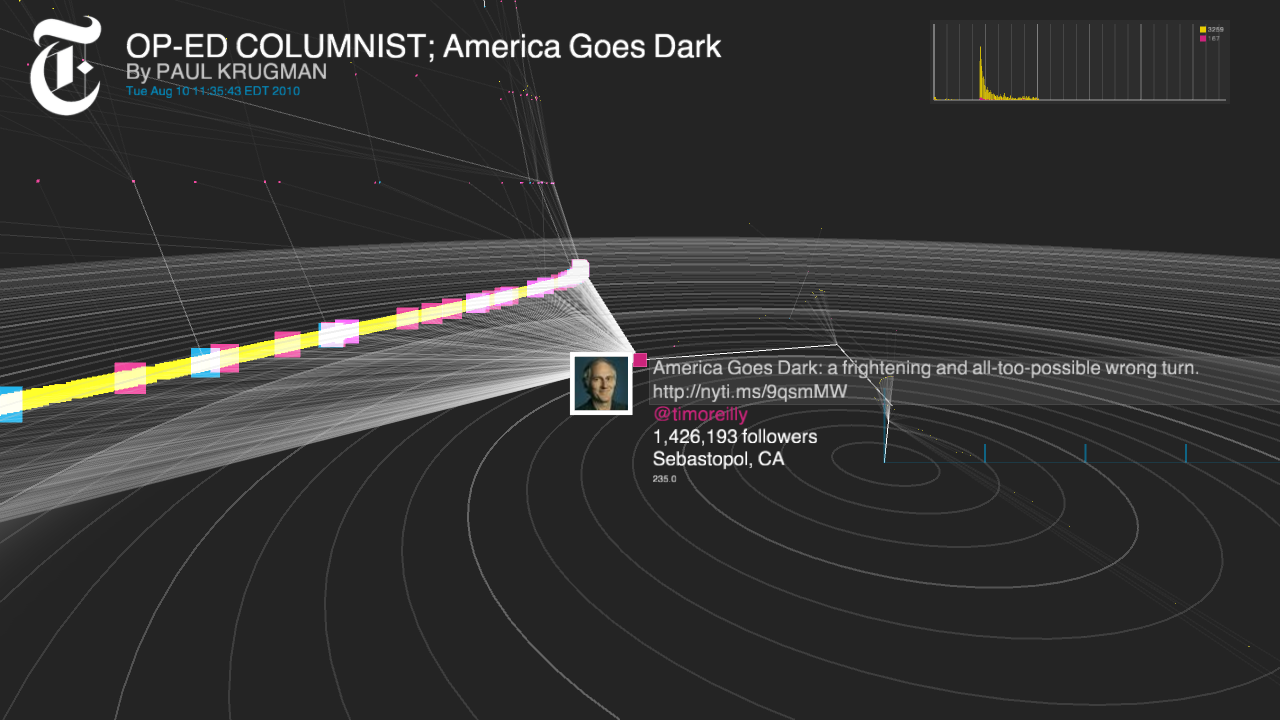
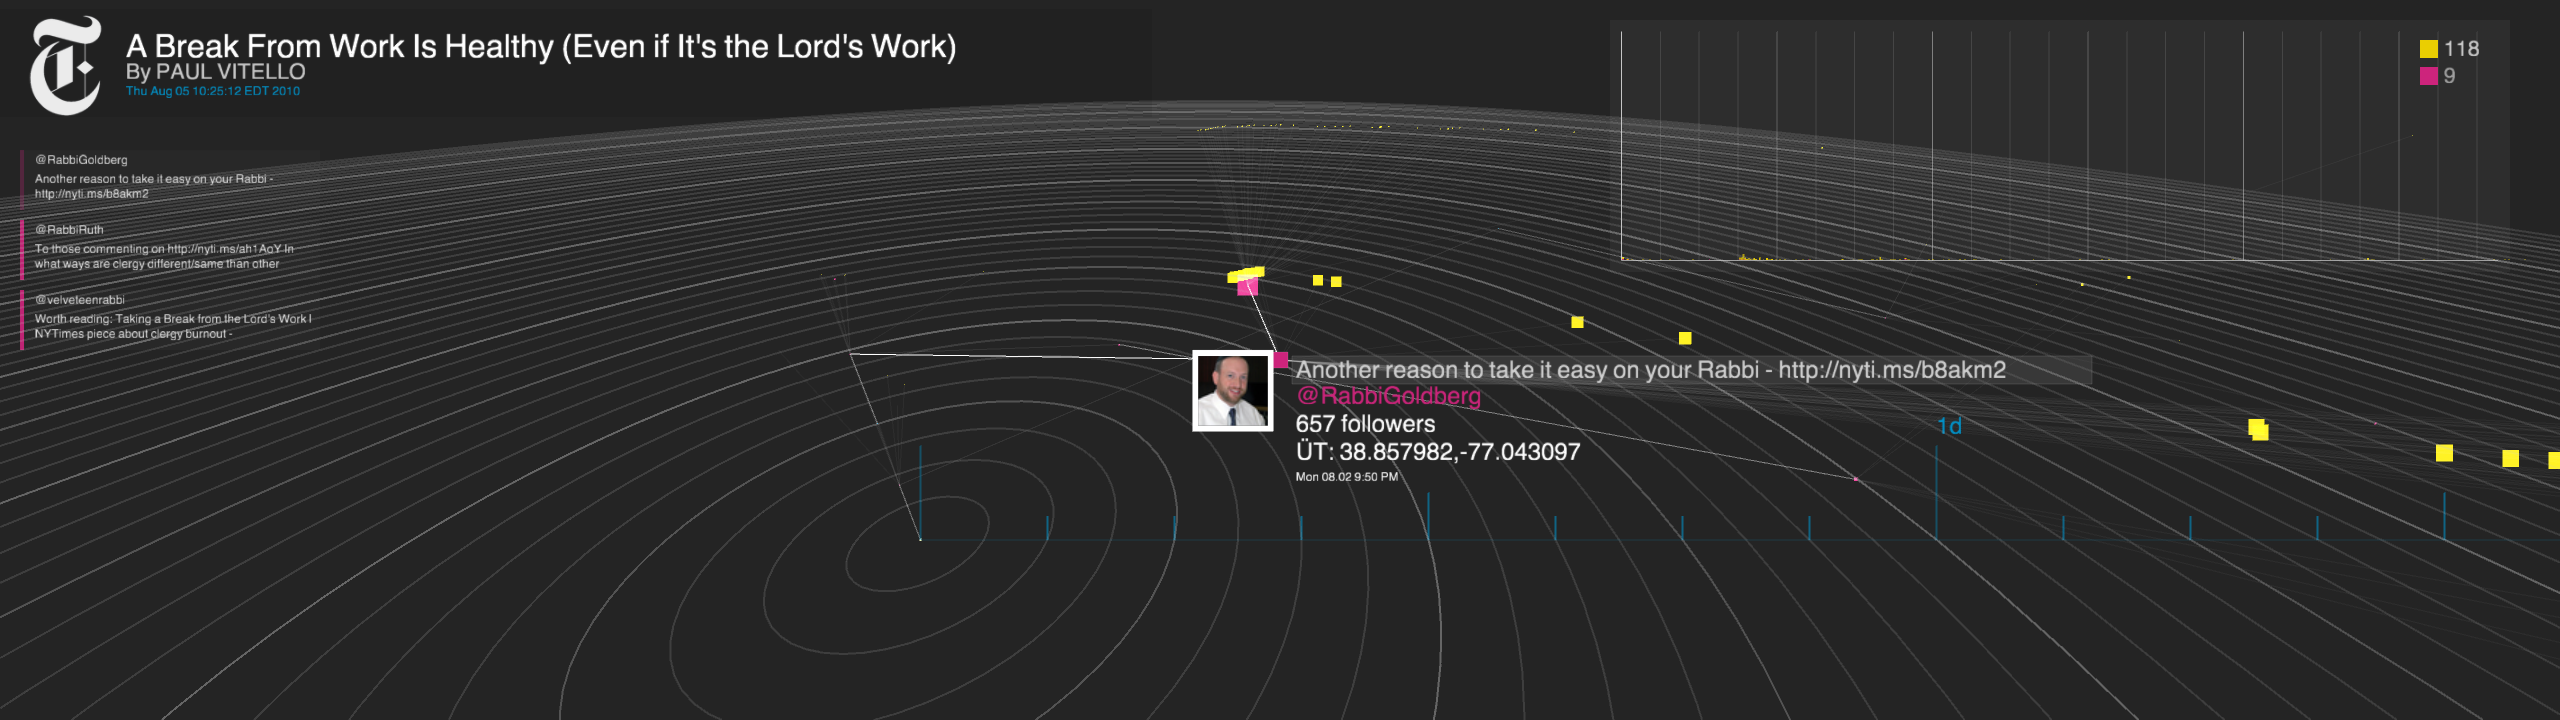
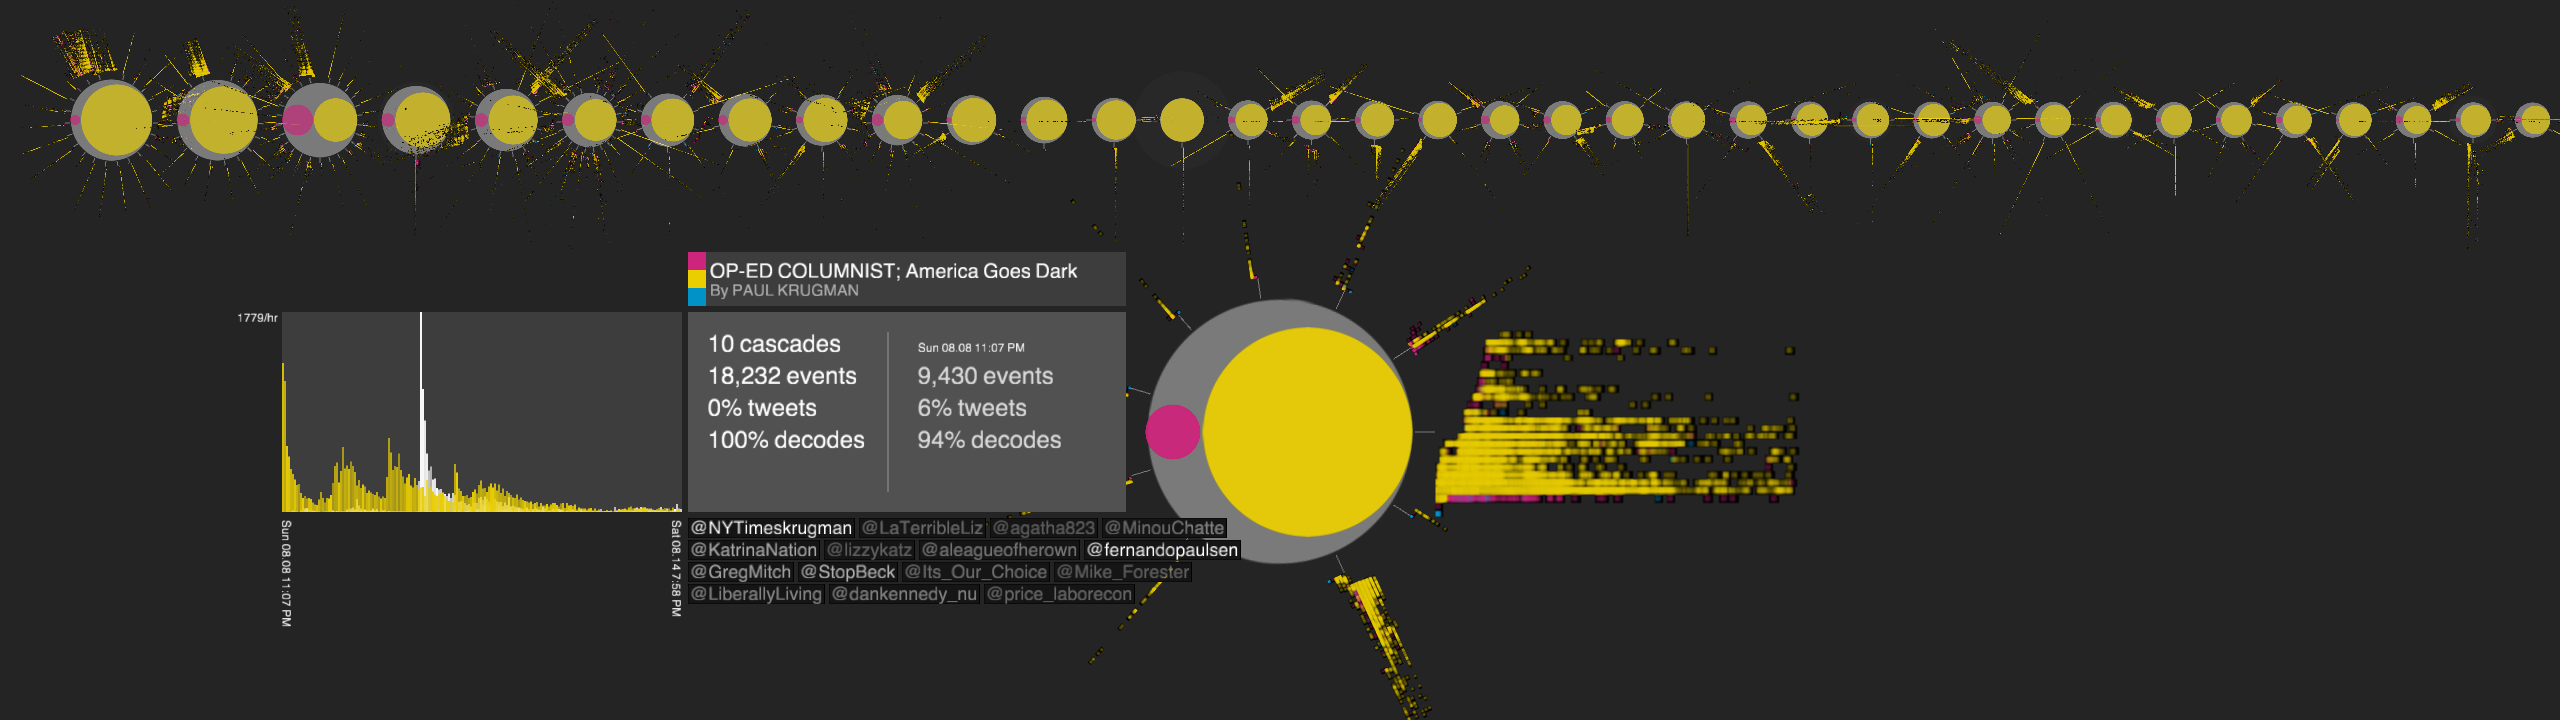
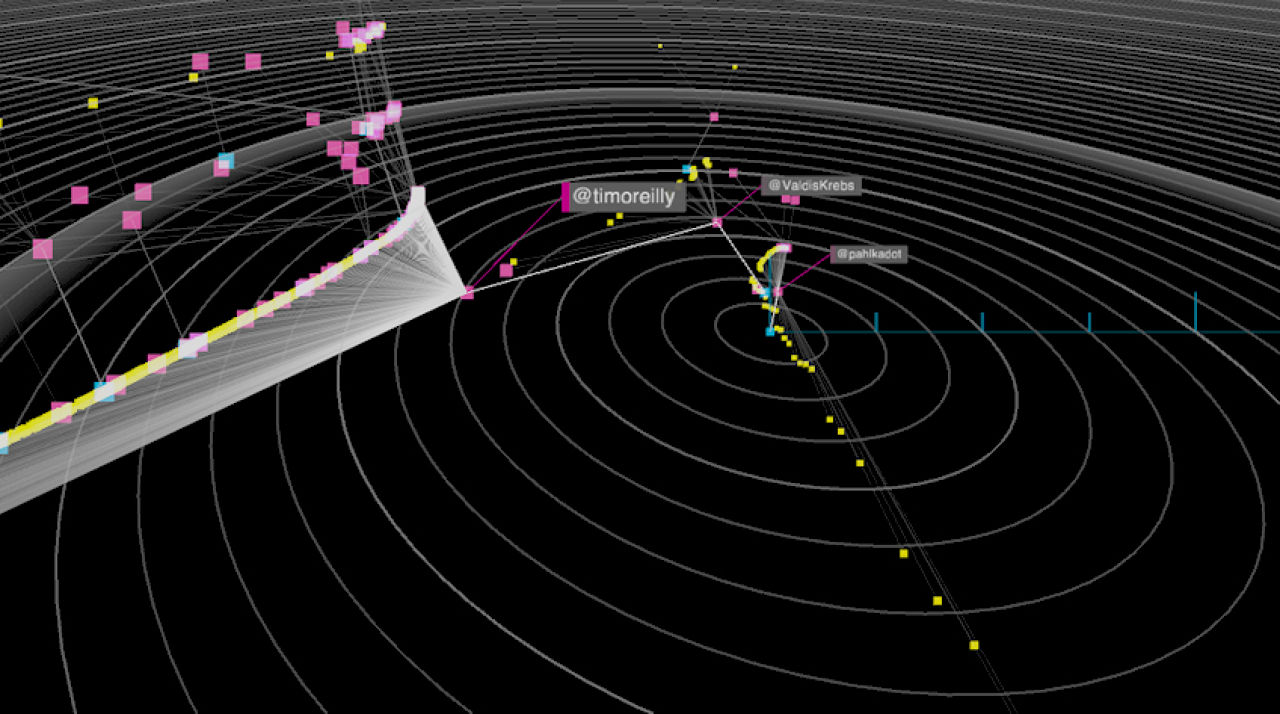
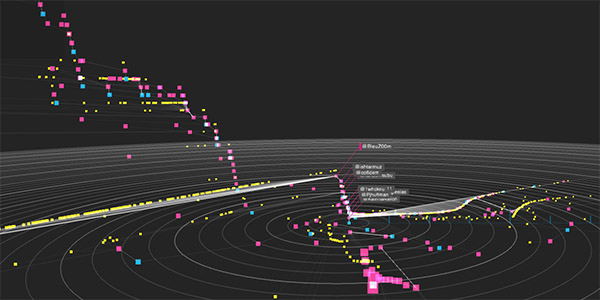
Cascade is a visualization tool built by the New York Times R&D Lab, created by Jer Thorp (data artist in residence), Mark Hansen (UCLA statistics professor), and Jake Porway (staff data scientist). The project explores how news stories spread through social networks, showing cascades of sharing activity that reveal the life stories take in the social space — how articles are tweeted, re-tweeted, and re-shared across platforms over hours and days. The visualization renders each sharing event as a node dropping down a waterfall-like display, with subsequent shares branching off into sub-cascades. Covered by Nieman Lab in 2011, Cascade represented an early and significant effort to understand the dynamics of online news diffusion and identify which stories achieve viral spread versus linear growth.