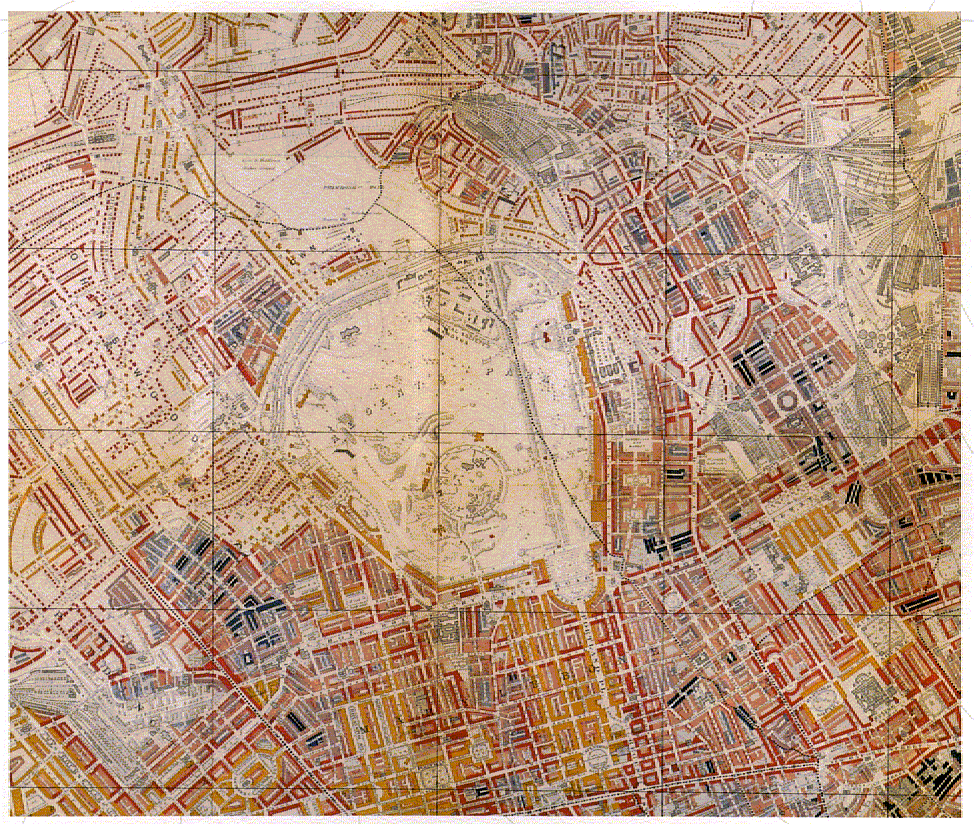
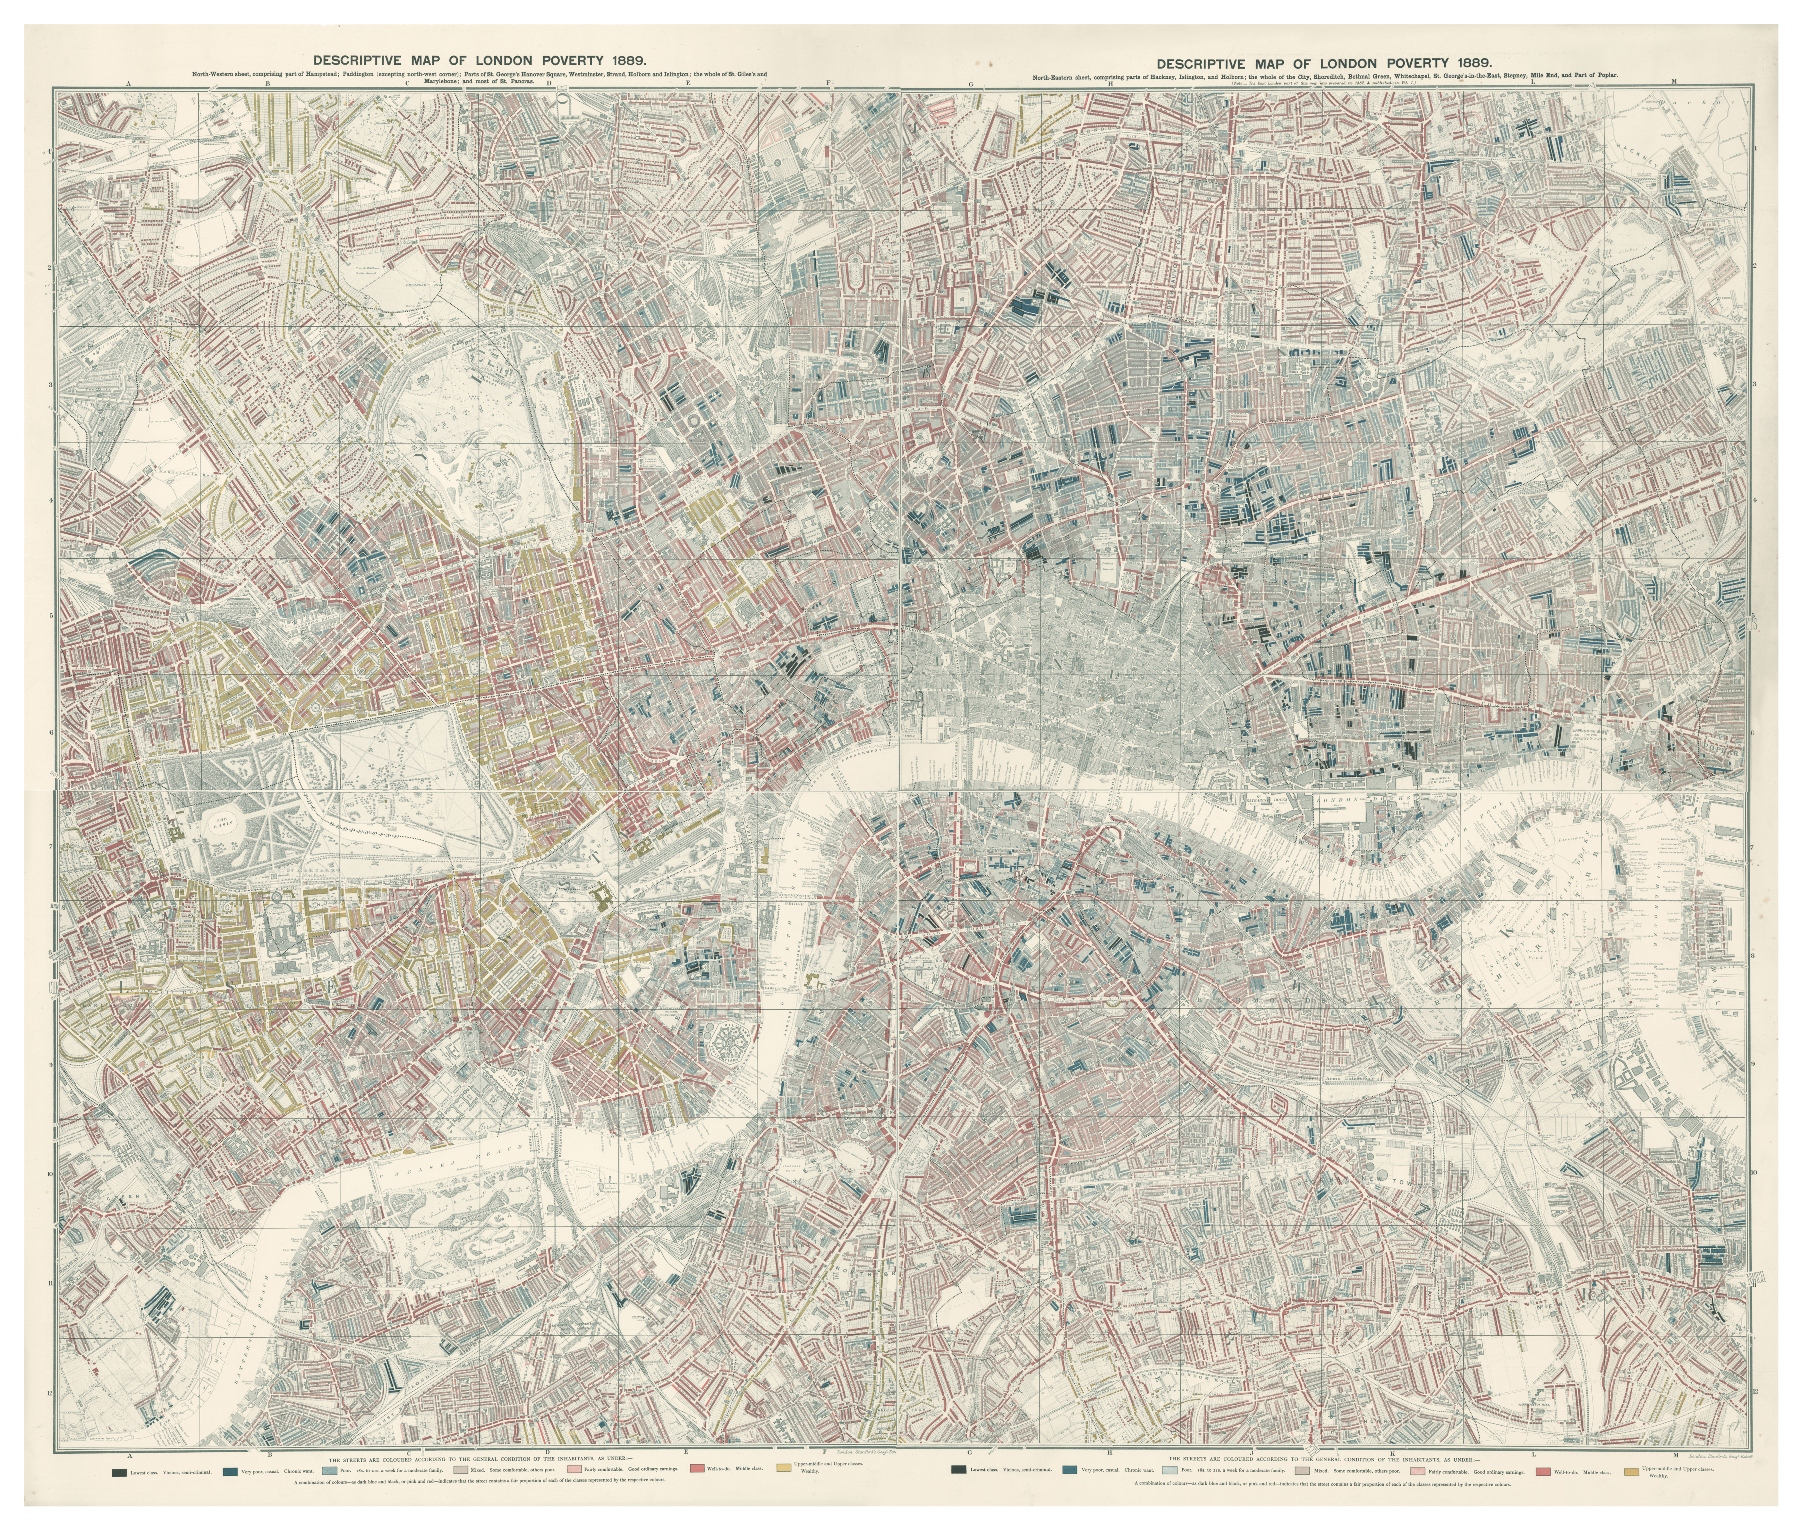
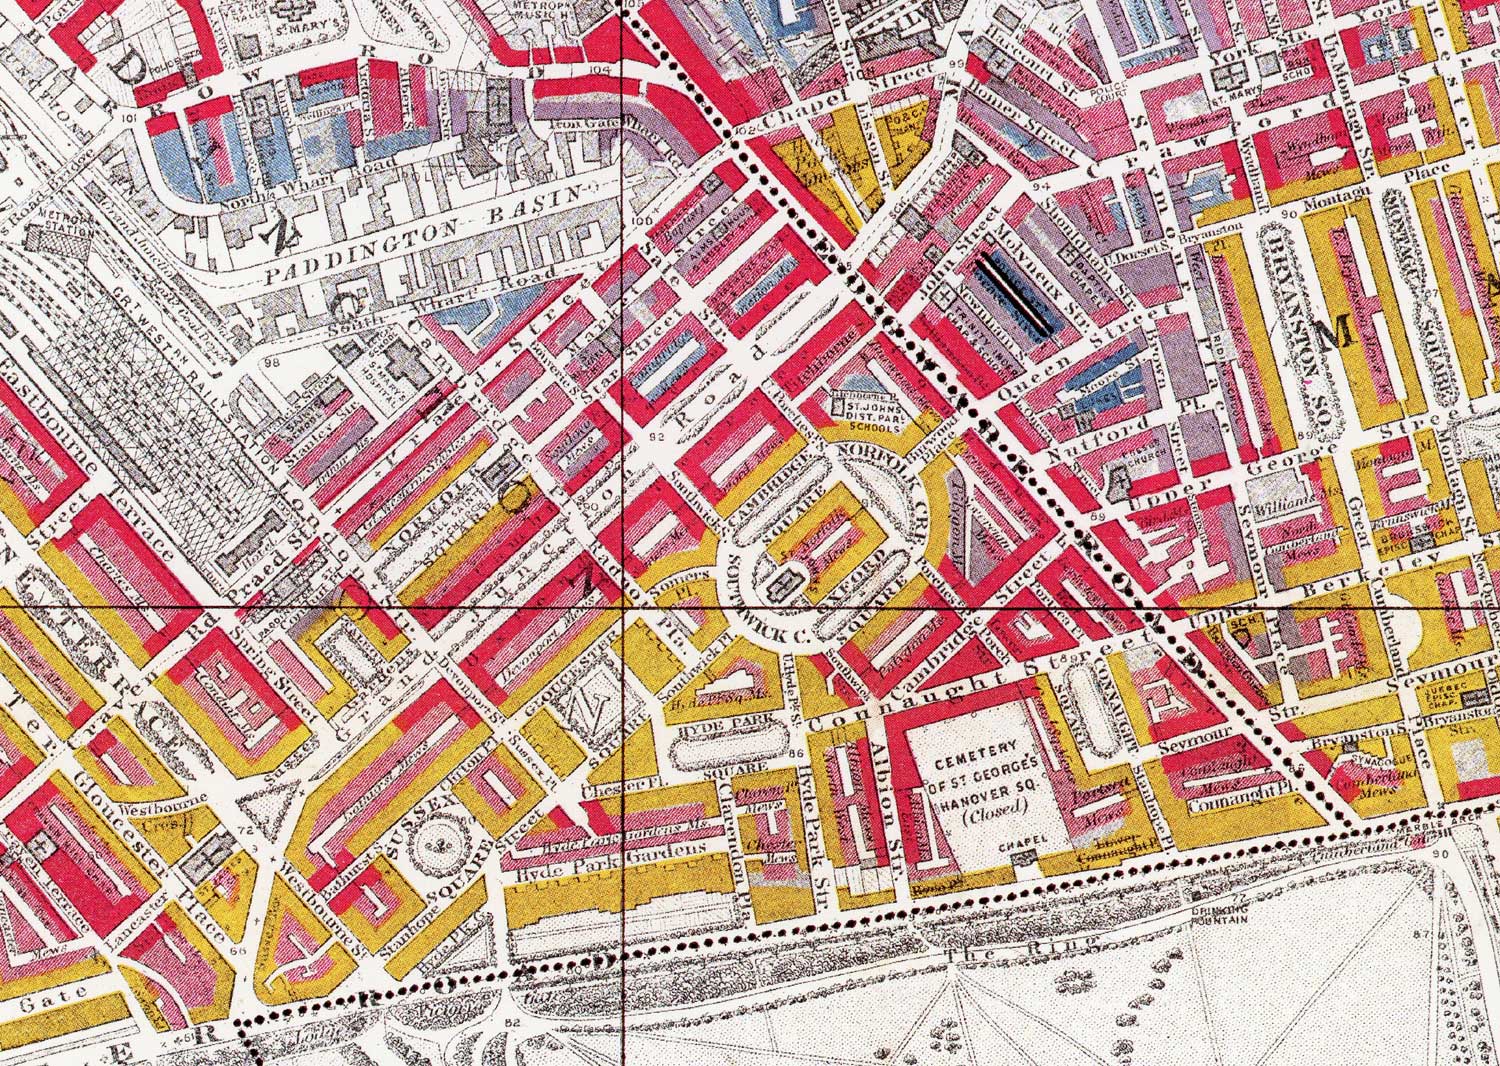
Description
Charles Booth's Maps Descriptive of London Poverty (1886-1903), an early example of social cartography in which each street is coloured to indicate the income and social class of its inhabitants. Seven classes range from black (lowest class, "vicious, semi-criminal") to yellow (upper-middle class, "wealthy"). The 12 maps cover London from Hammersmith to Greenwich, Hampstead to Clapham. A pioneering work produced as part of Booth's Inquiry into Life and Labour in London. Now digitized by the London School of Economics.