Description
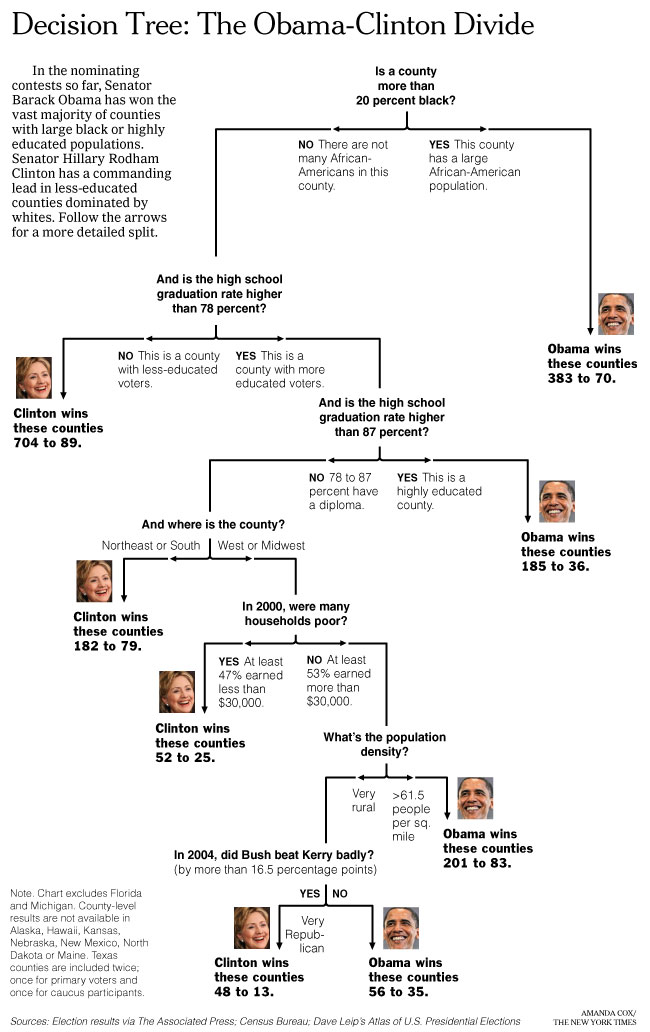
New York Times decision tree graphic mapping possible outcomes in the 2008 Democratic primary race between Barack Obama and Hillary Clinton. The visualization showed how the remaining primary contests and delegate counts could combine to determine the nominee, with branching paths for different win/loss scenarios in each state. The graphic exemplified the NYT's approach to making electoral math comprehensible through interactive design, produced by a graphics team that included Amanda Cox, Matthew Ericson, and others who pioneered political data visualization in American journalism.