Description
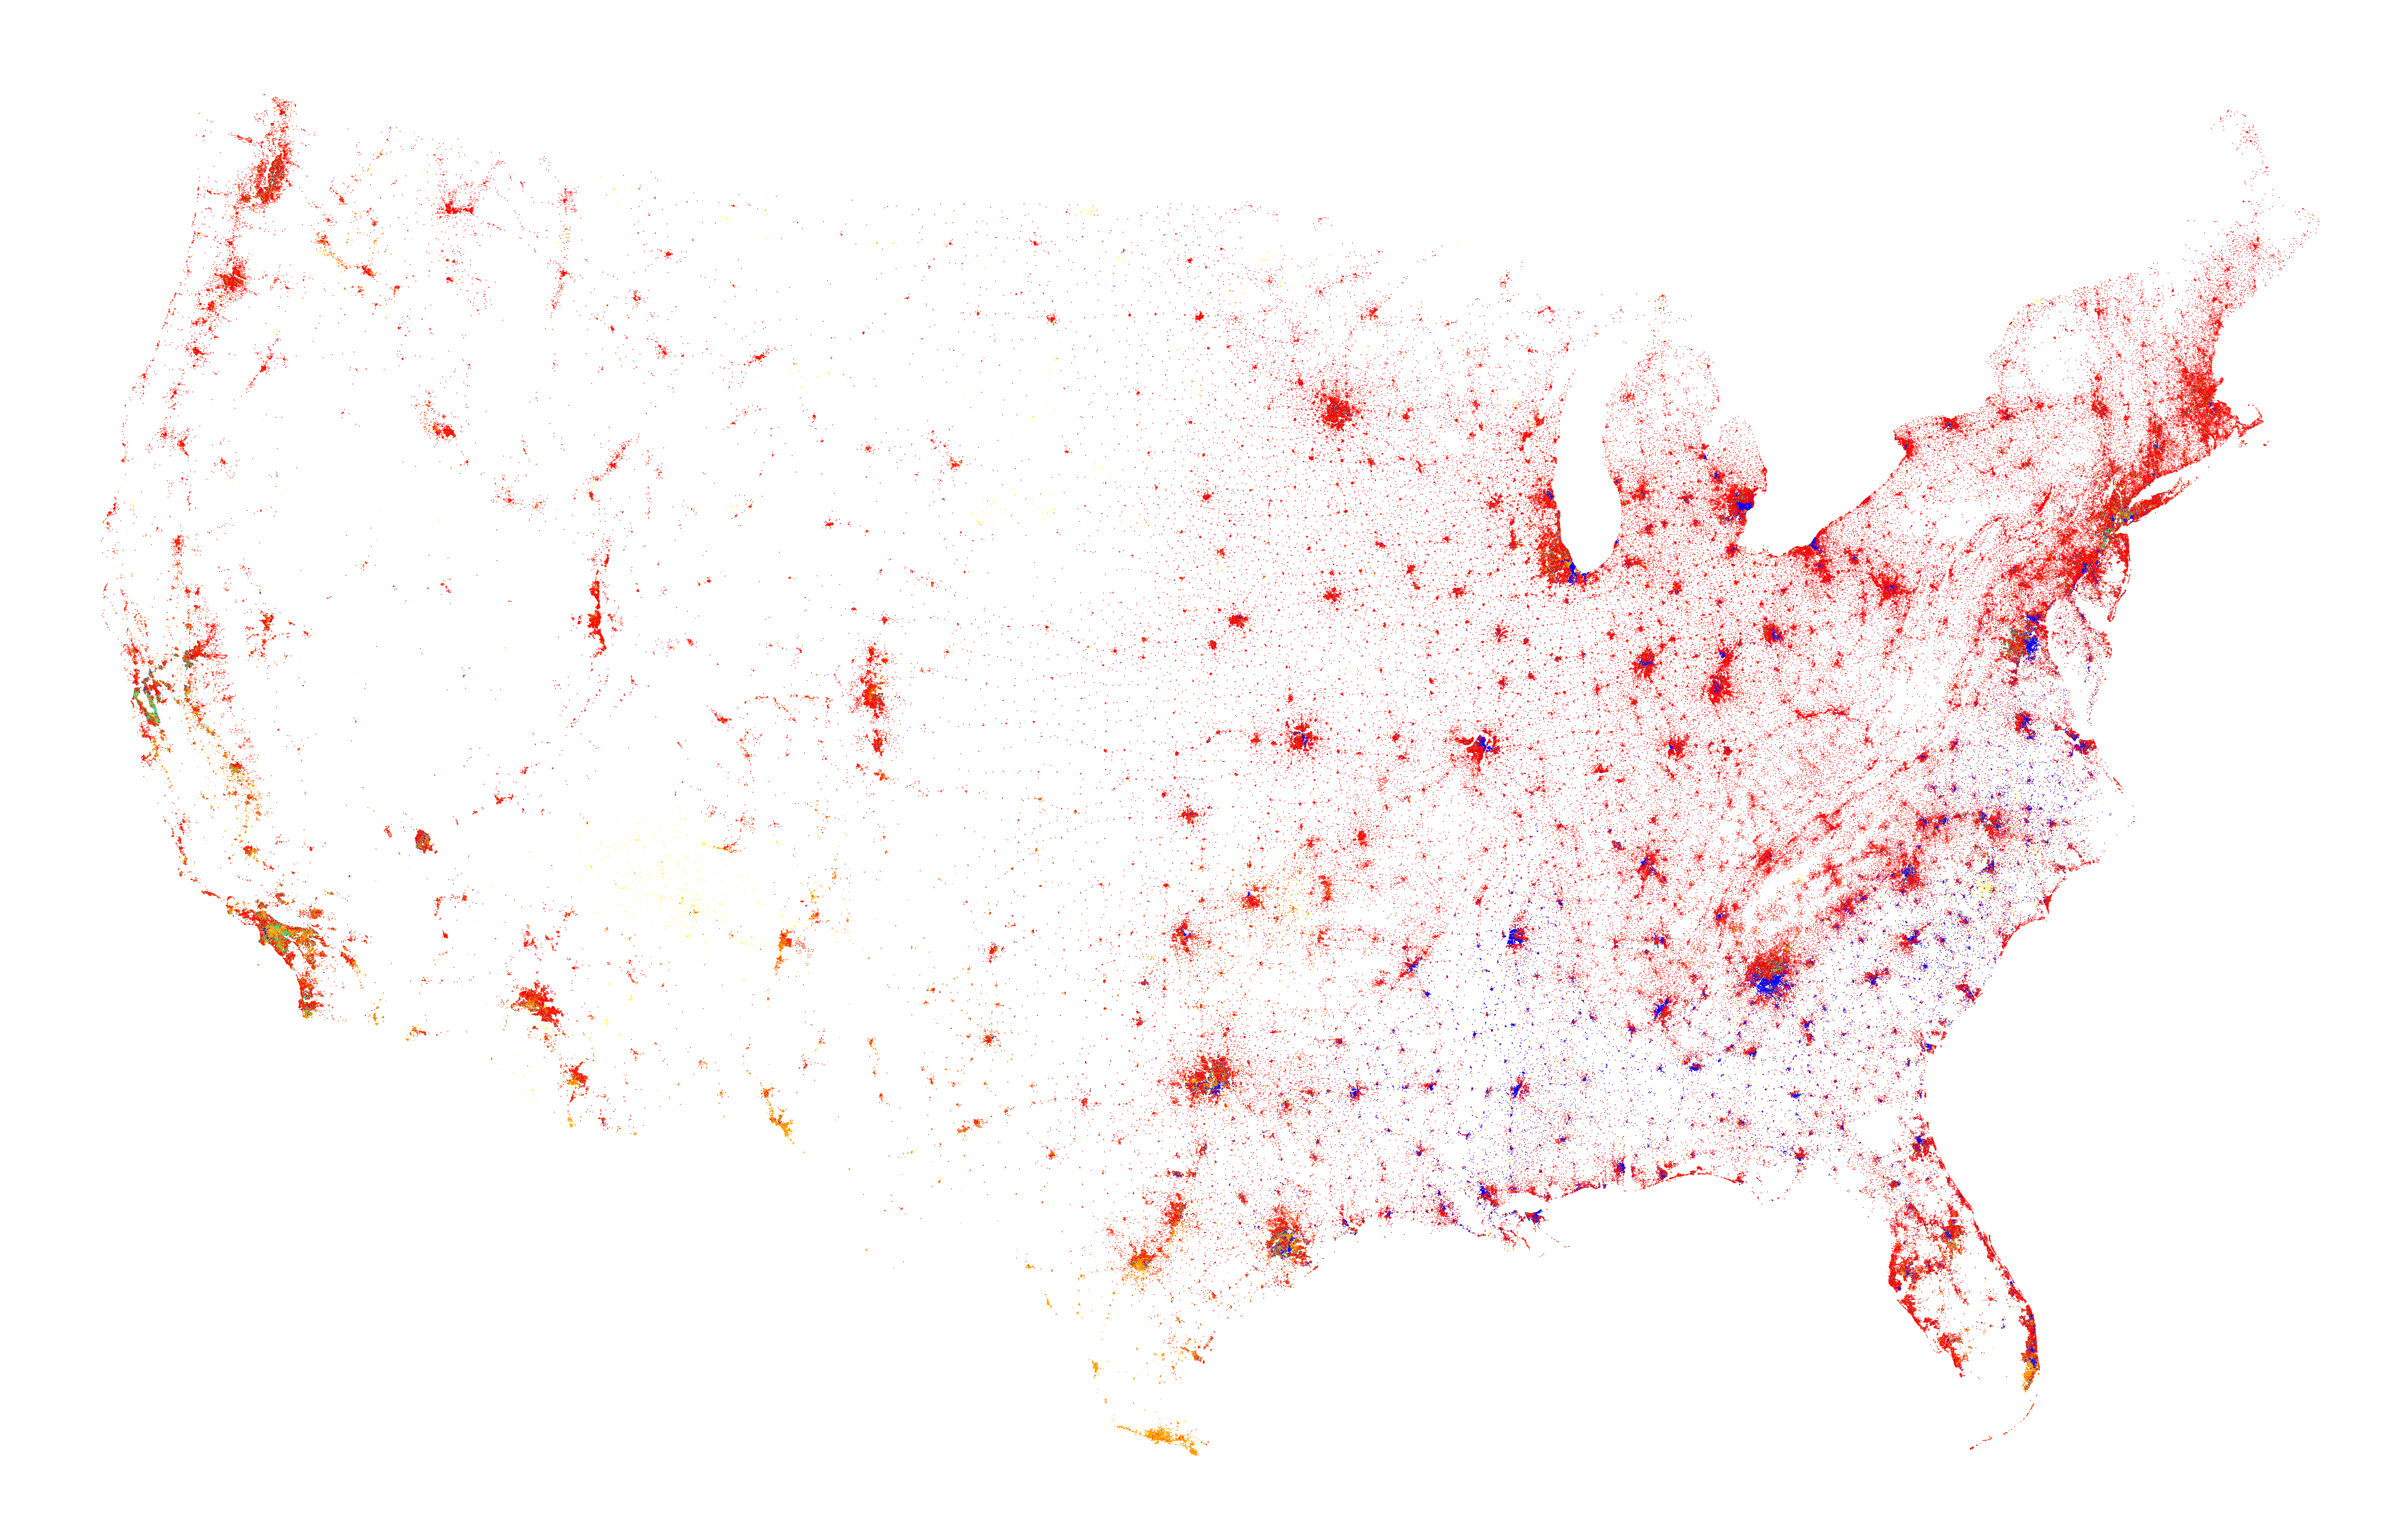
Demographic mapping of the continental United States by Eric Fischer, visualizing census data patterns across the entire country at once. Part of the same racial dot map series as his city-level maps, using one dot per person colored by race/ethnicity (red for White, blue for Black, green for Asian, orange for Hispanic, gray for Other — each dot representing 25 people from Census 2000 data). At the national scale, the map reveals the geographic distribution of racial and ethnic groups across America — the predominantly white rural Midwest, the Black Belt stretching across the South, Hispanic concentrations along the border, and the multiethnic coastal cities. A separate entry from the Census Dot Map to represent the national-scale view.