Description
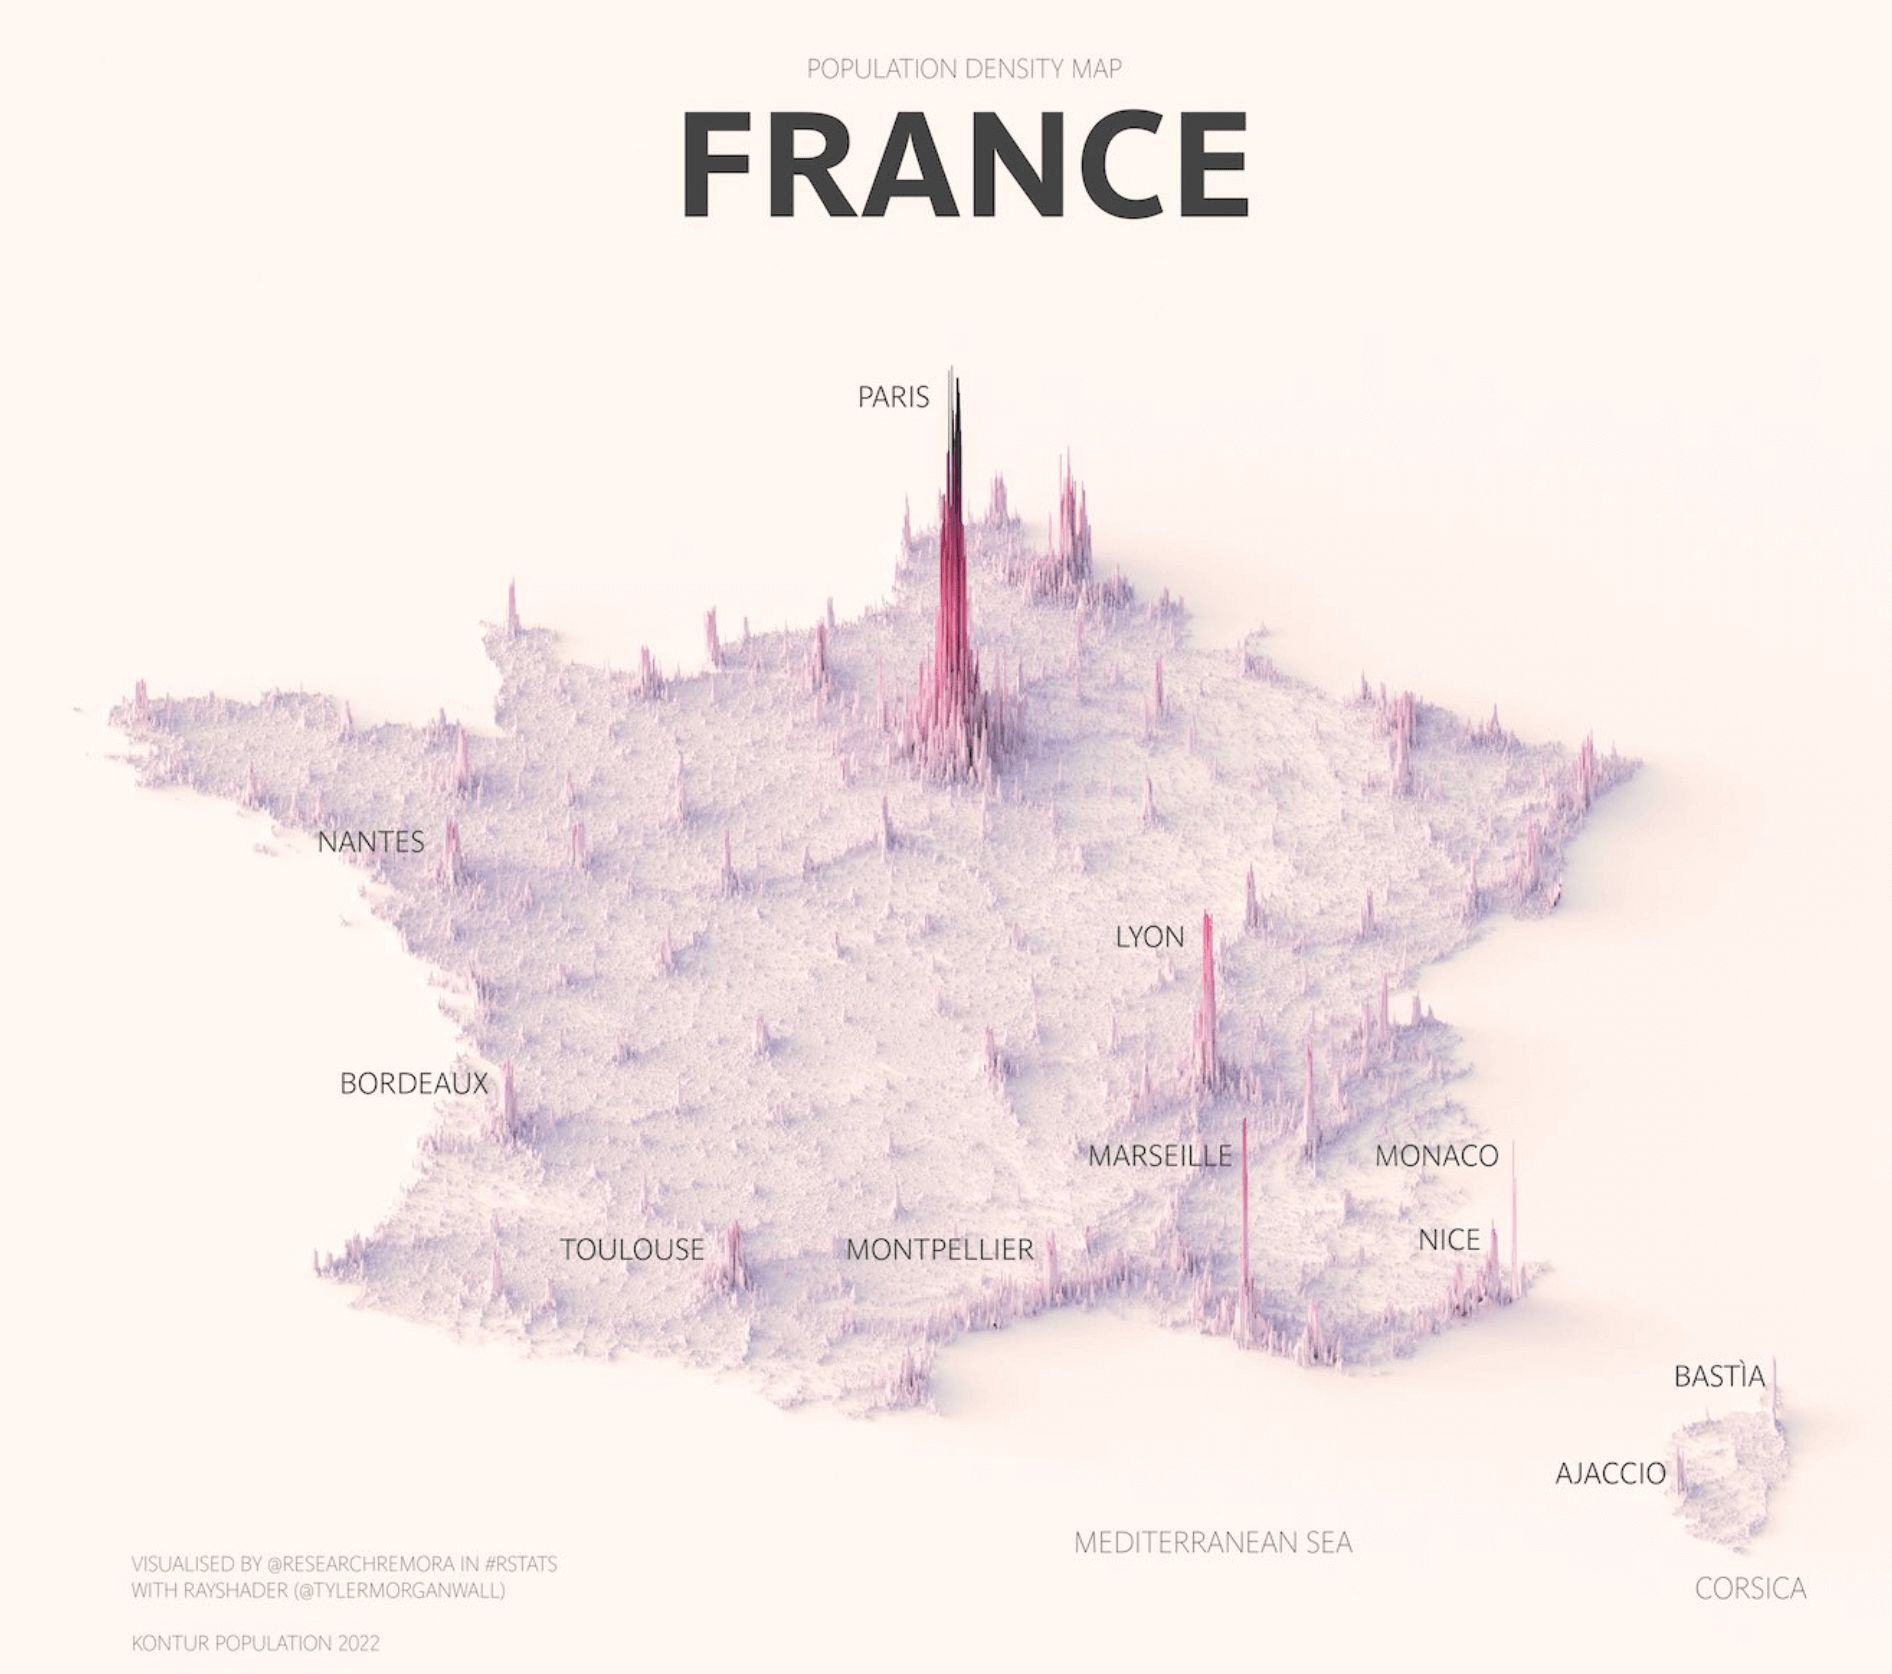
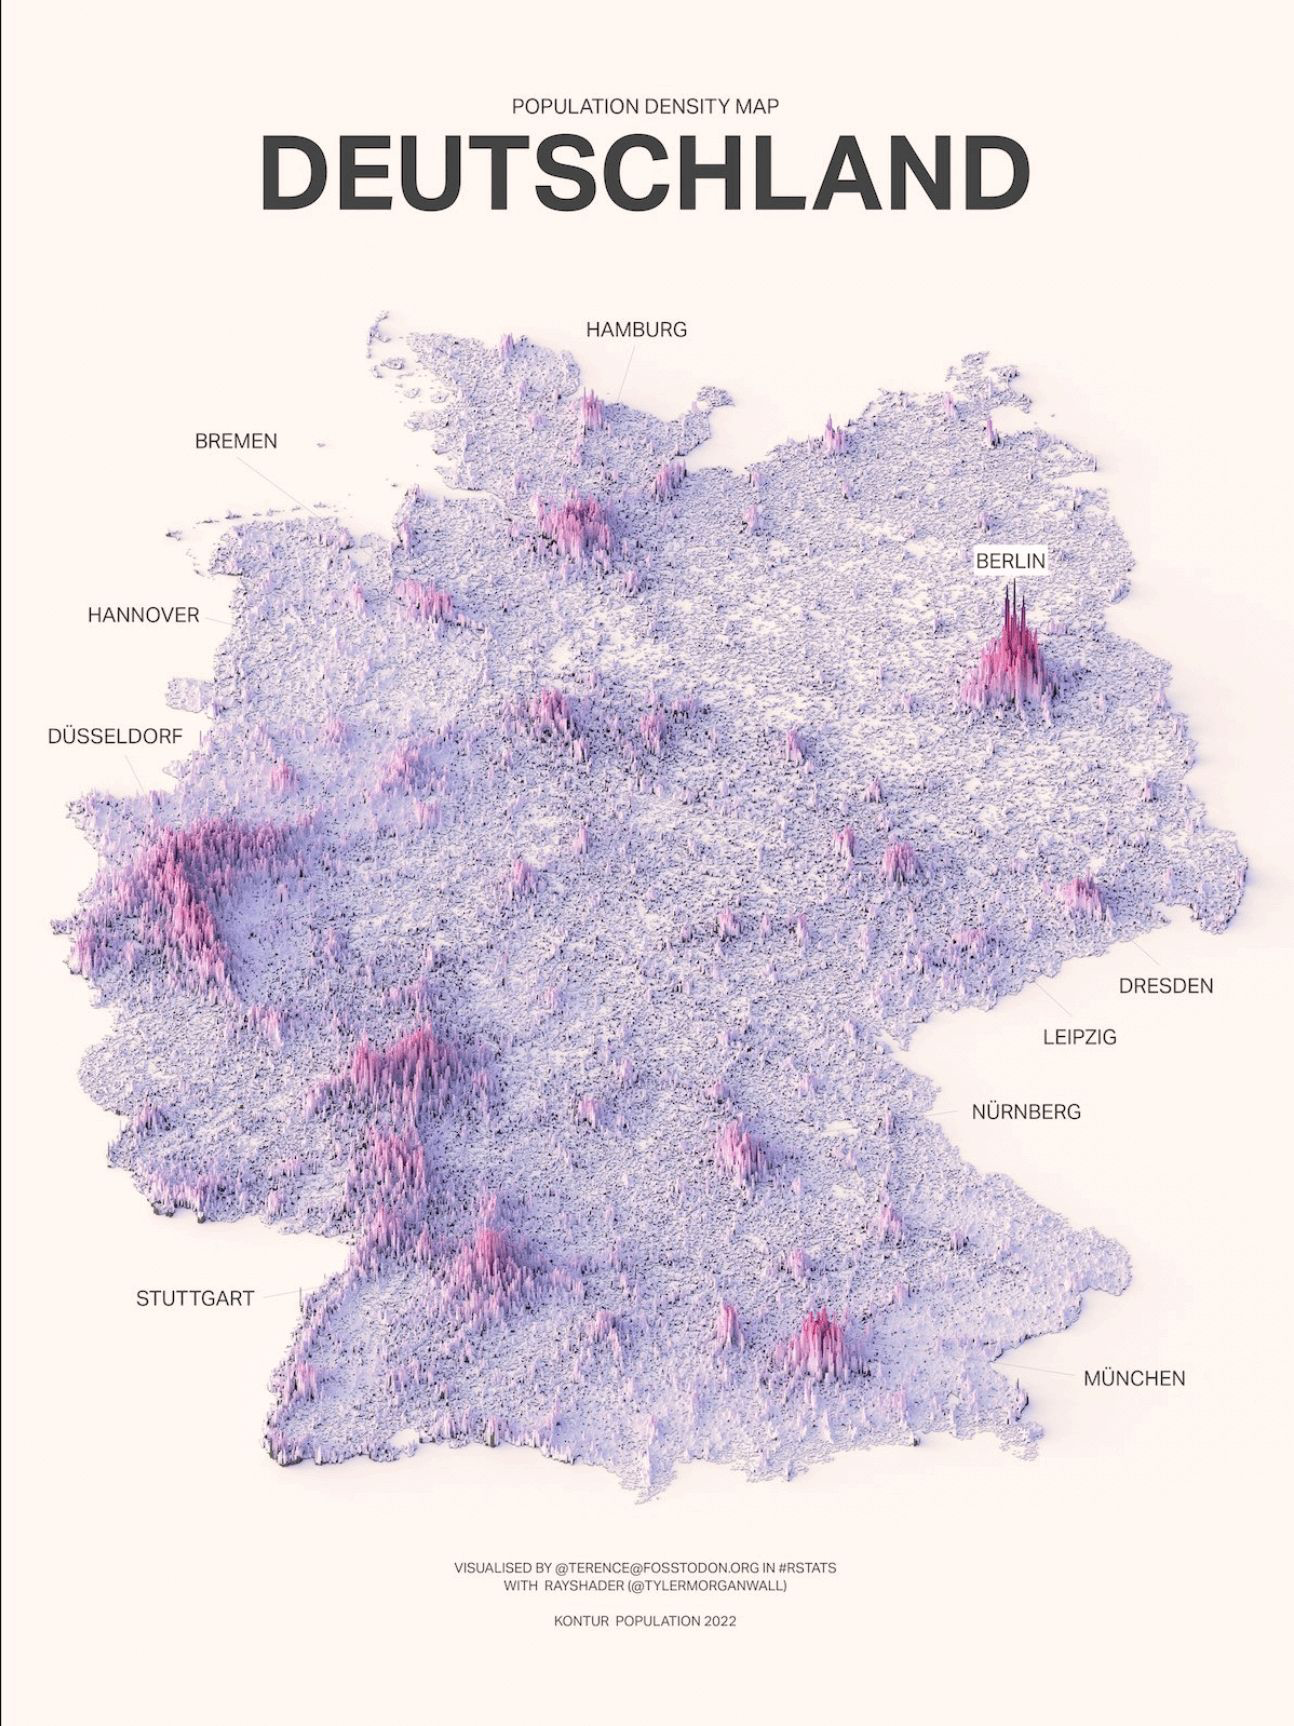
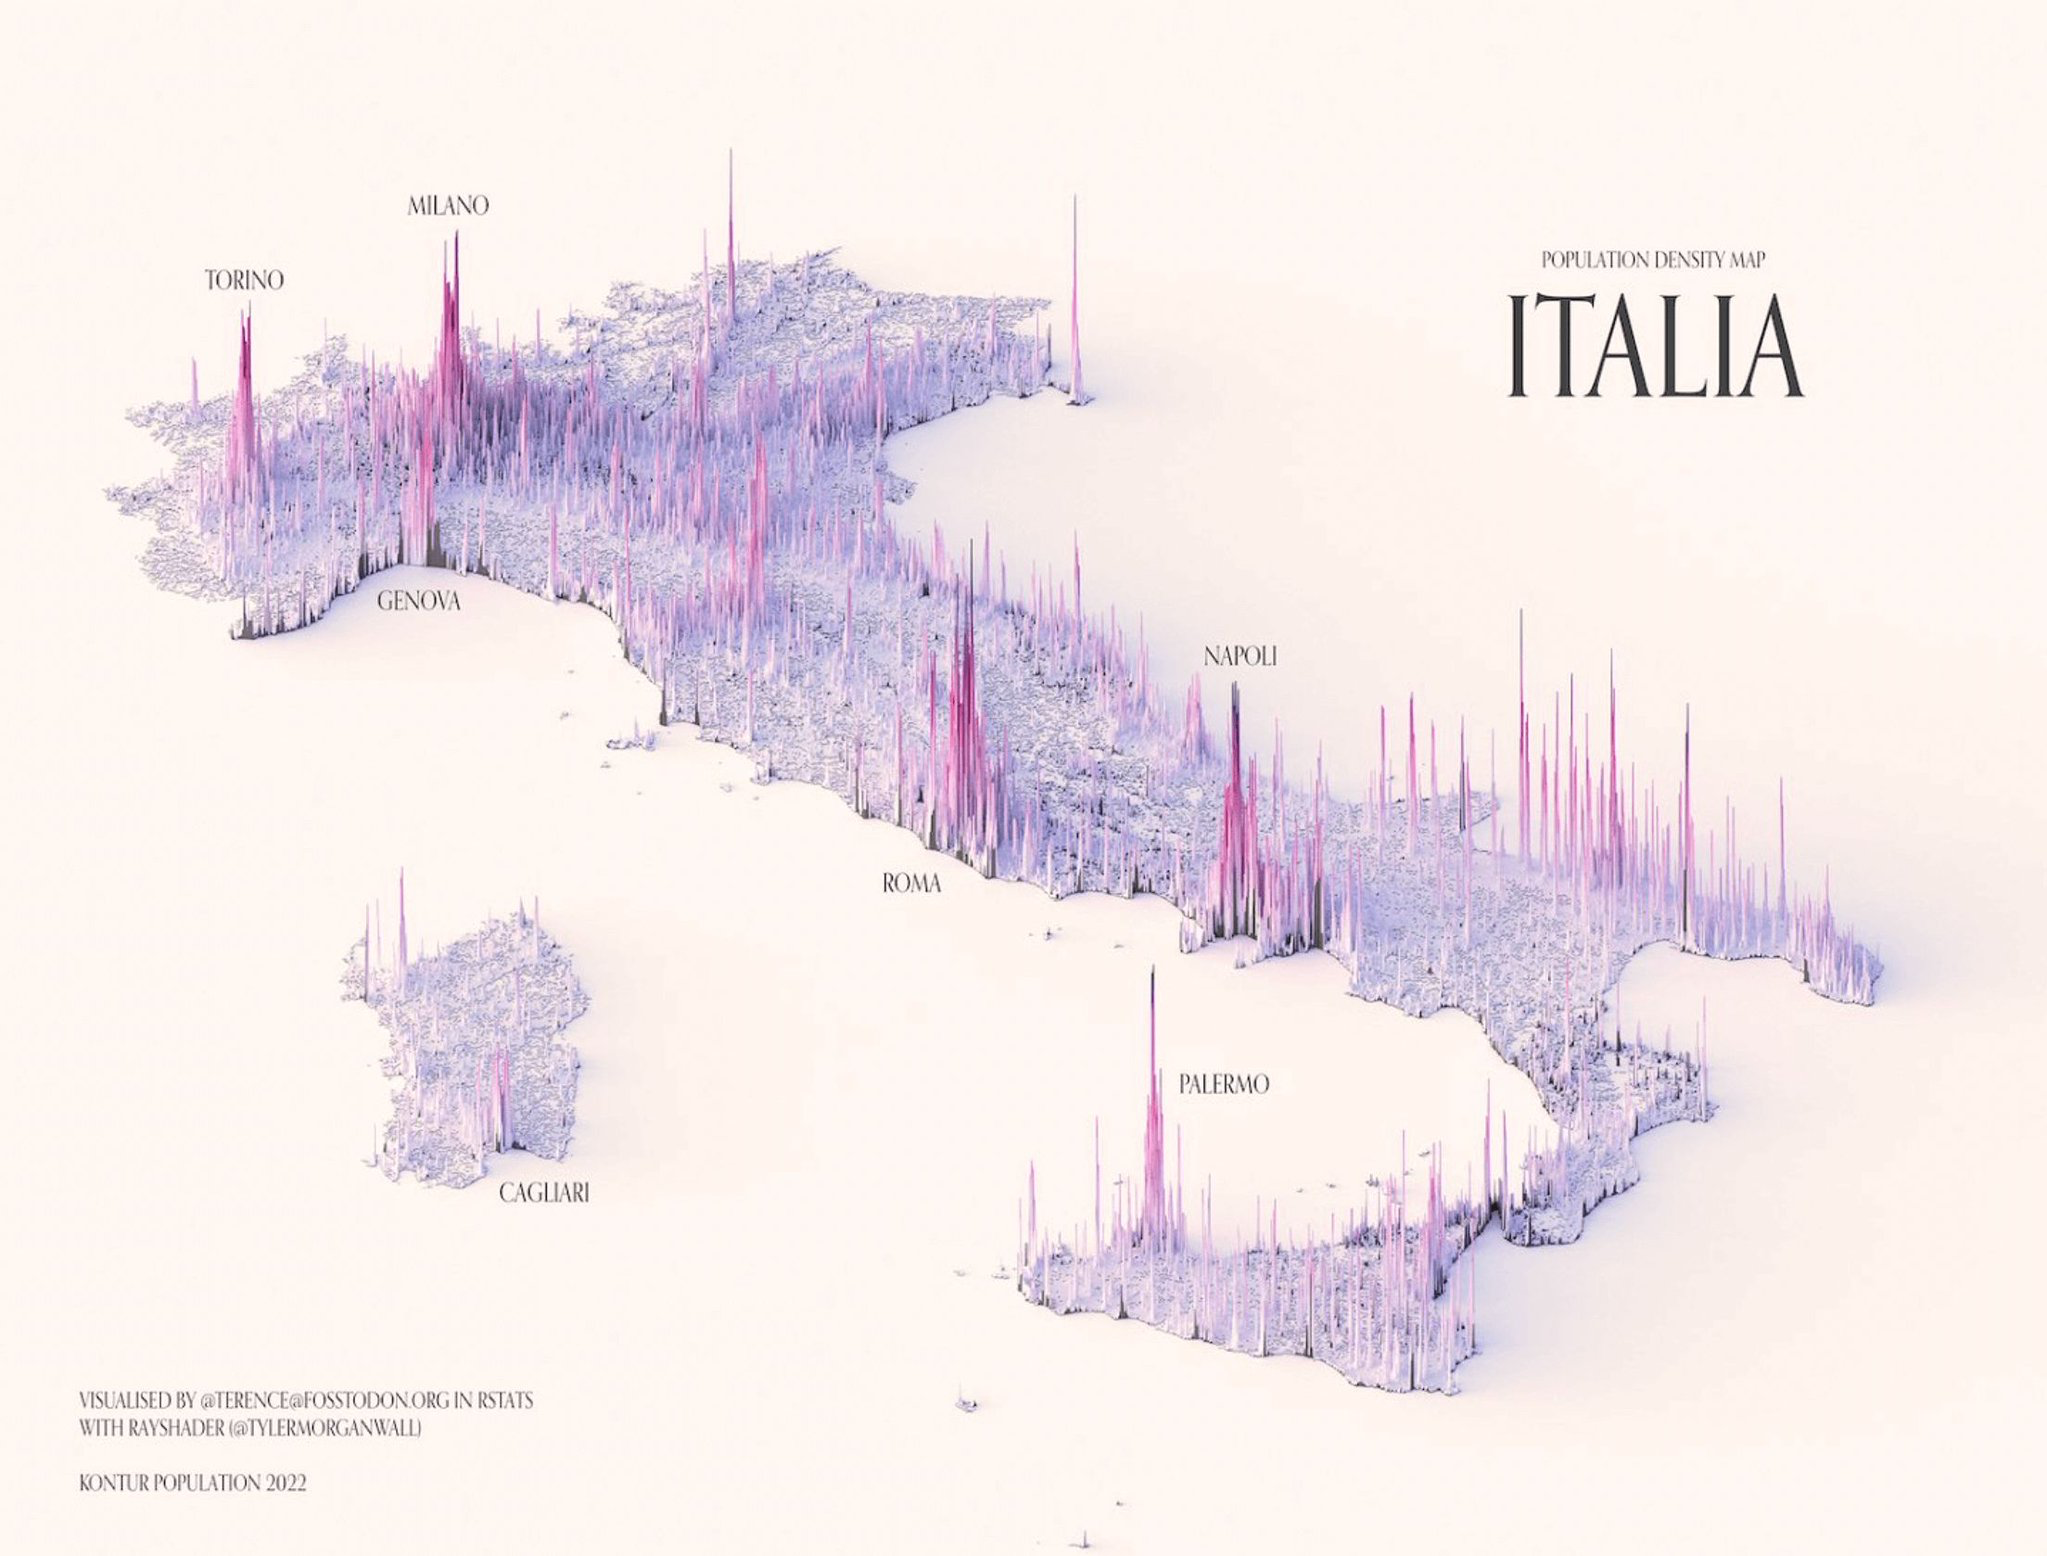
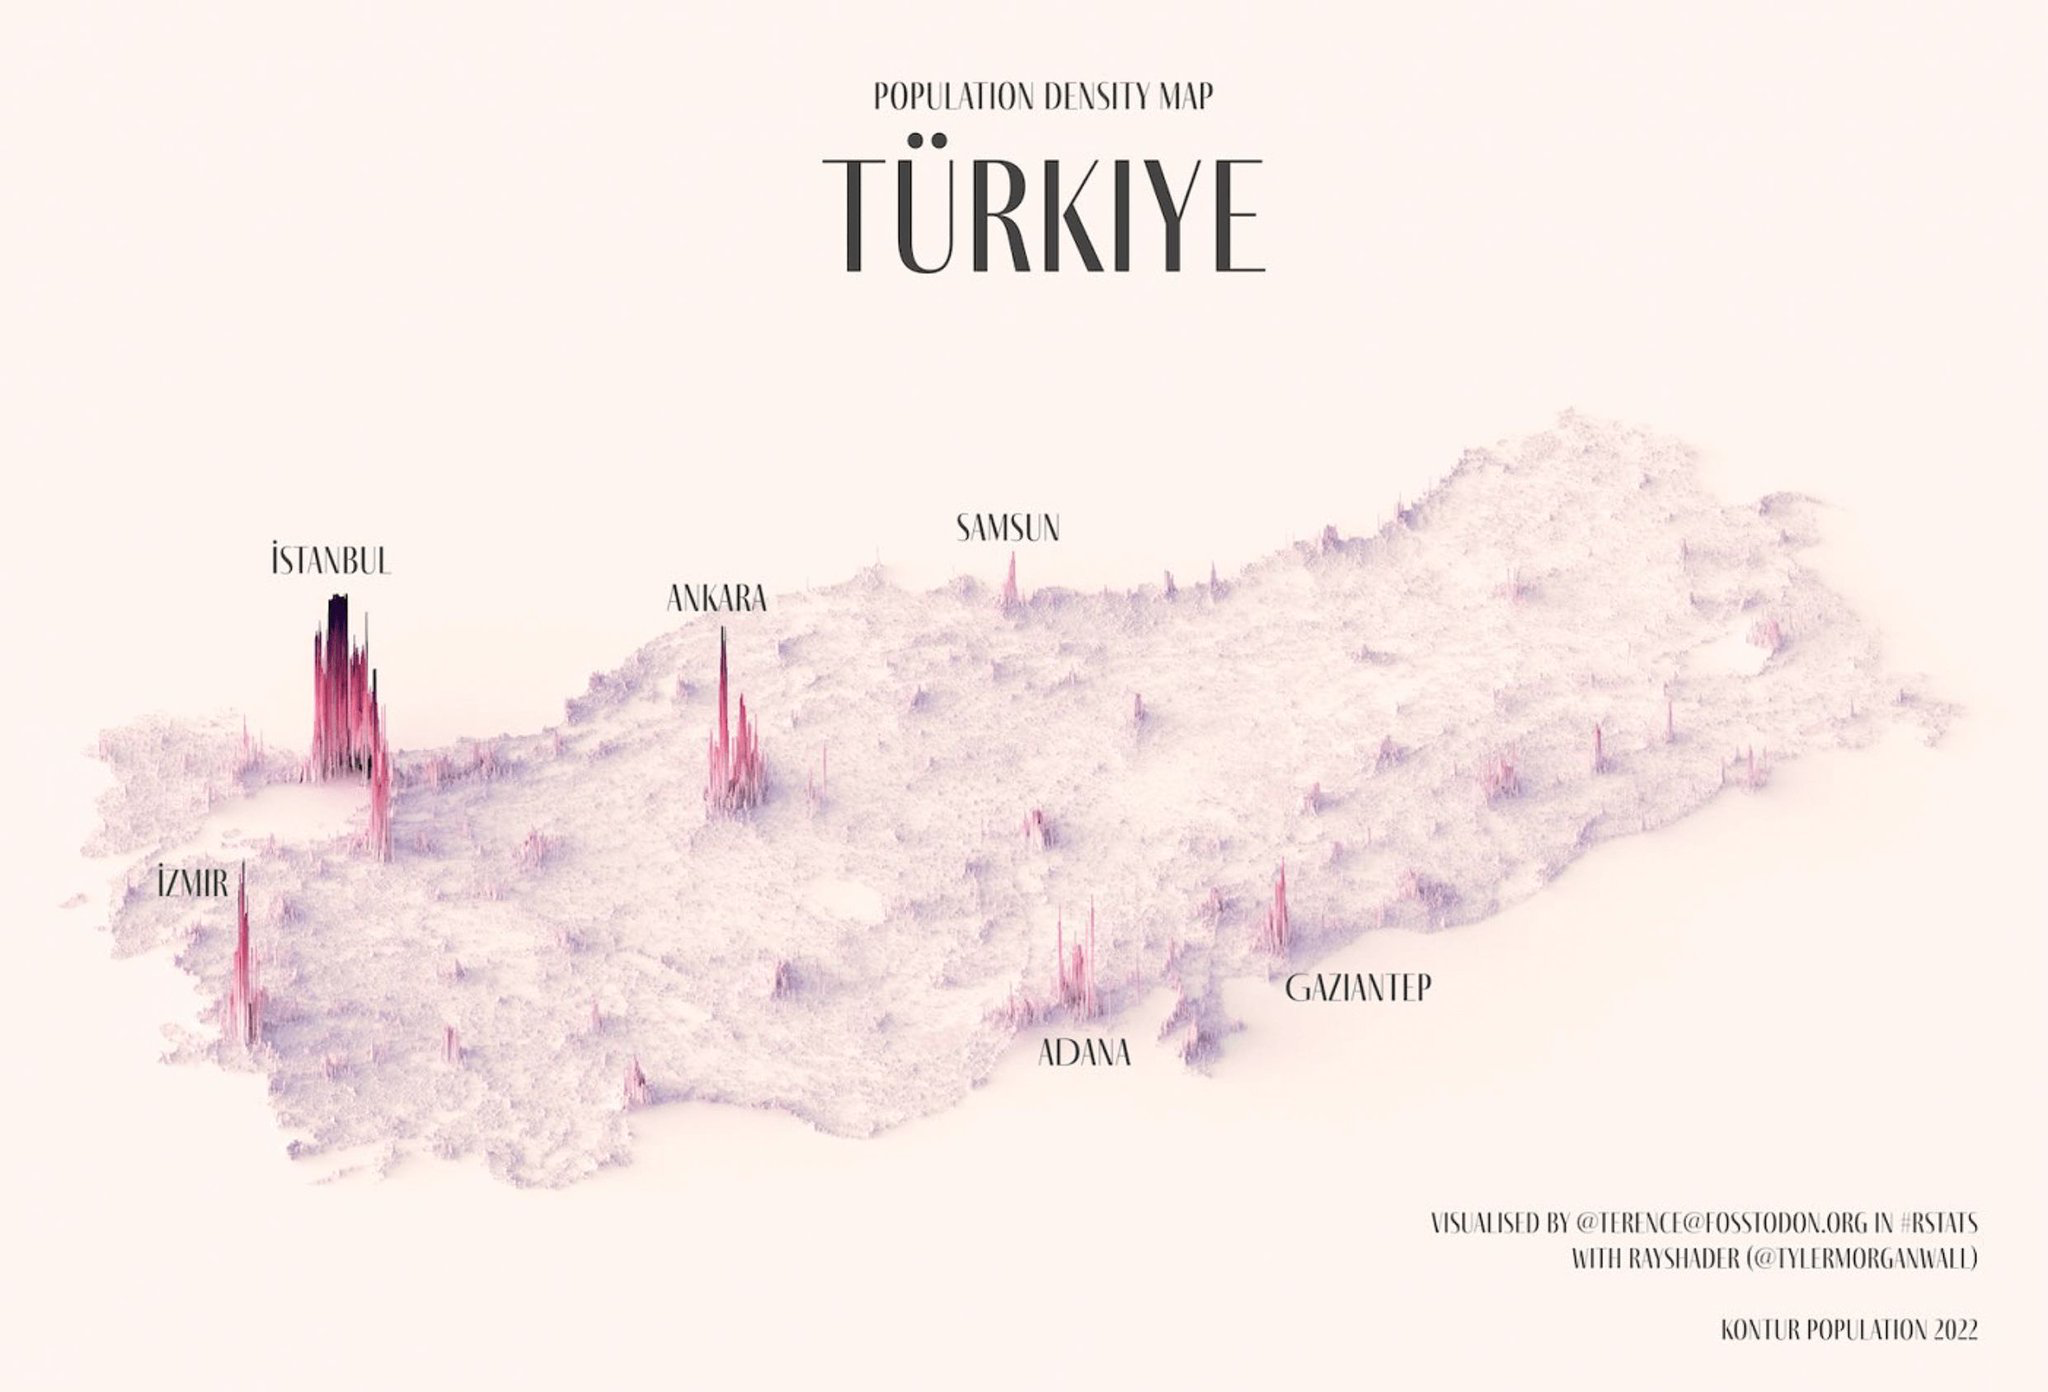
Cartographic visualizations of population distribution, showing where people live through dot density or choropleth techniques. Population density mapping is one of the most fundamental applications of data visualization to geography, dating back to the 19th century. Modern examples use census data at fine geographic resolution (census tracts or blocks) to show how population clusters along coastlines, river valleys, and transportation corridors, while vast interior regions remain sparsely inhabited. Techniques range from simple choropleth shading by county to dot-density maps where each dot represents a fixed number of people, revealing patterns invisible in tabular data.