Description
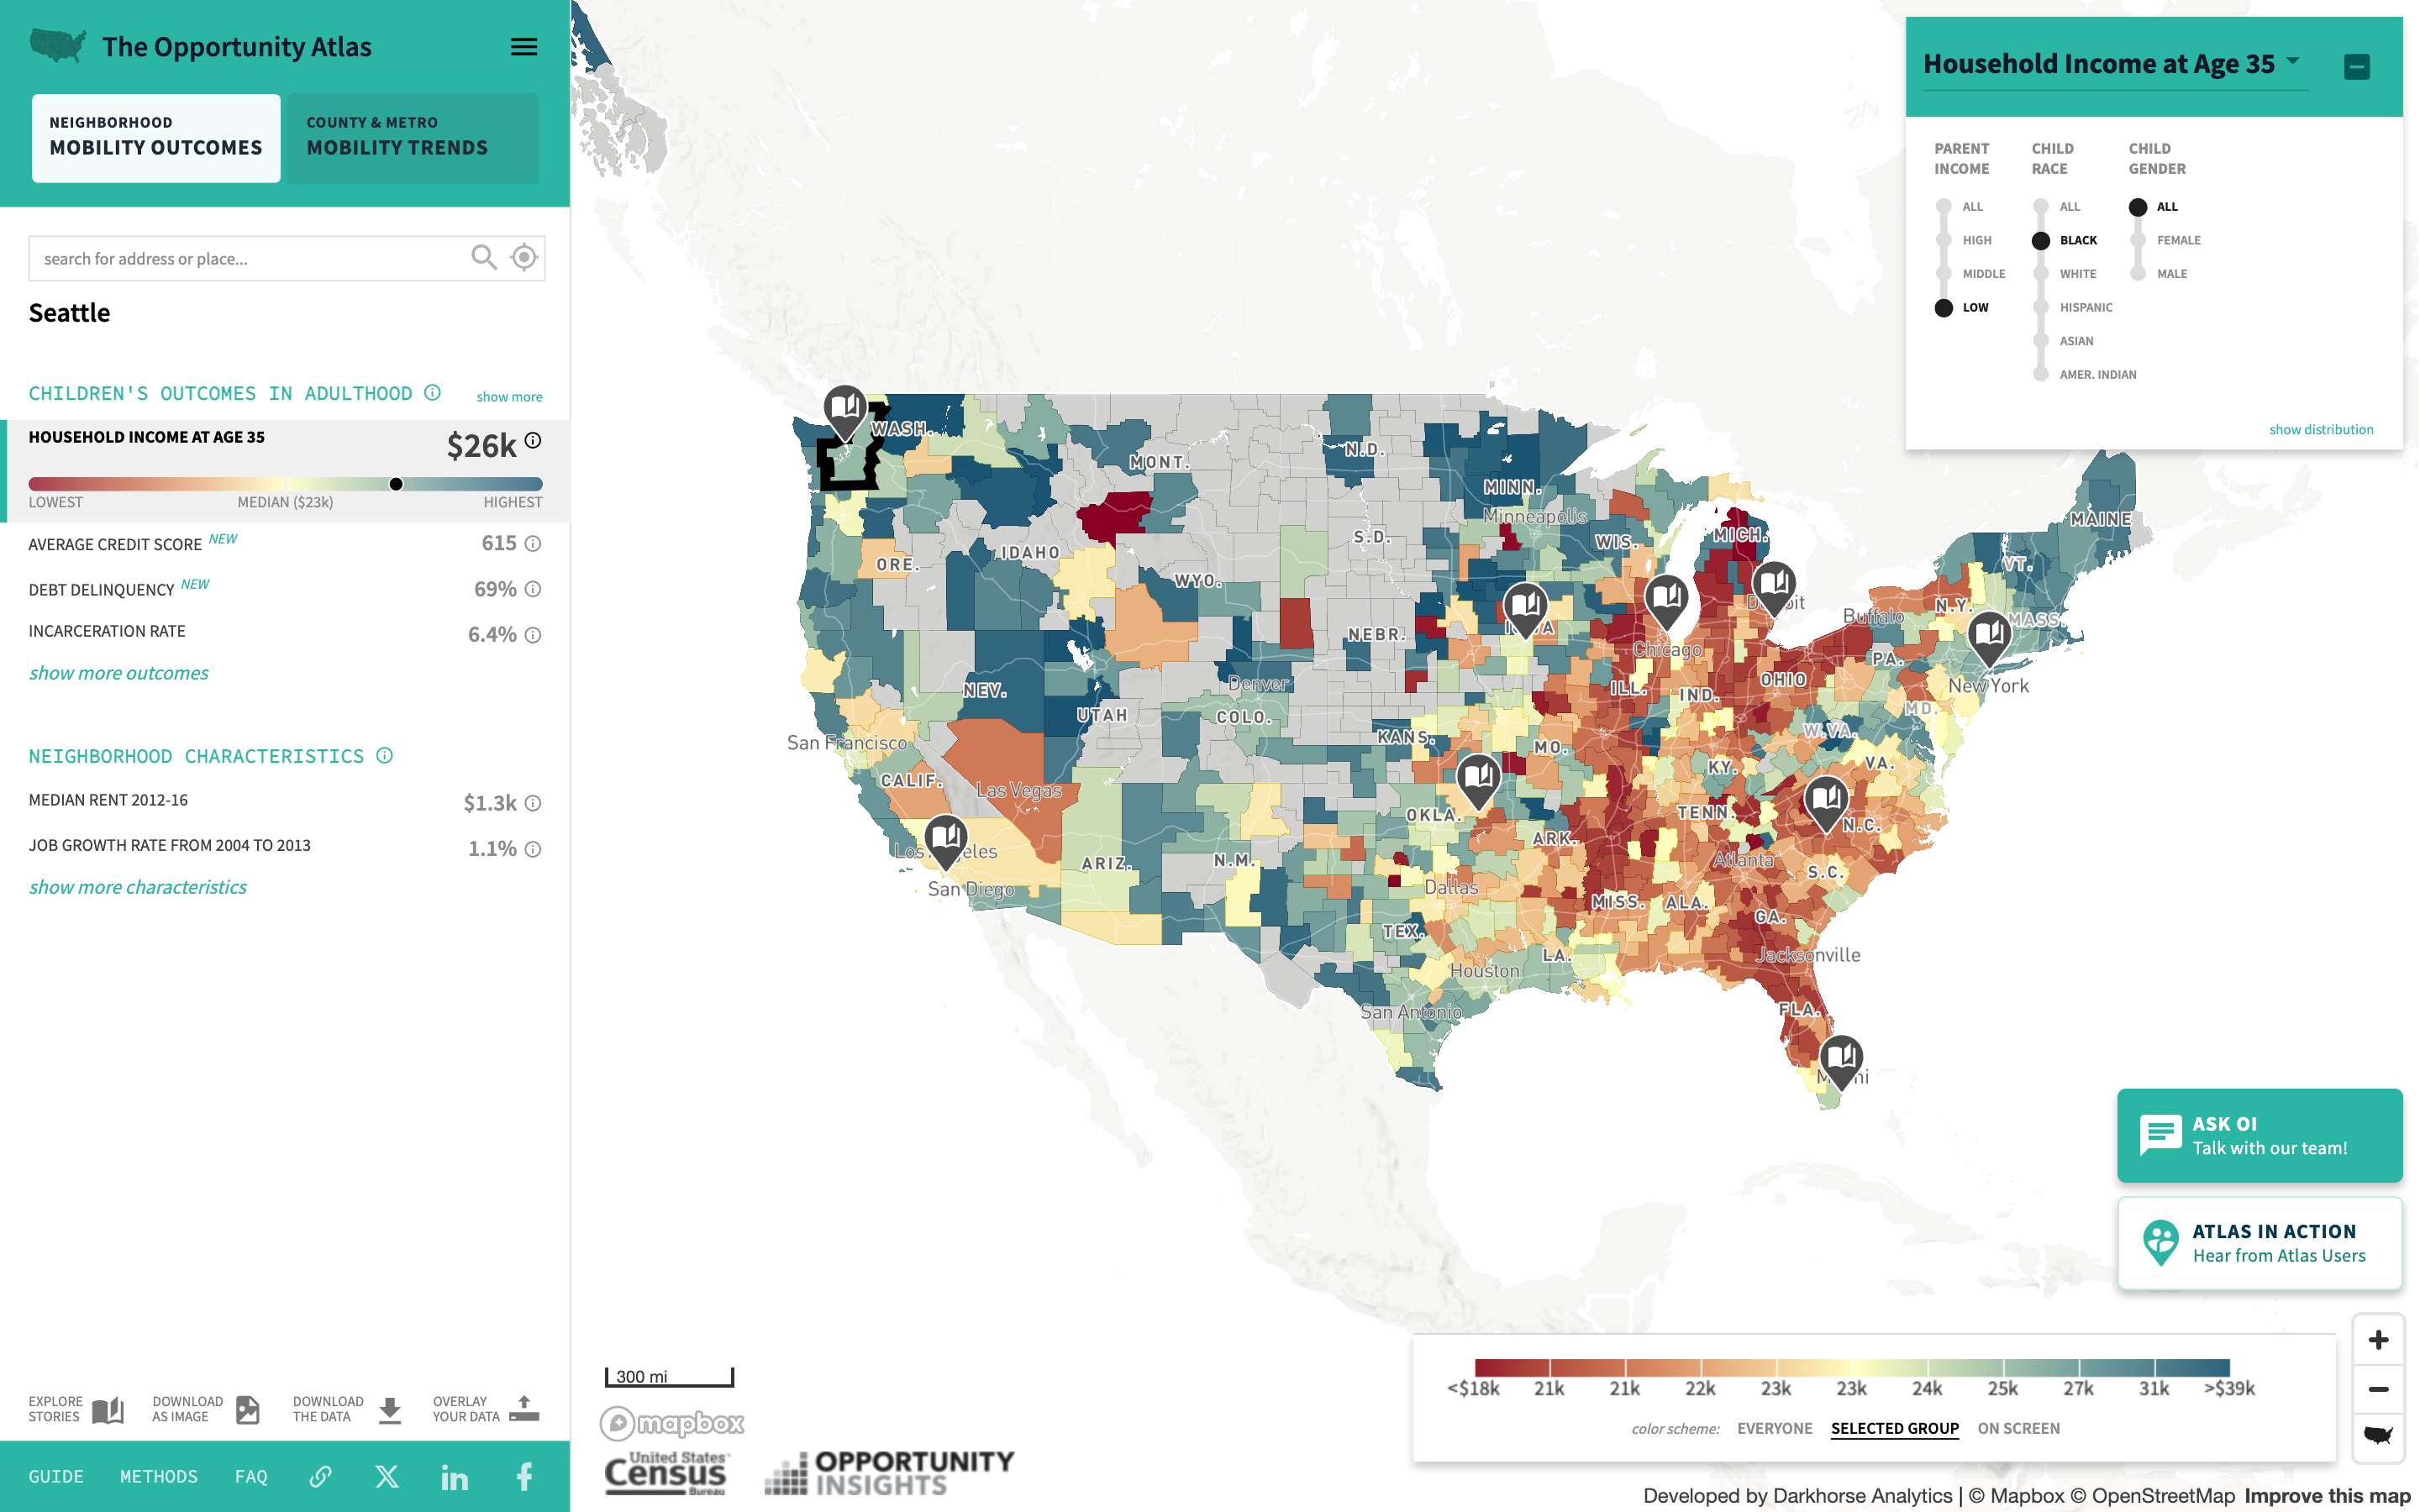
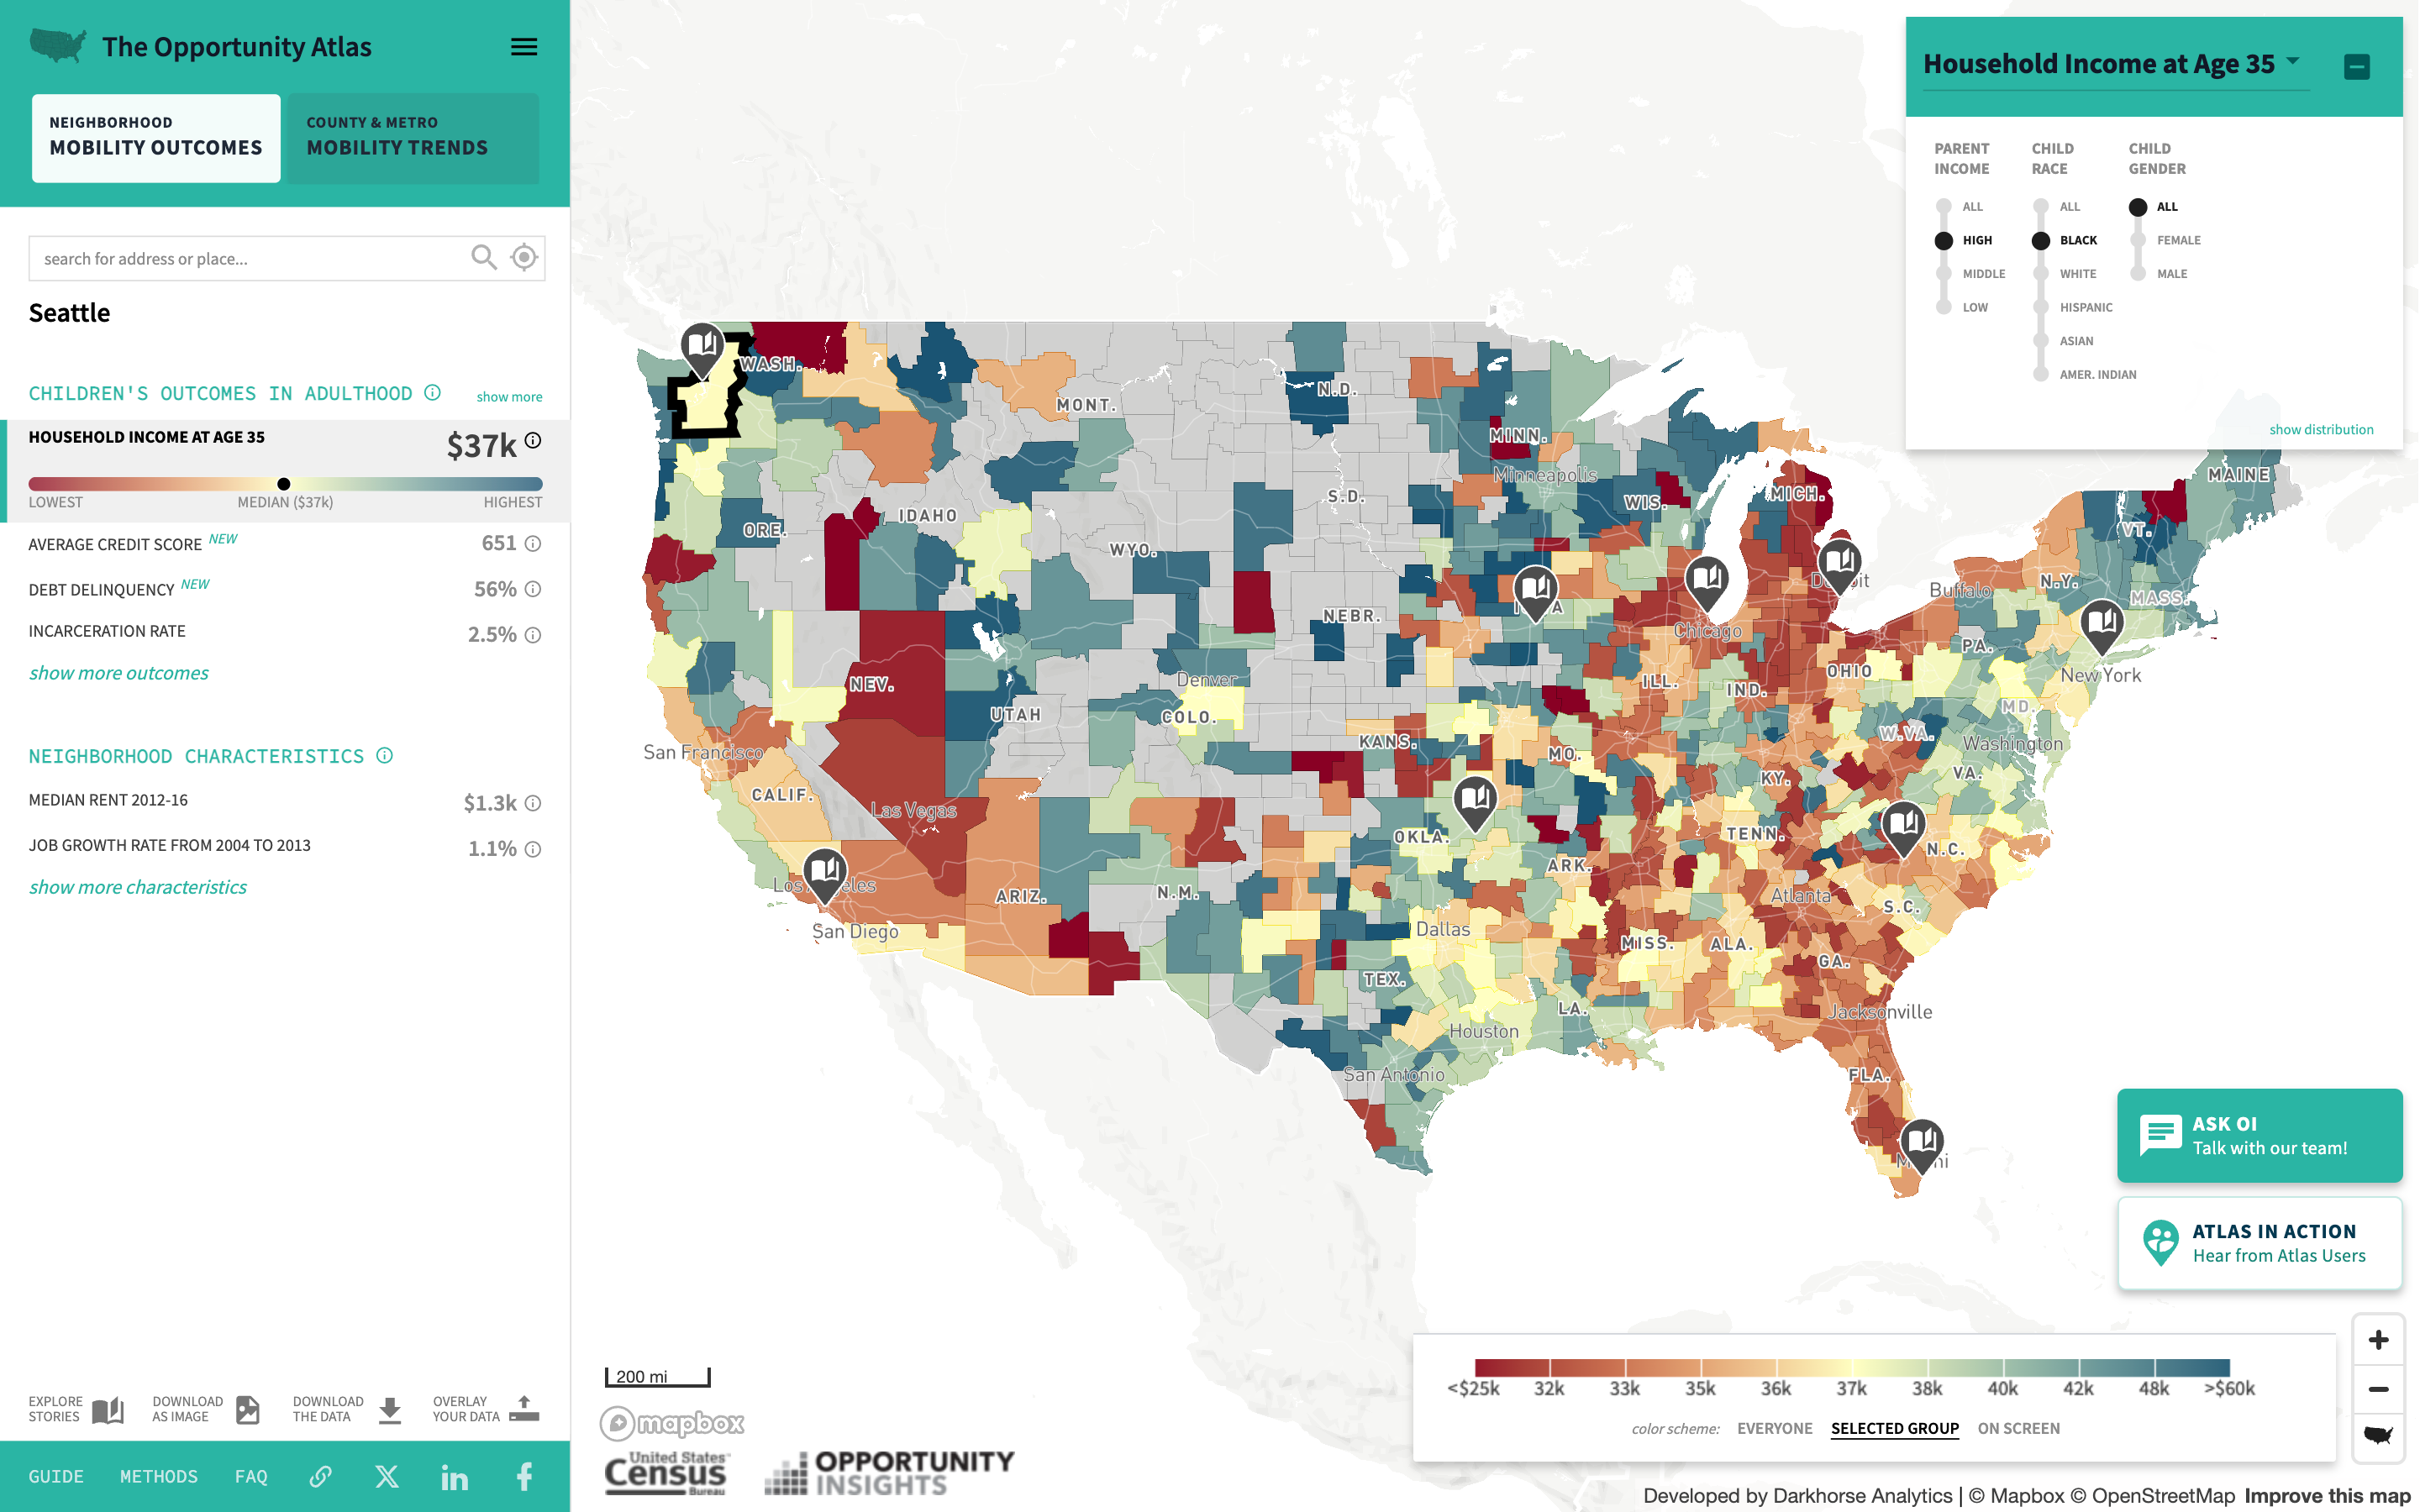
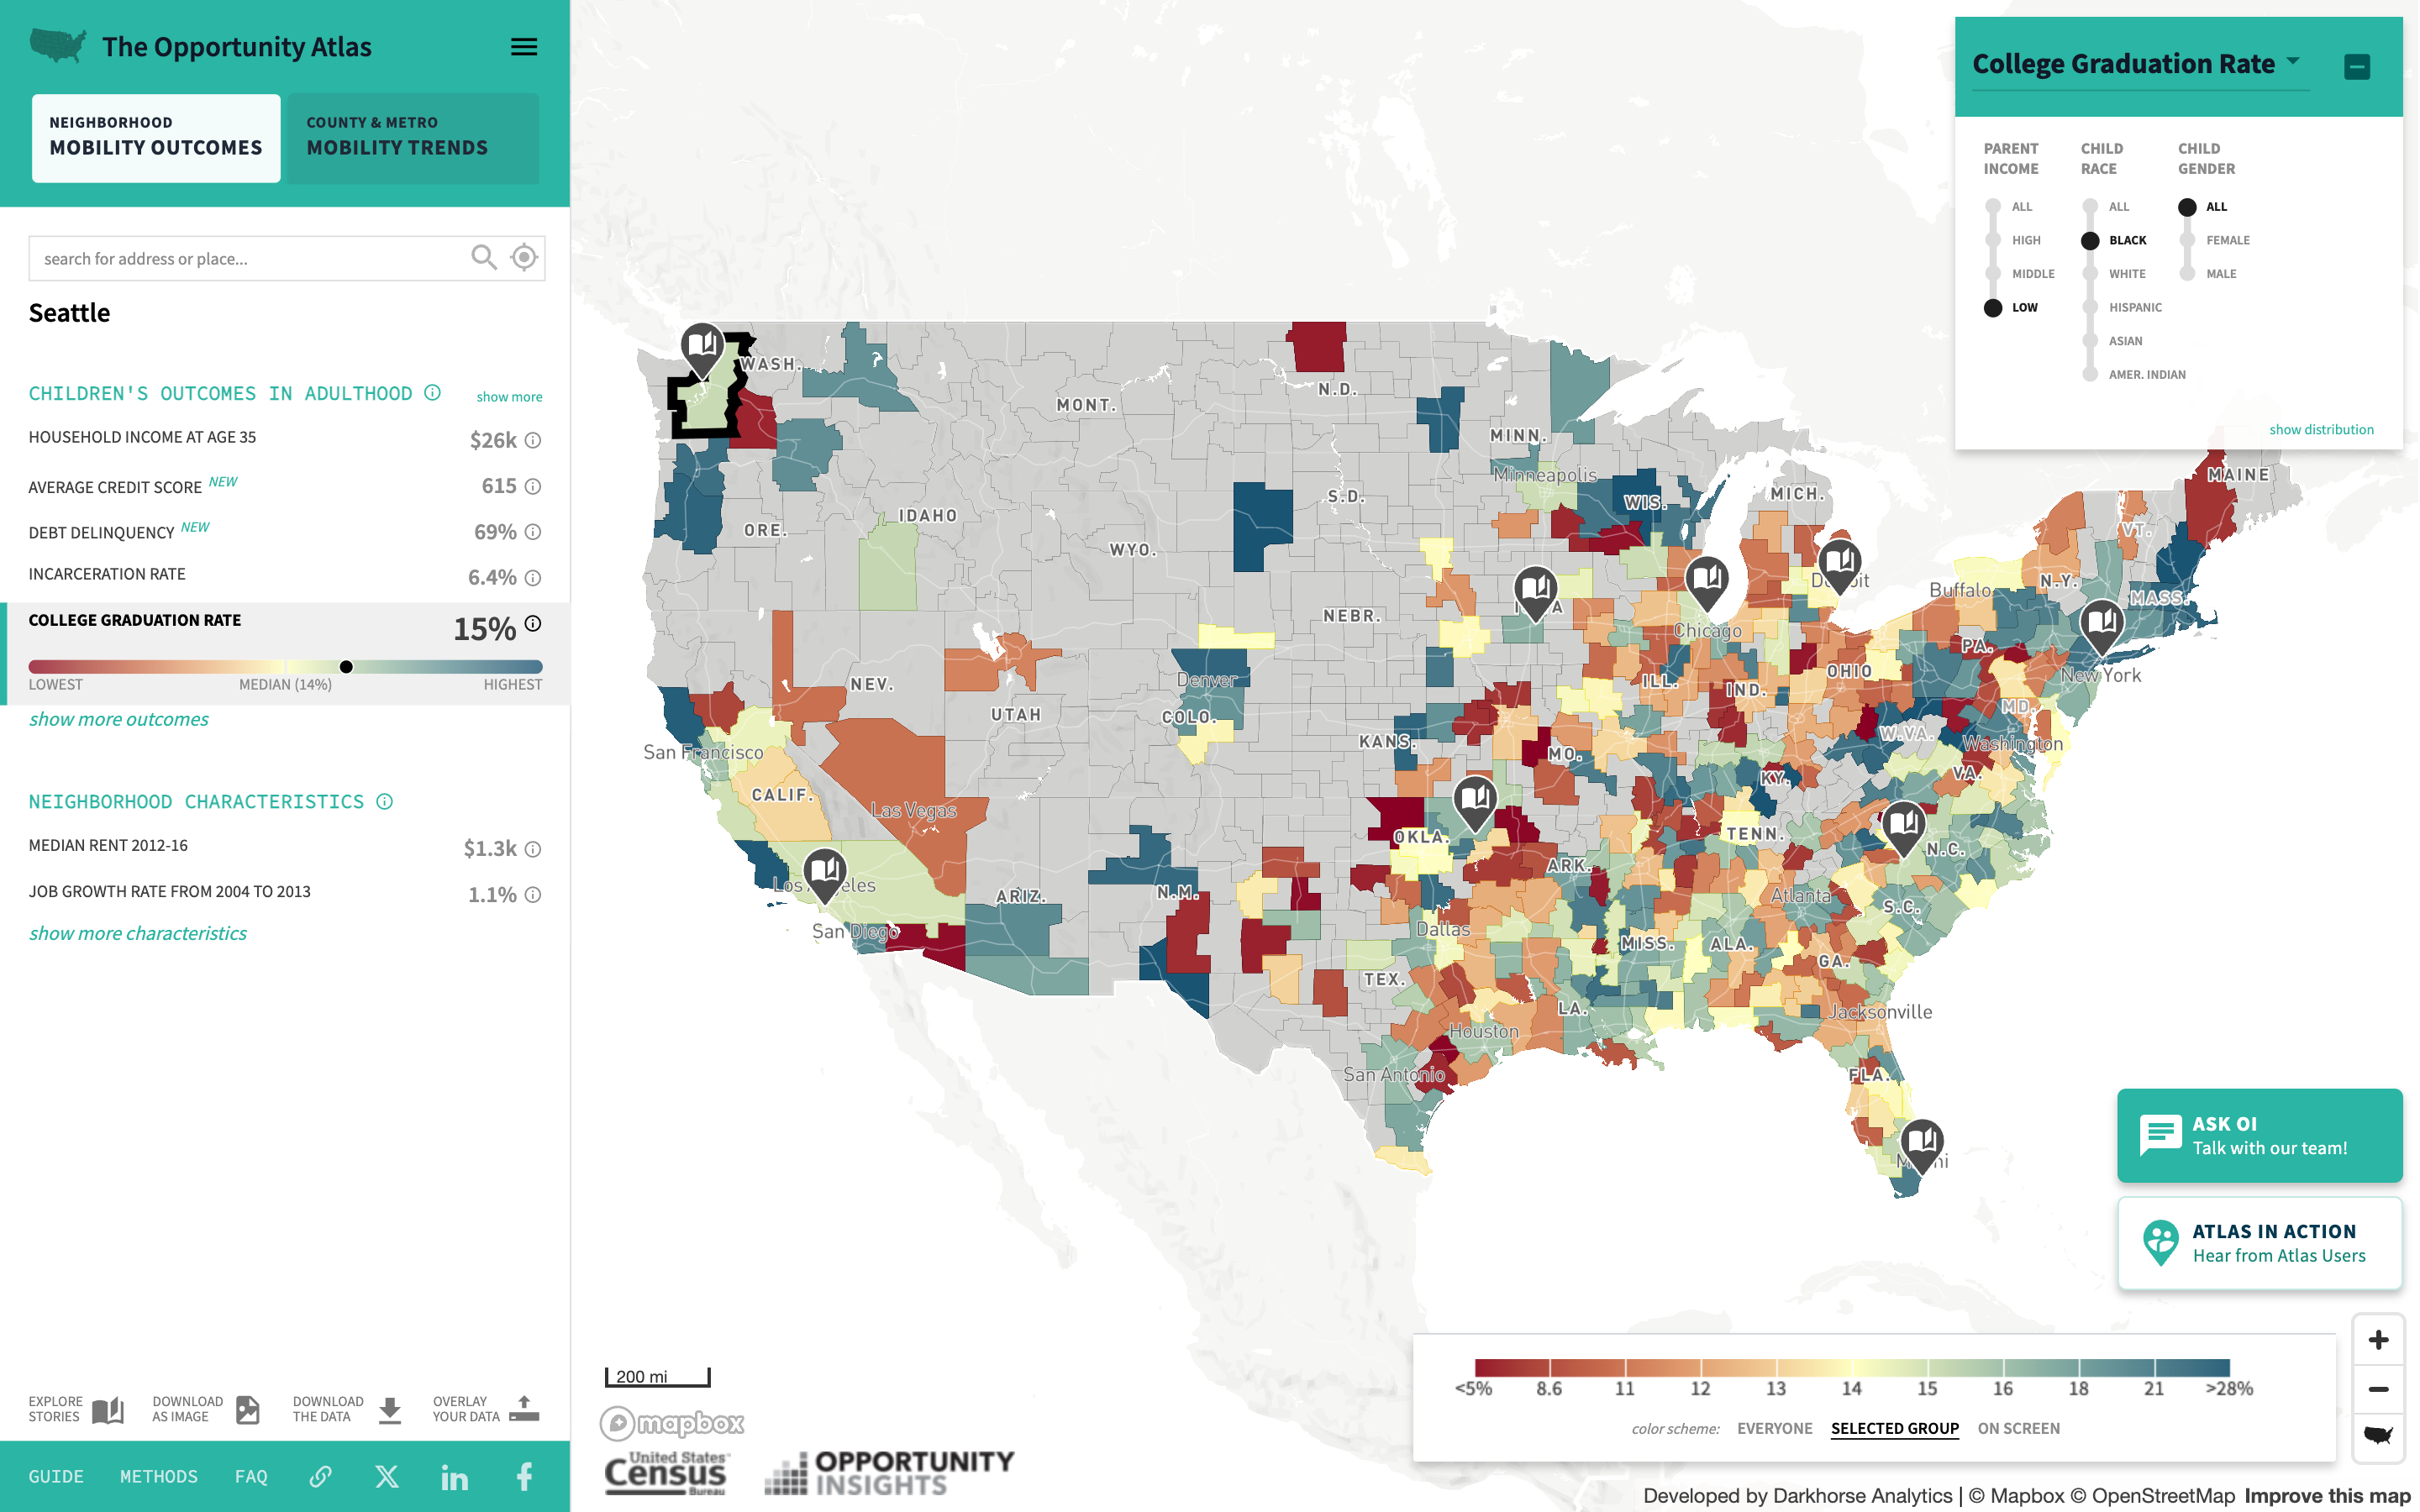
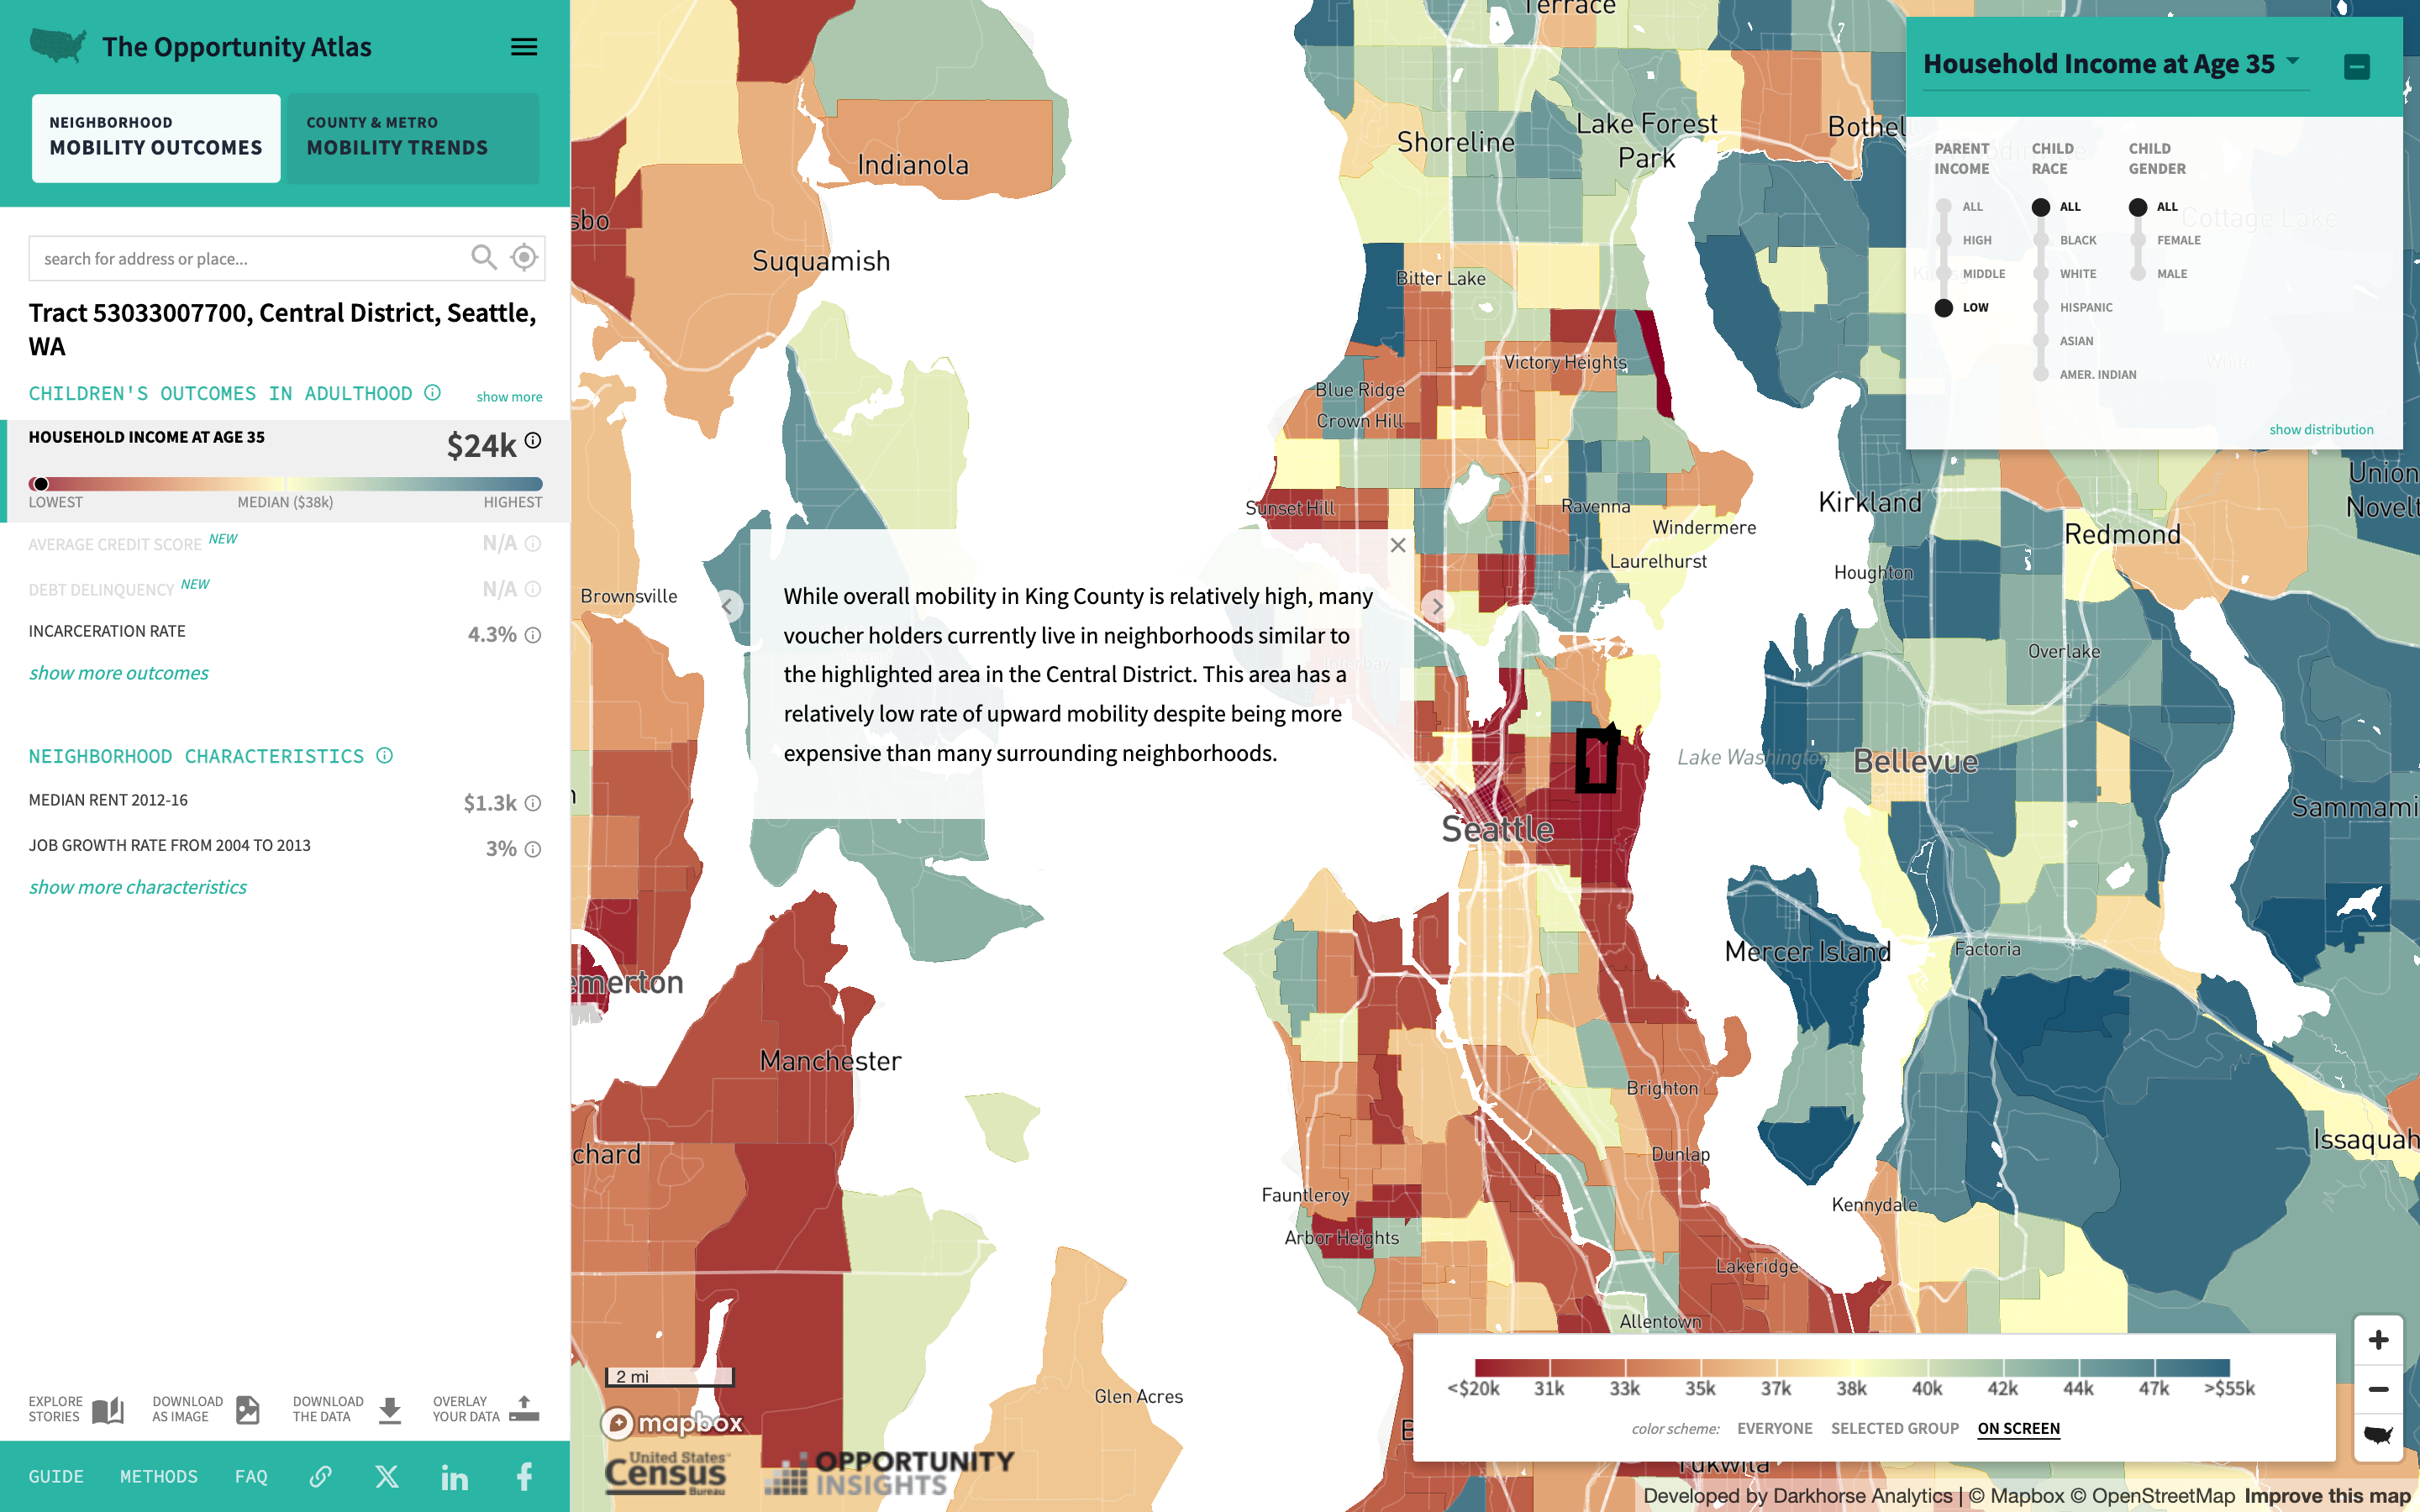
The Opportunity Atlas is an interactive data visualization platform that maps children's outcomes in adulthood back to the neighborhoods where they grew up. It provides hyperlocal data on economic mobility across the United States at the census tract level.
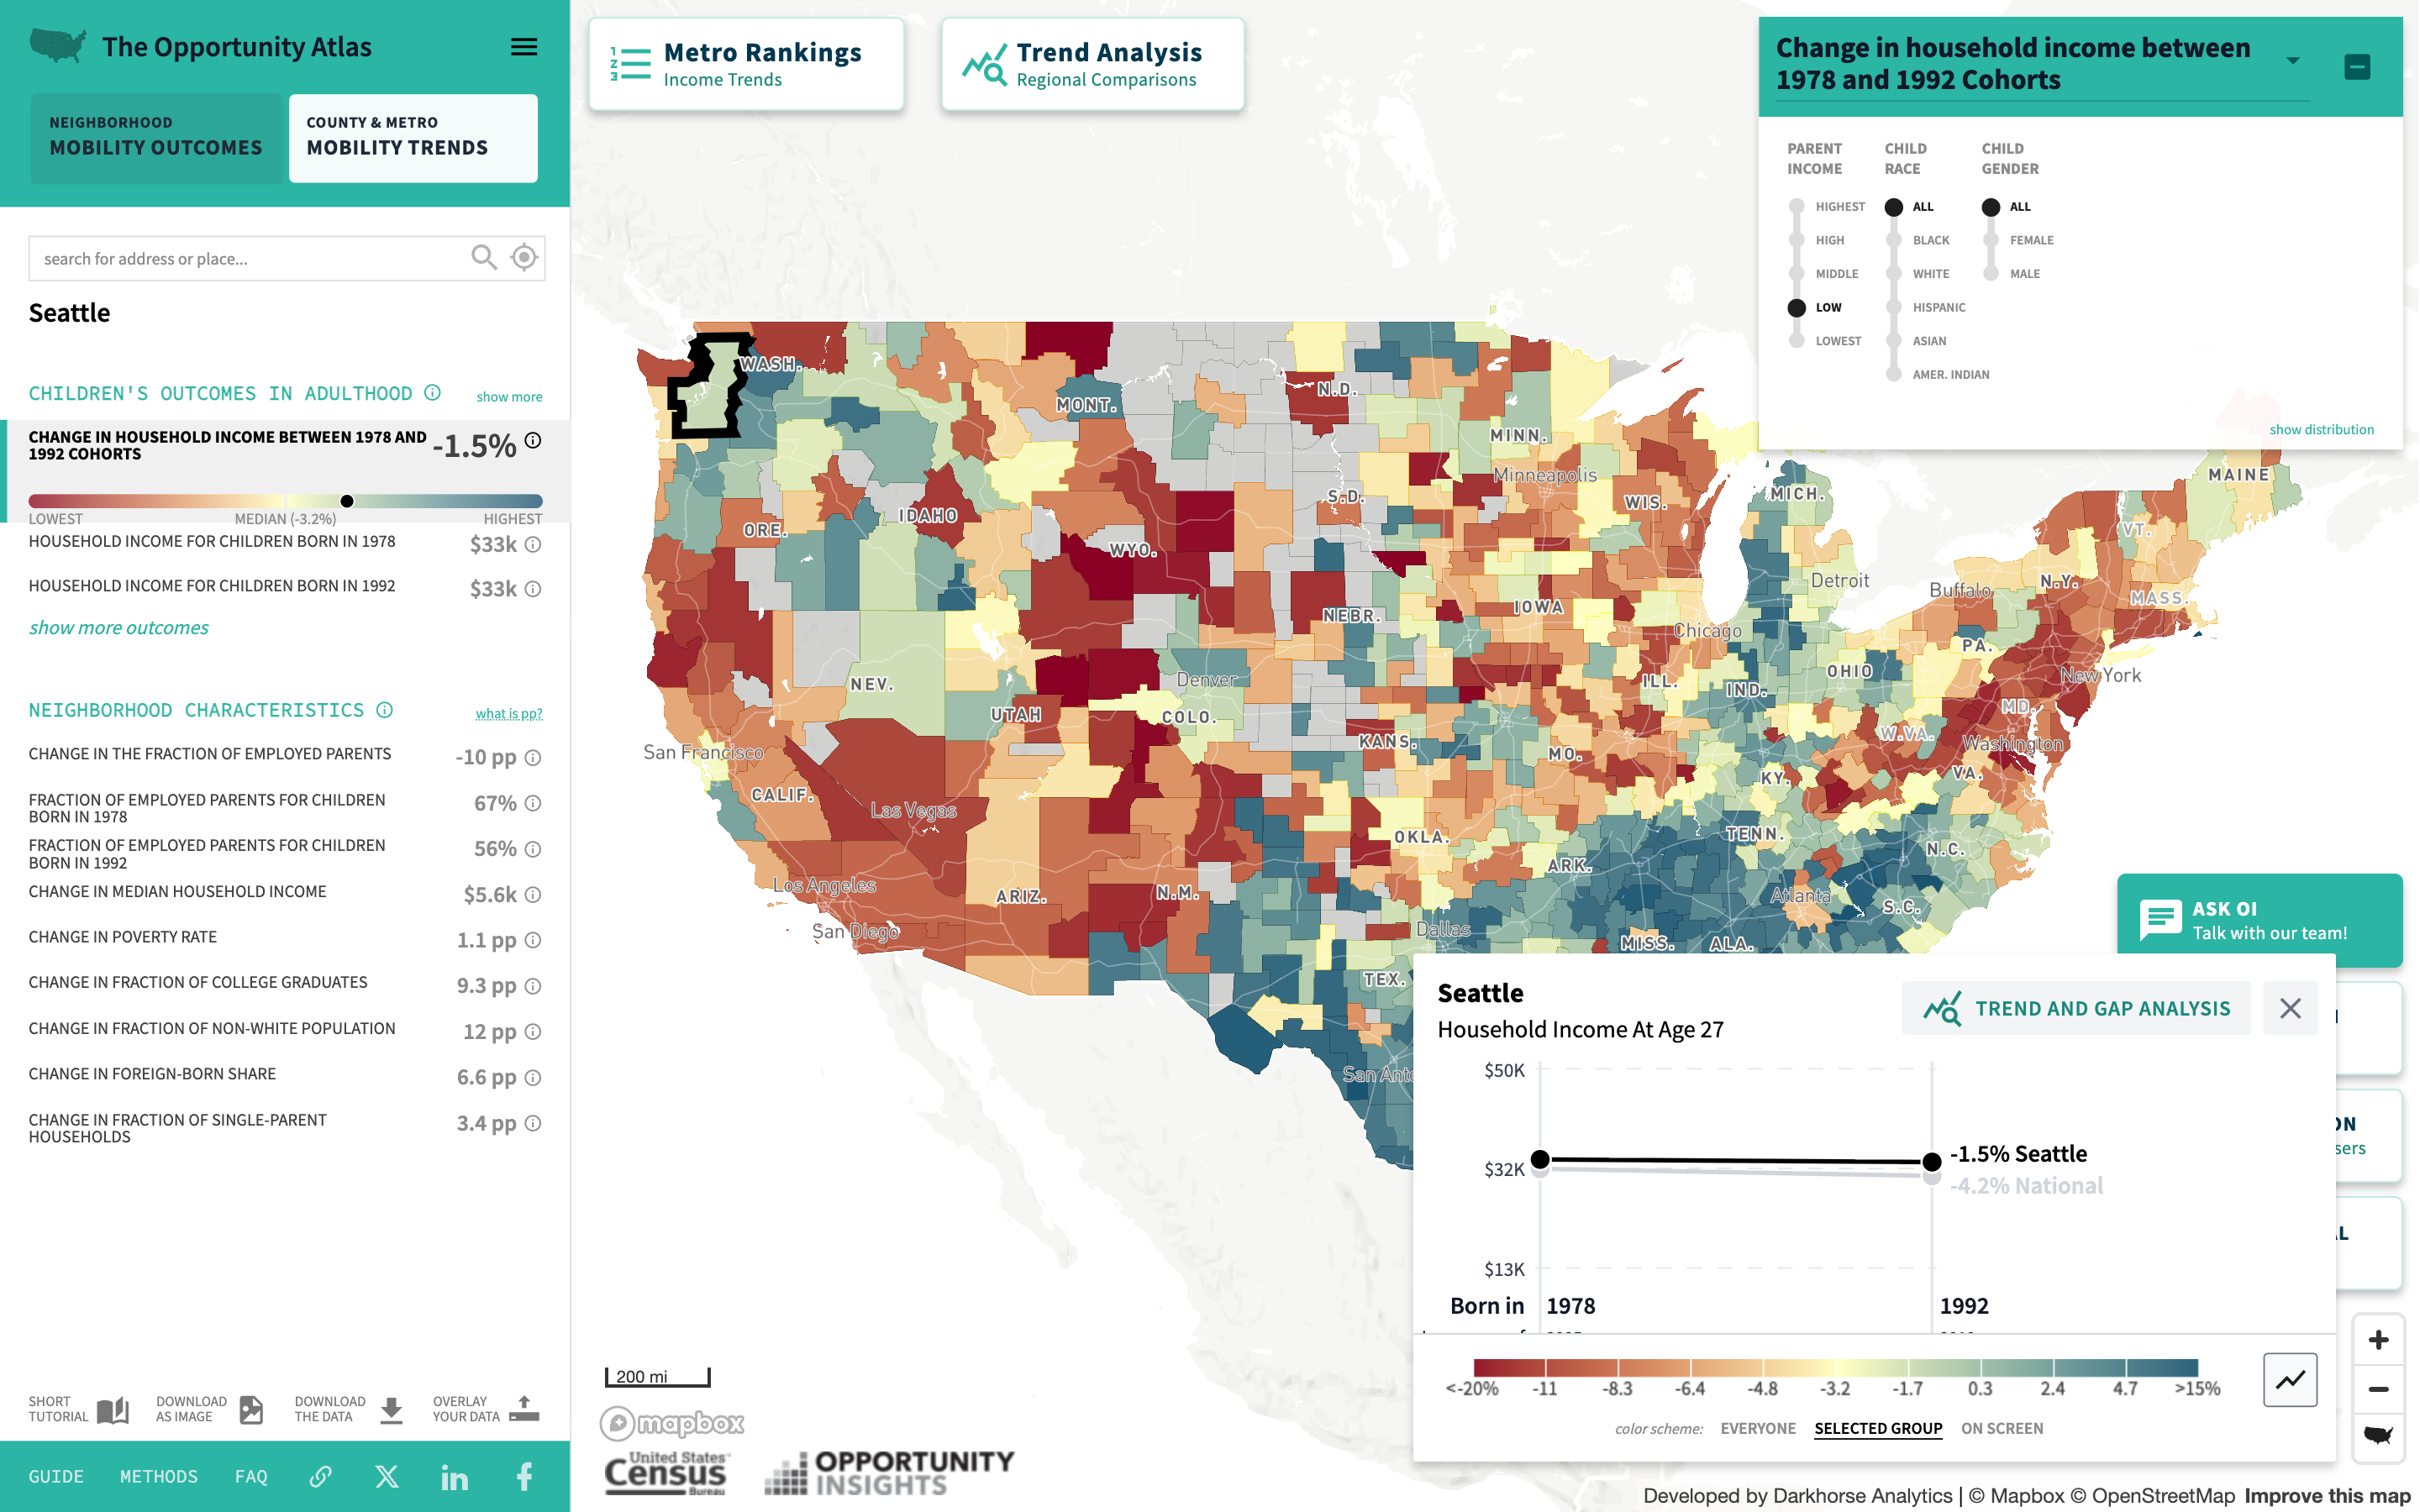
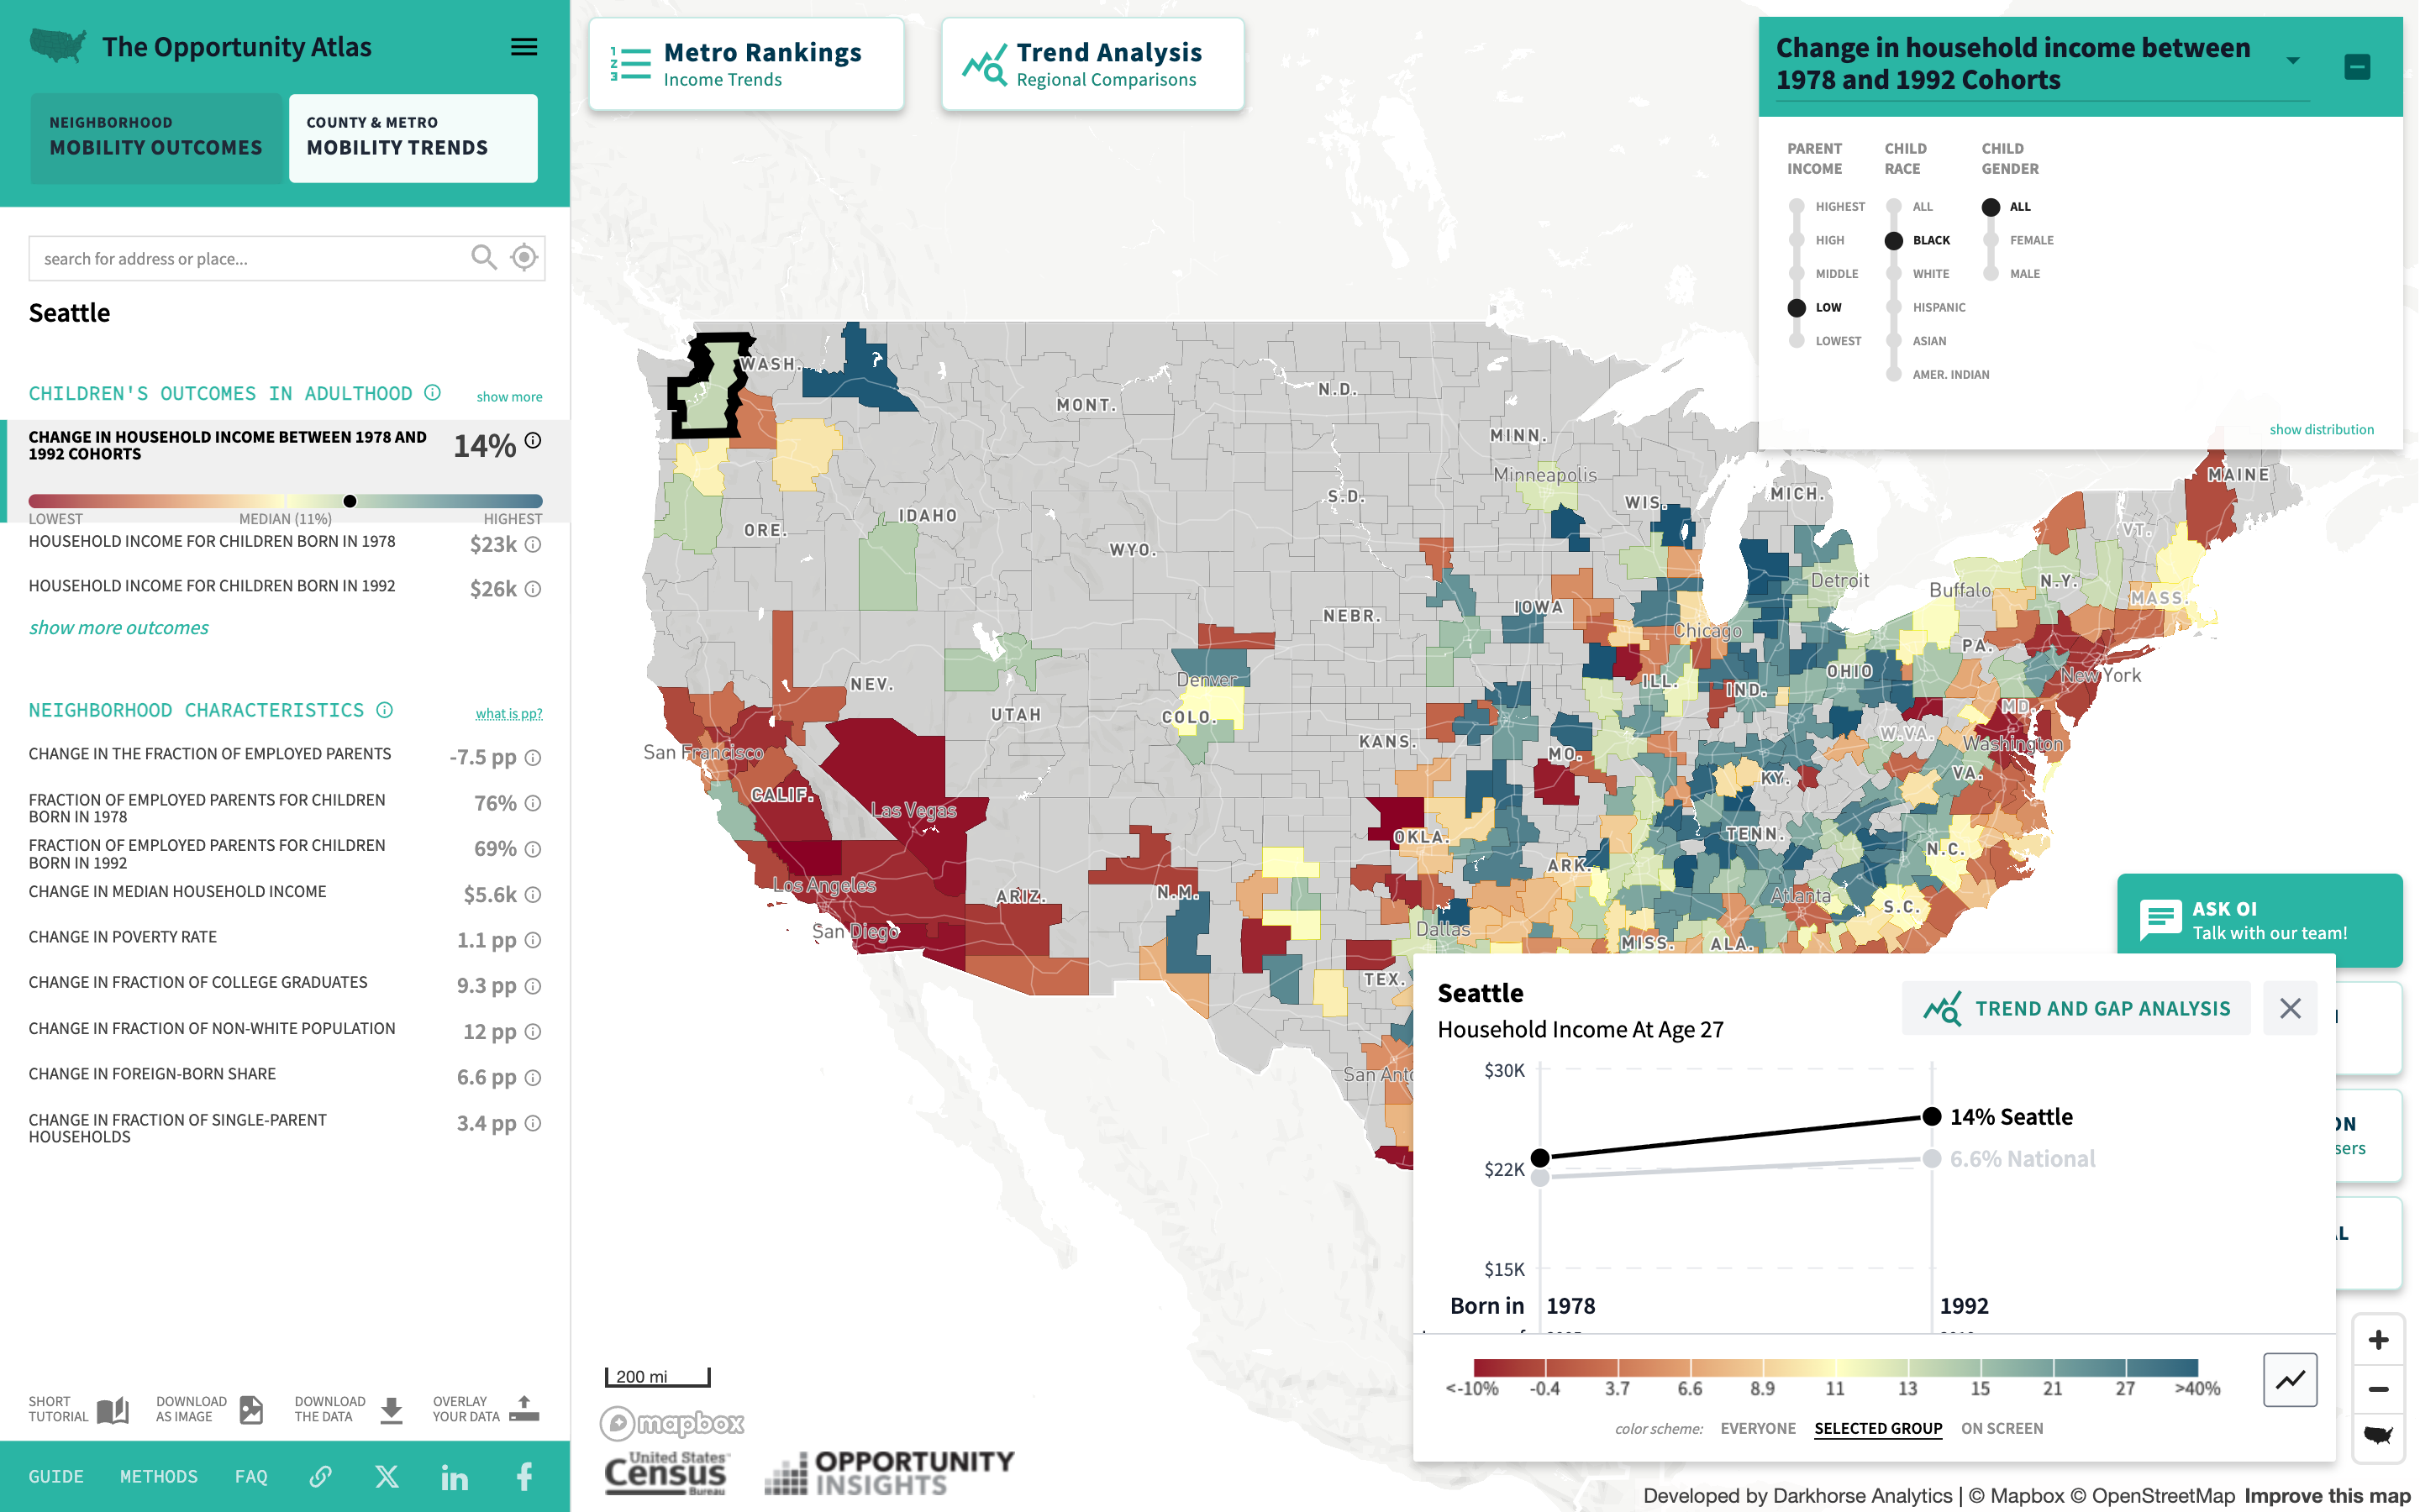
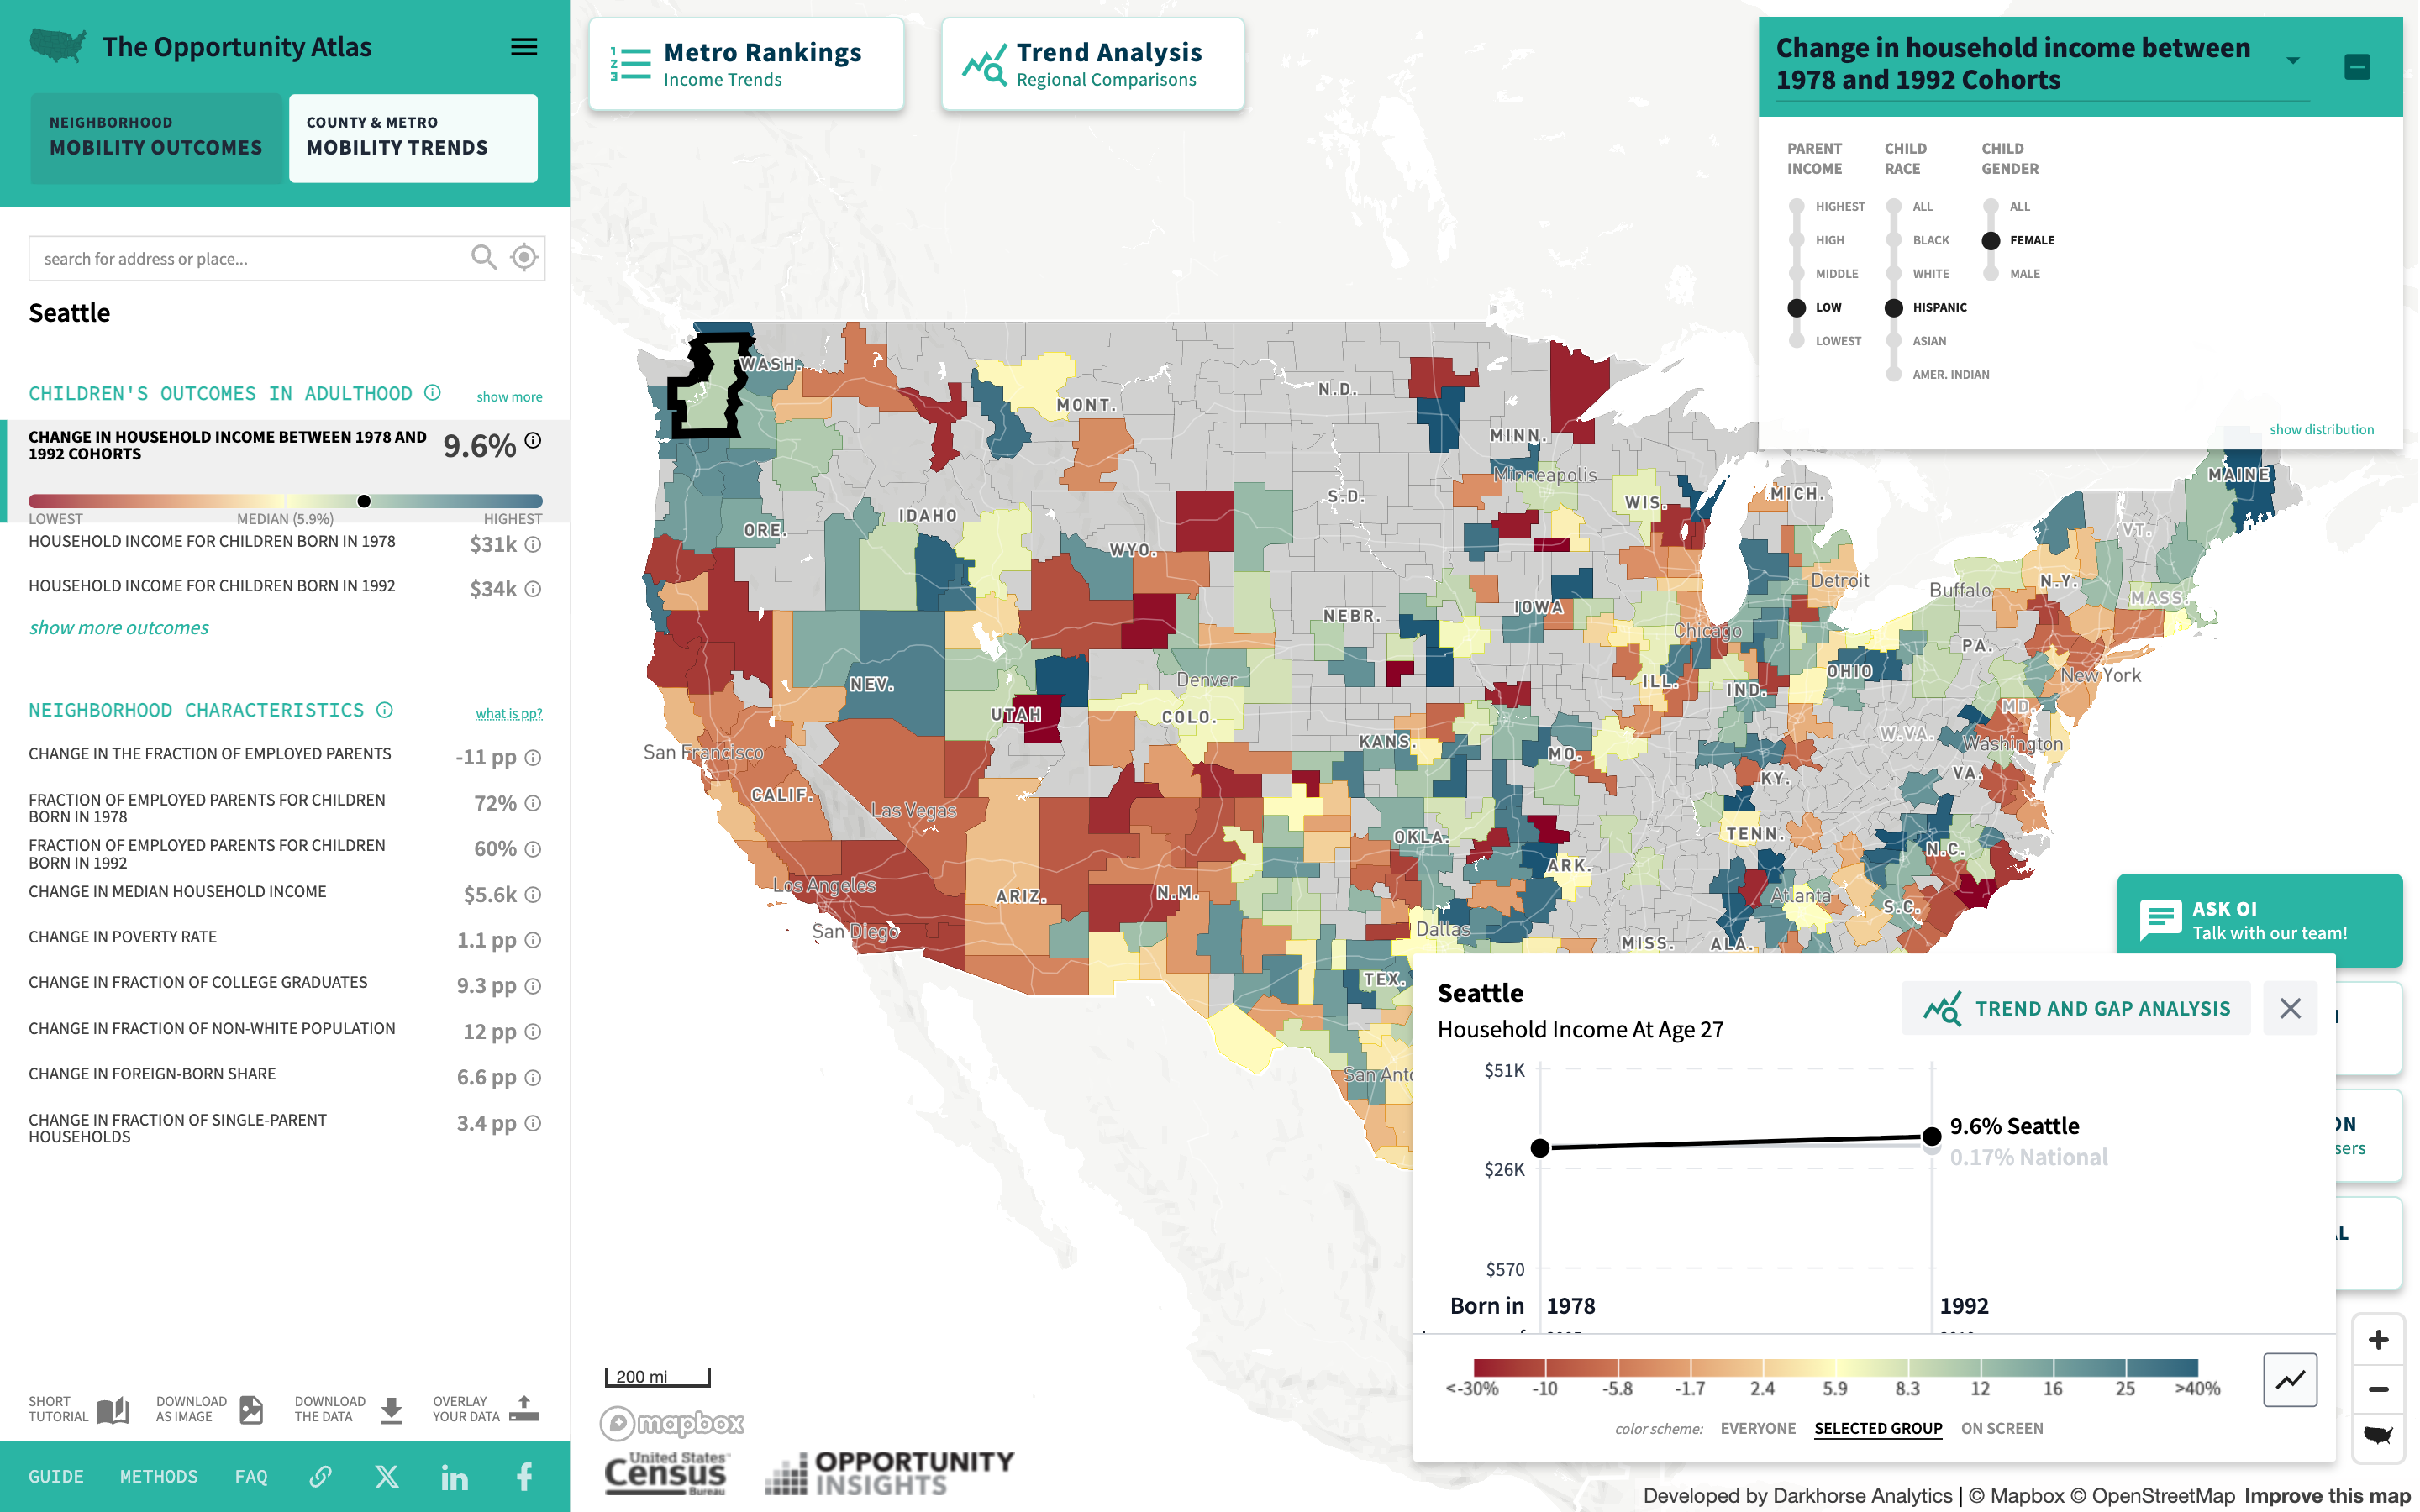
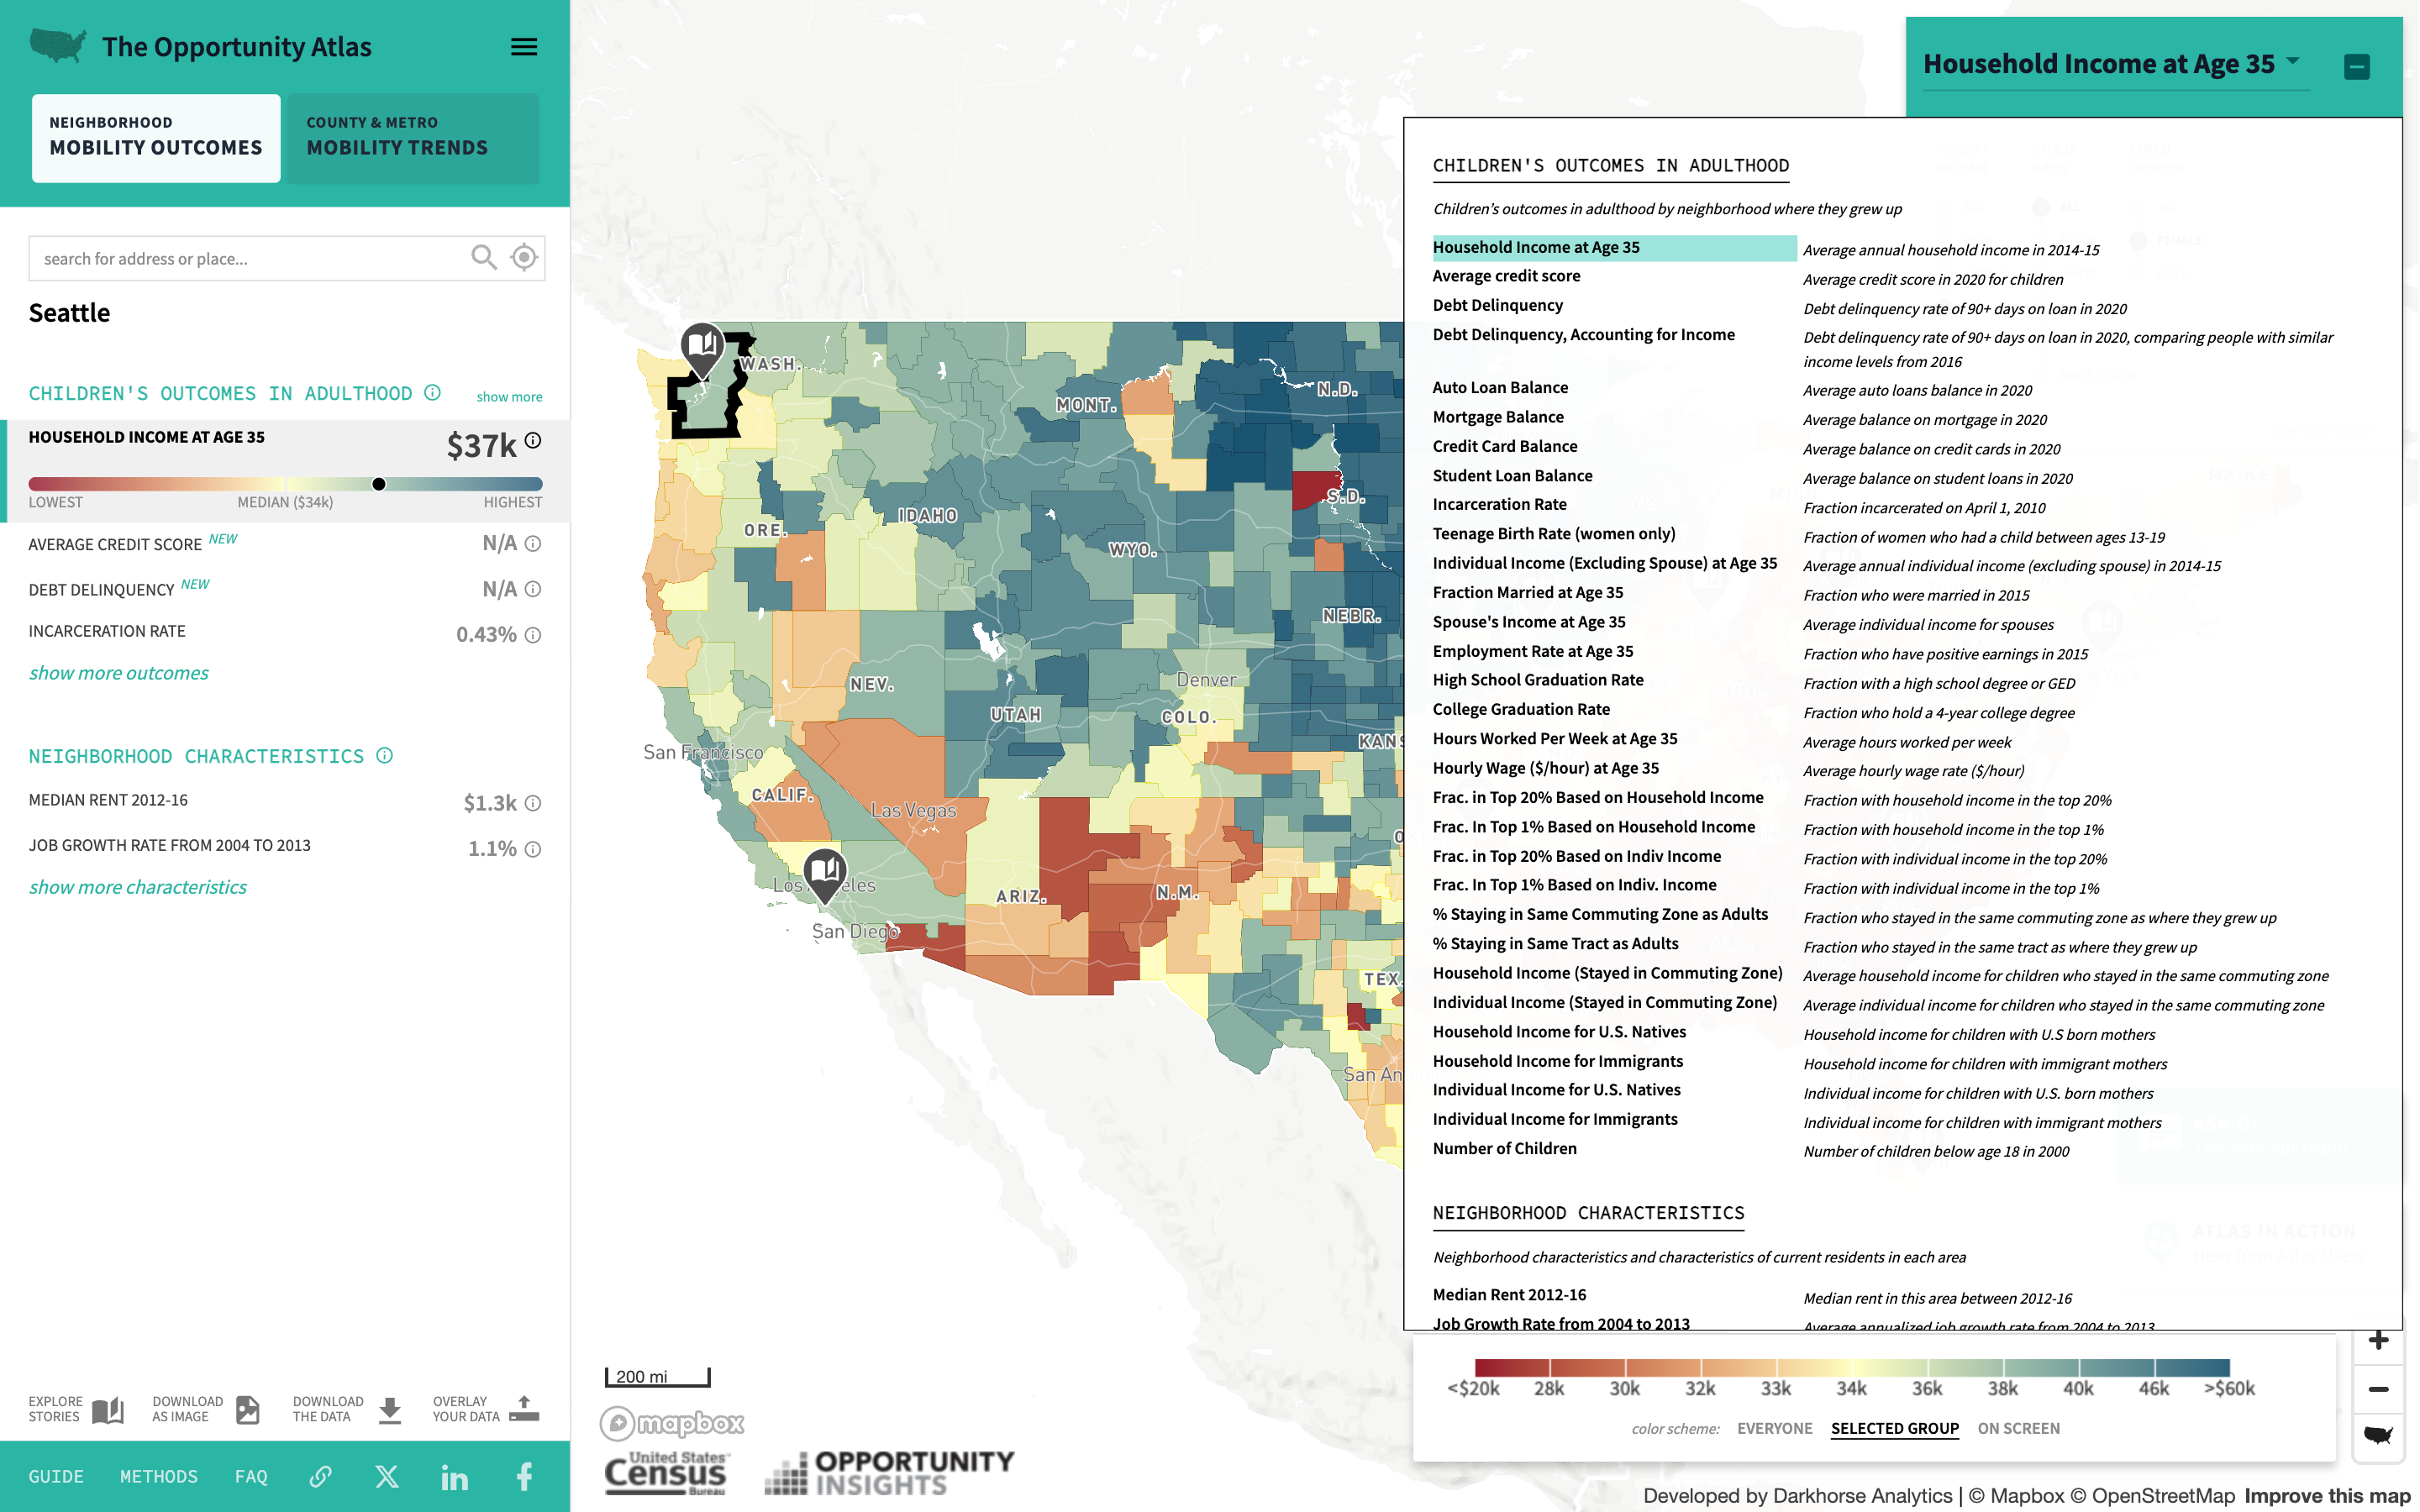
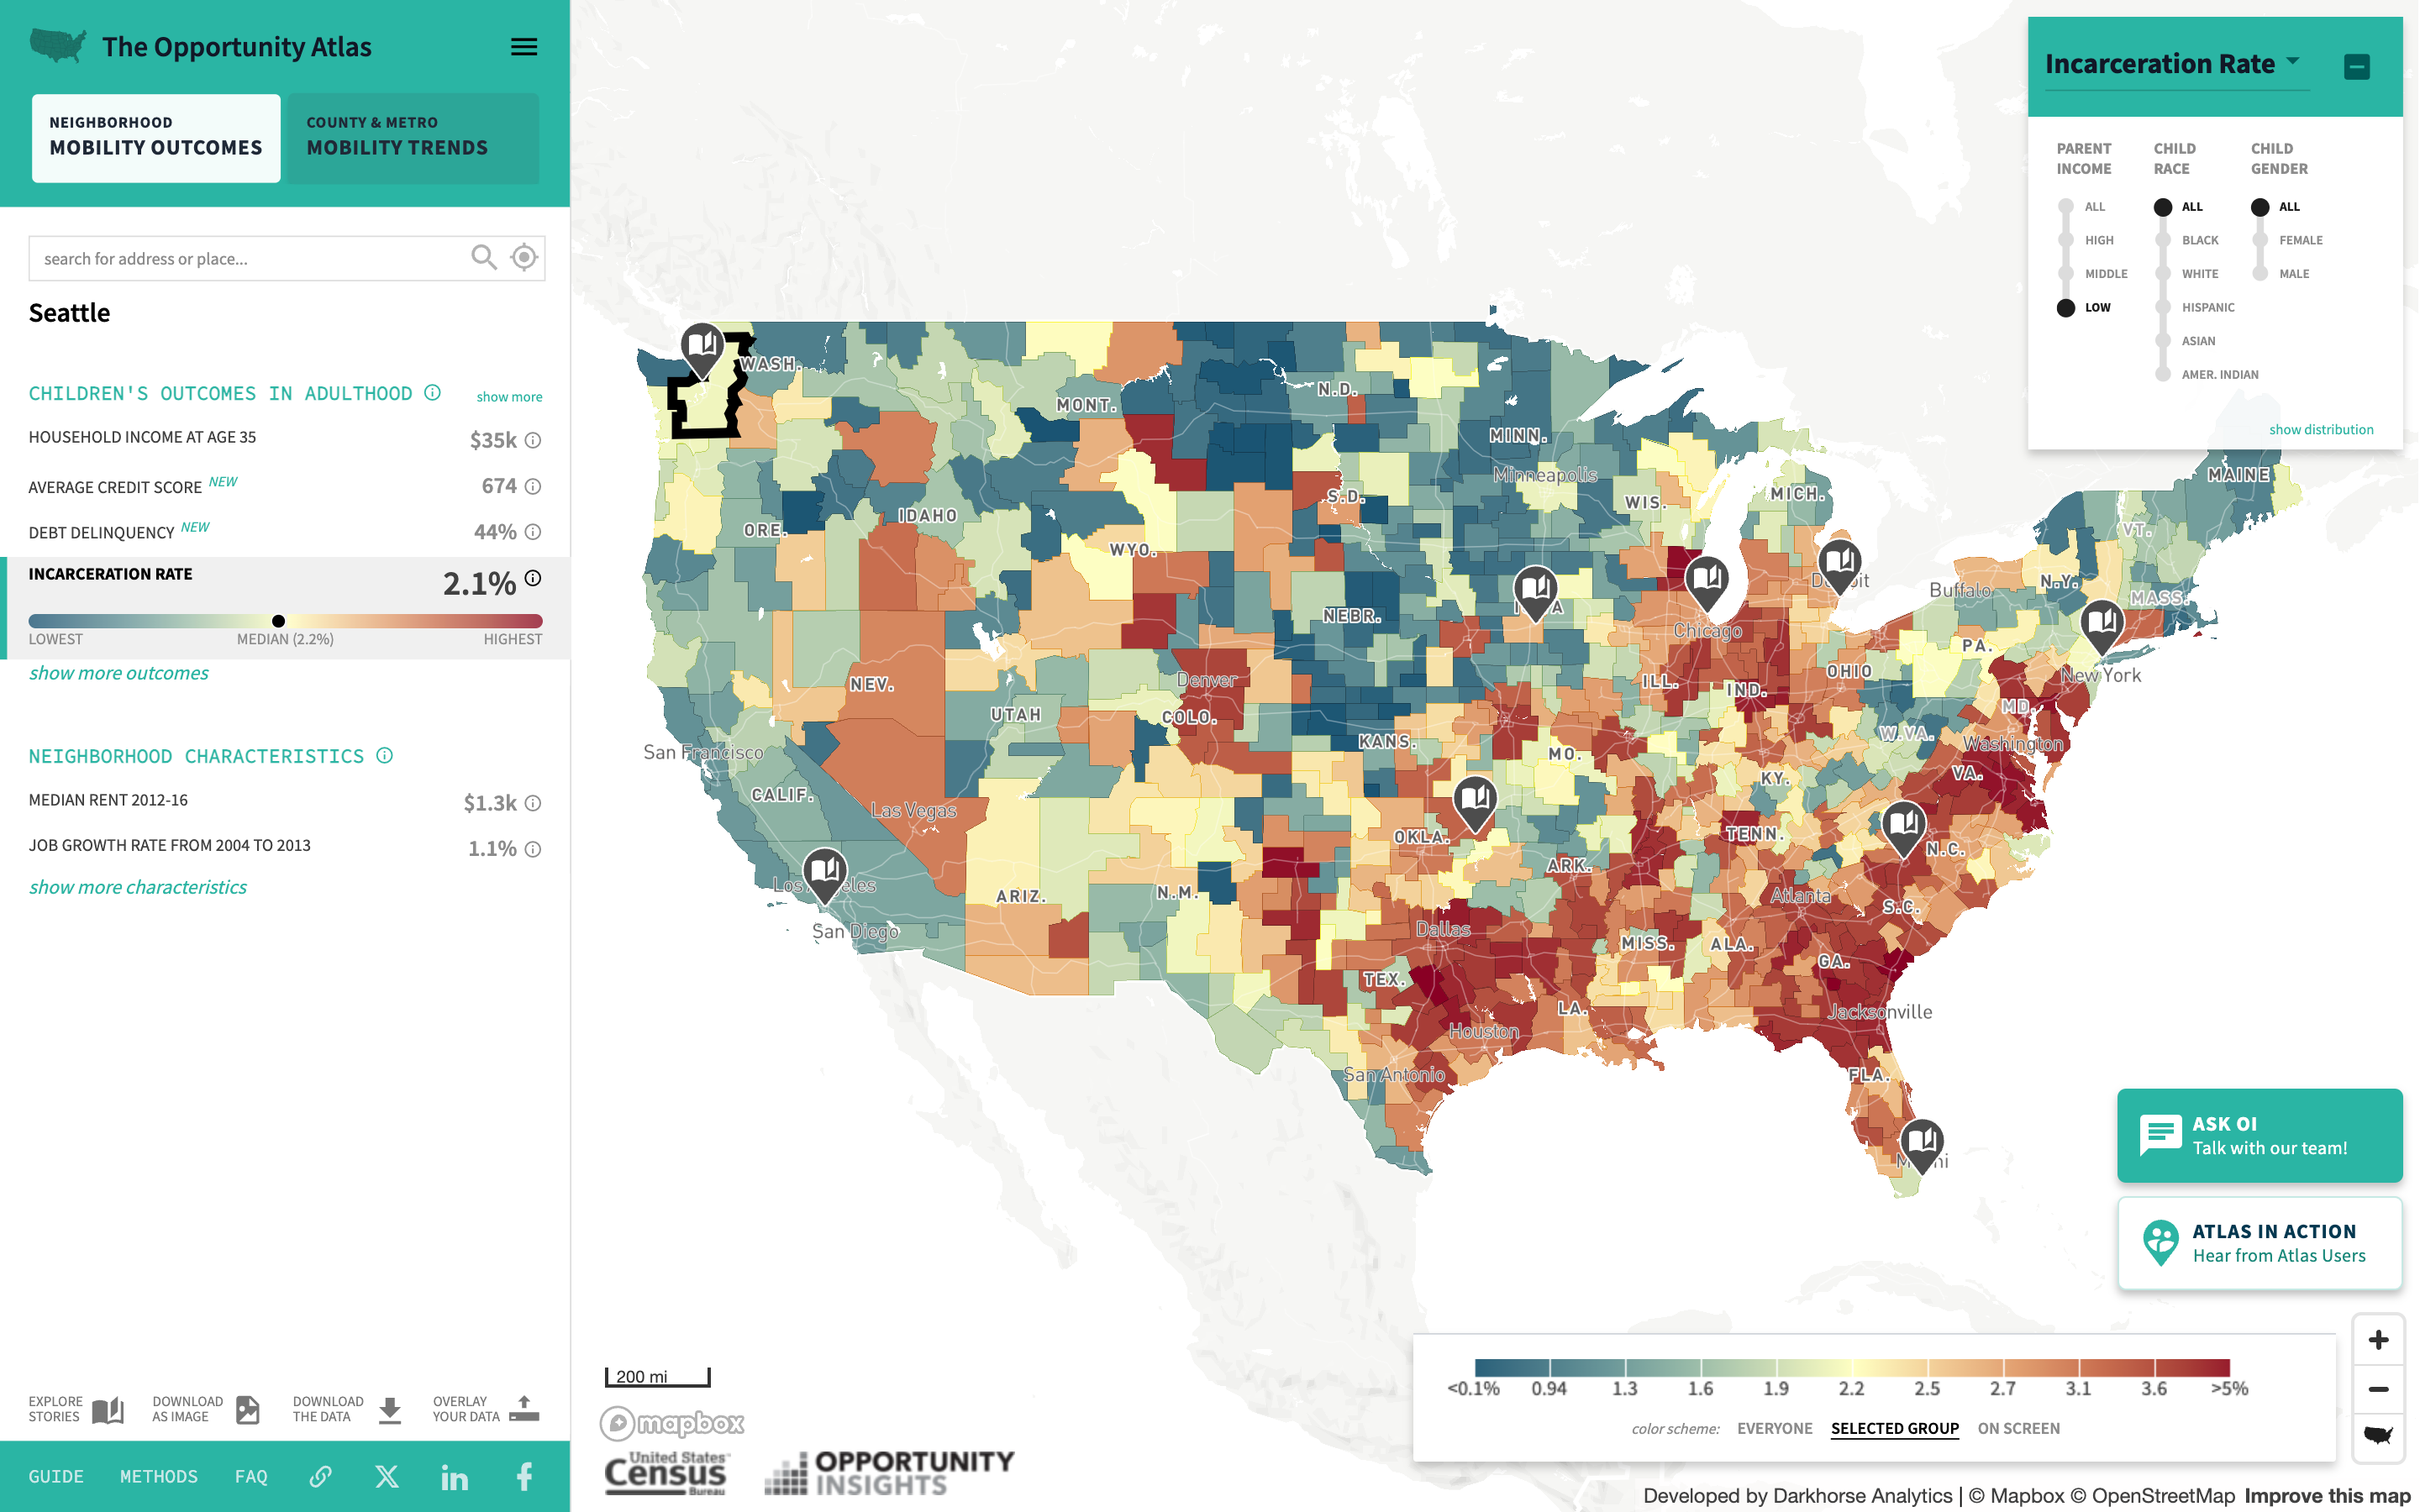
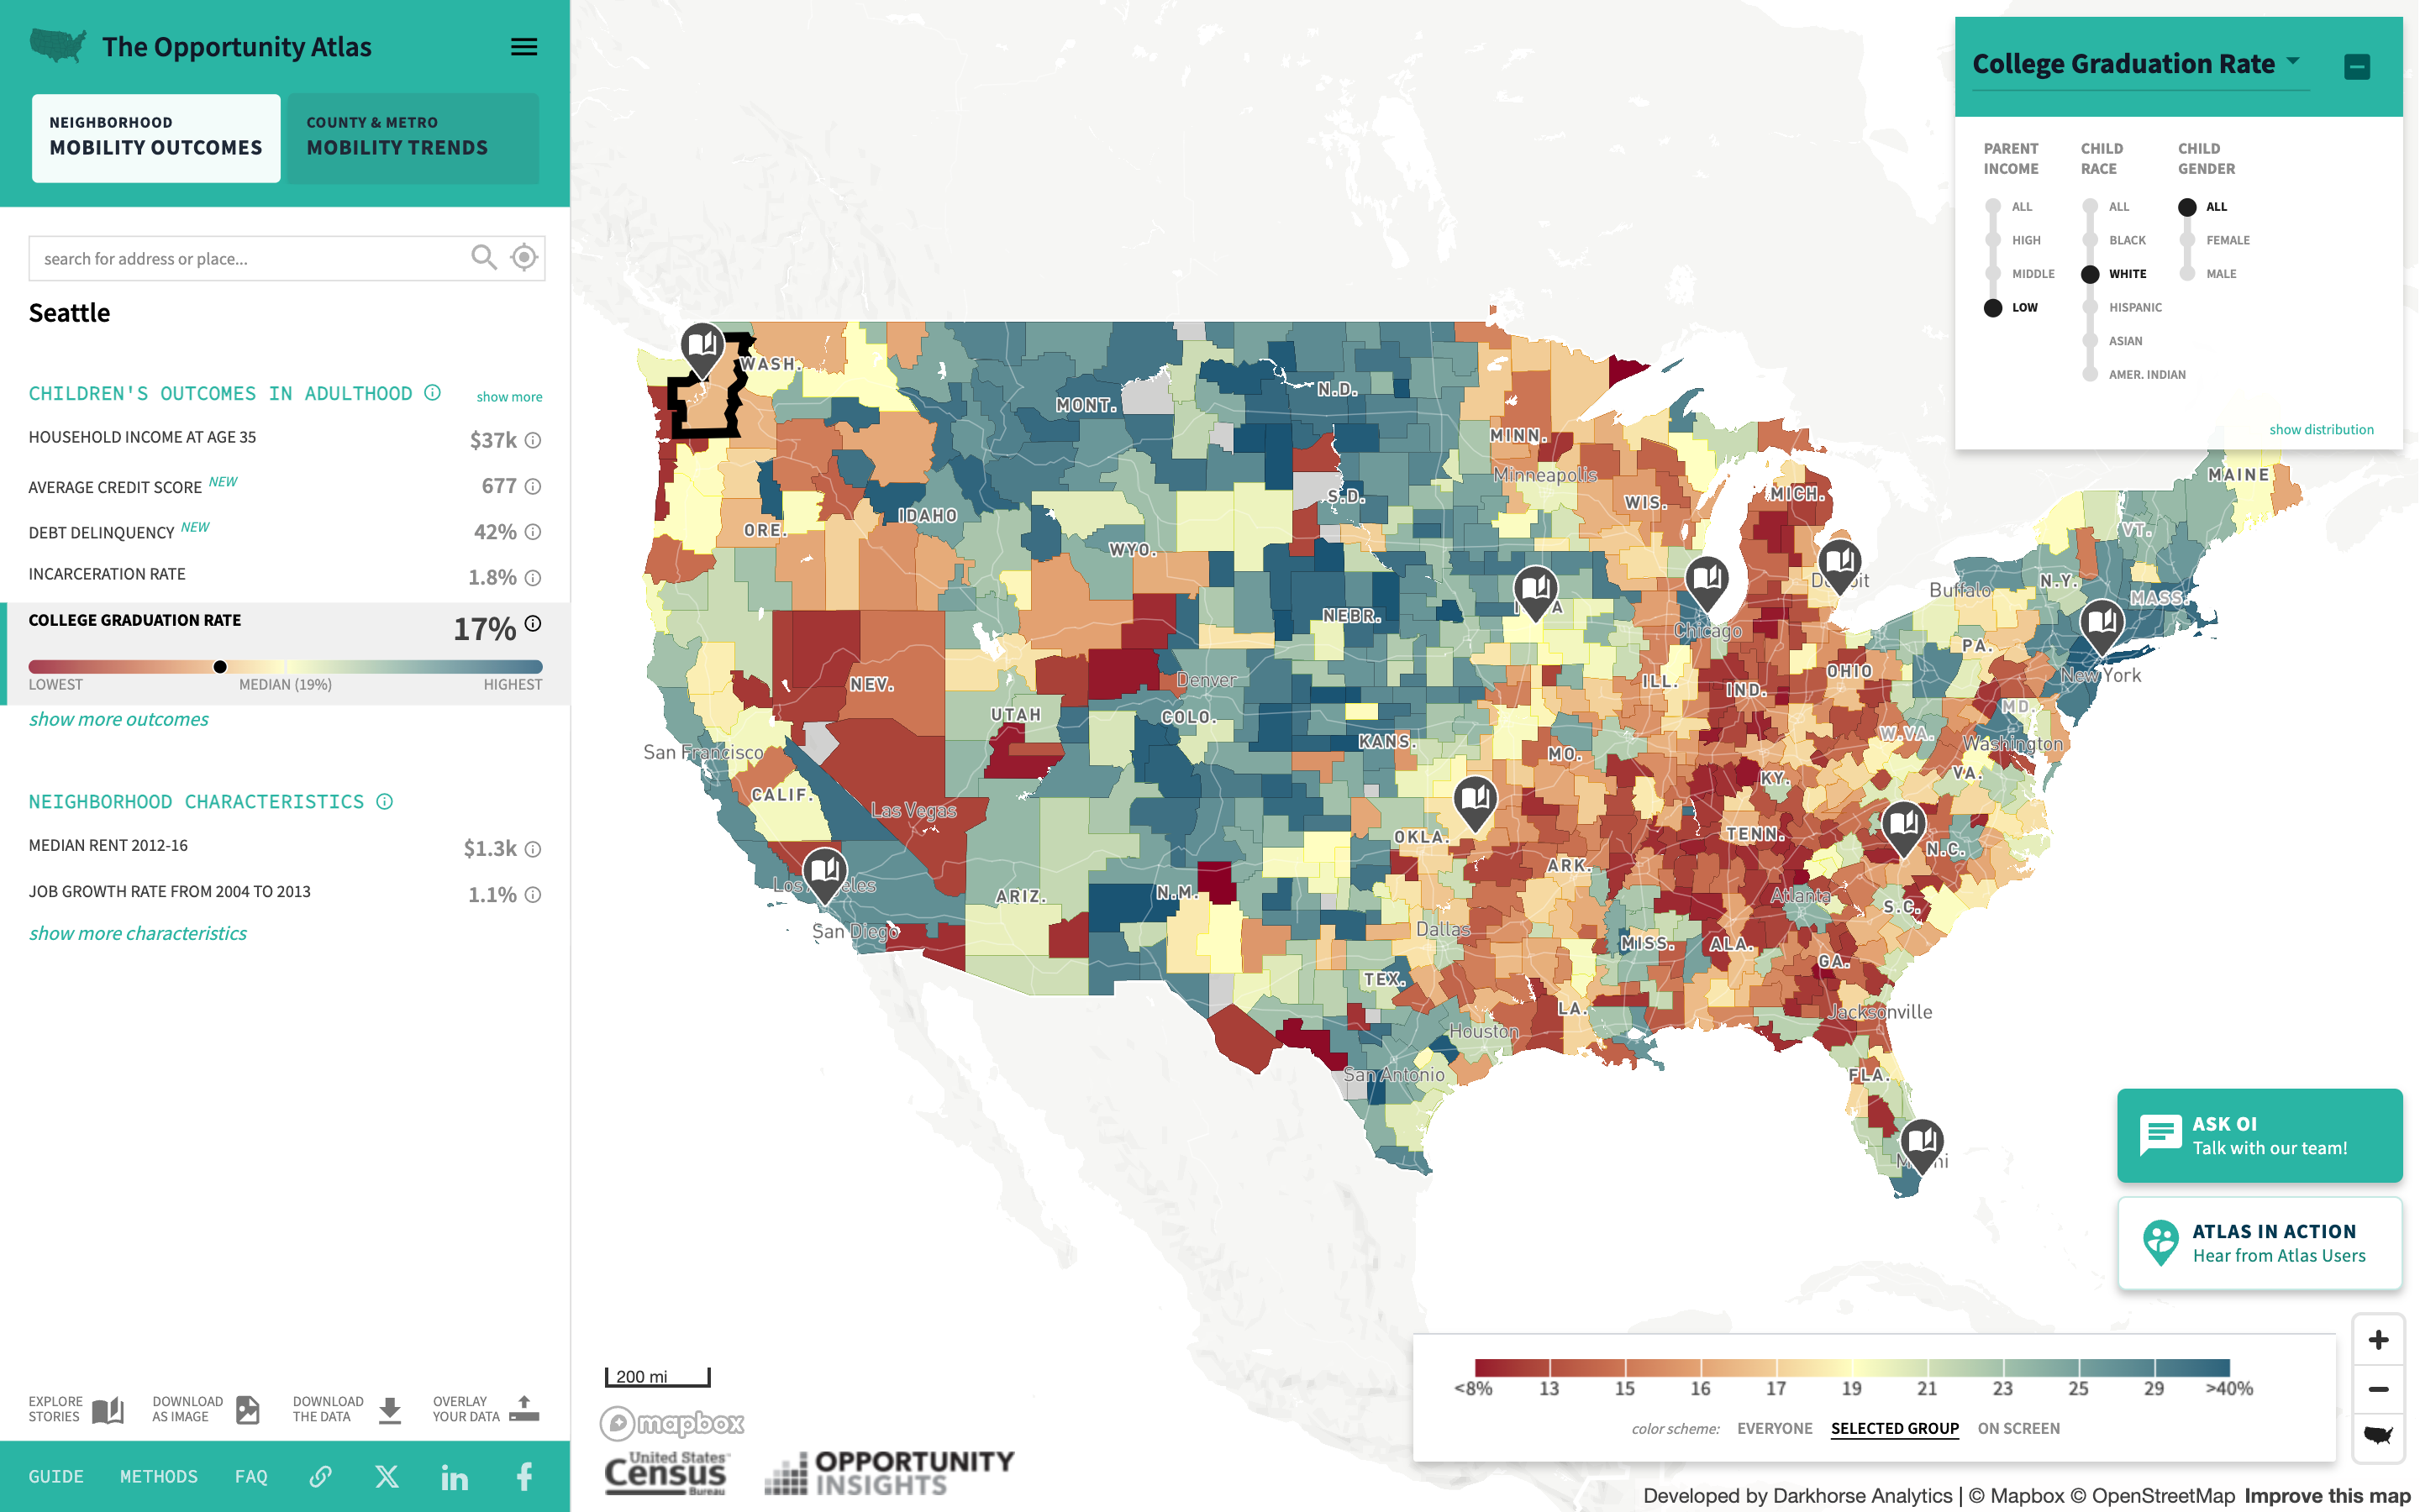
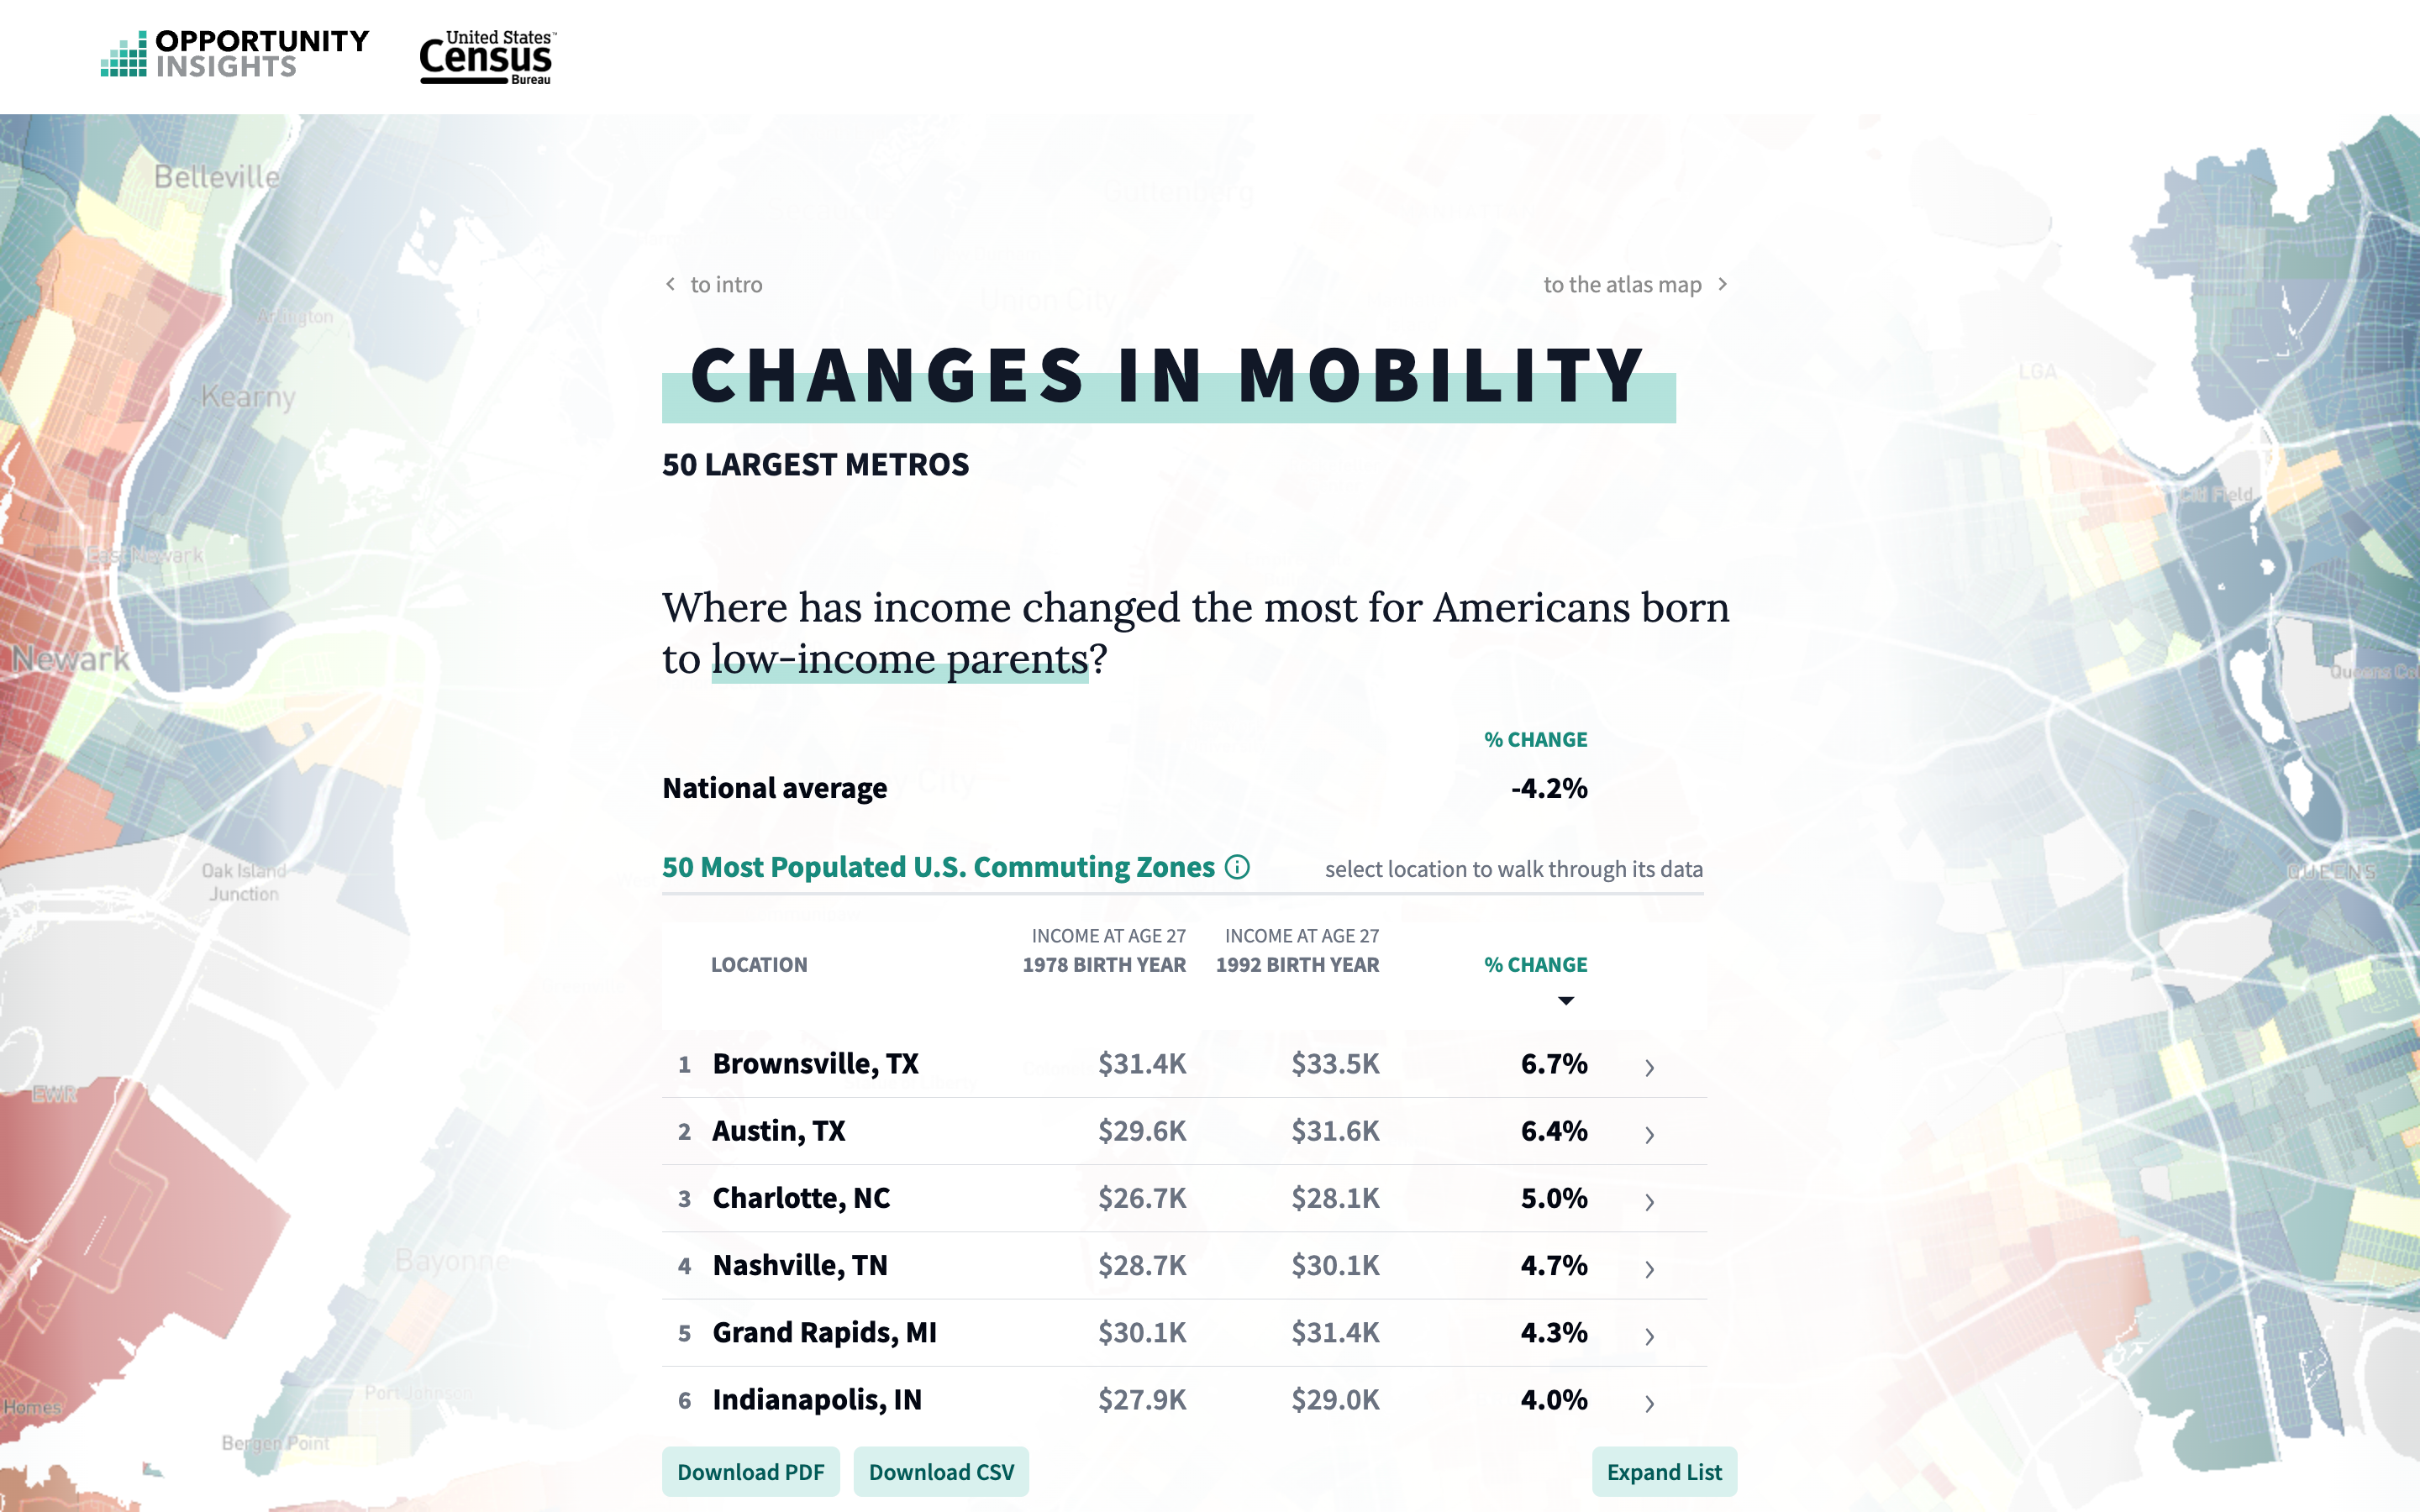
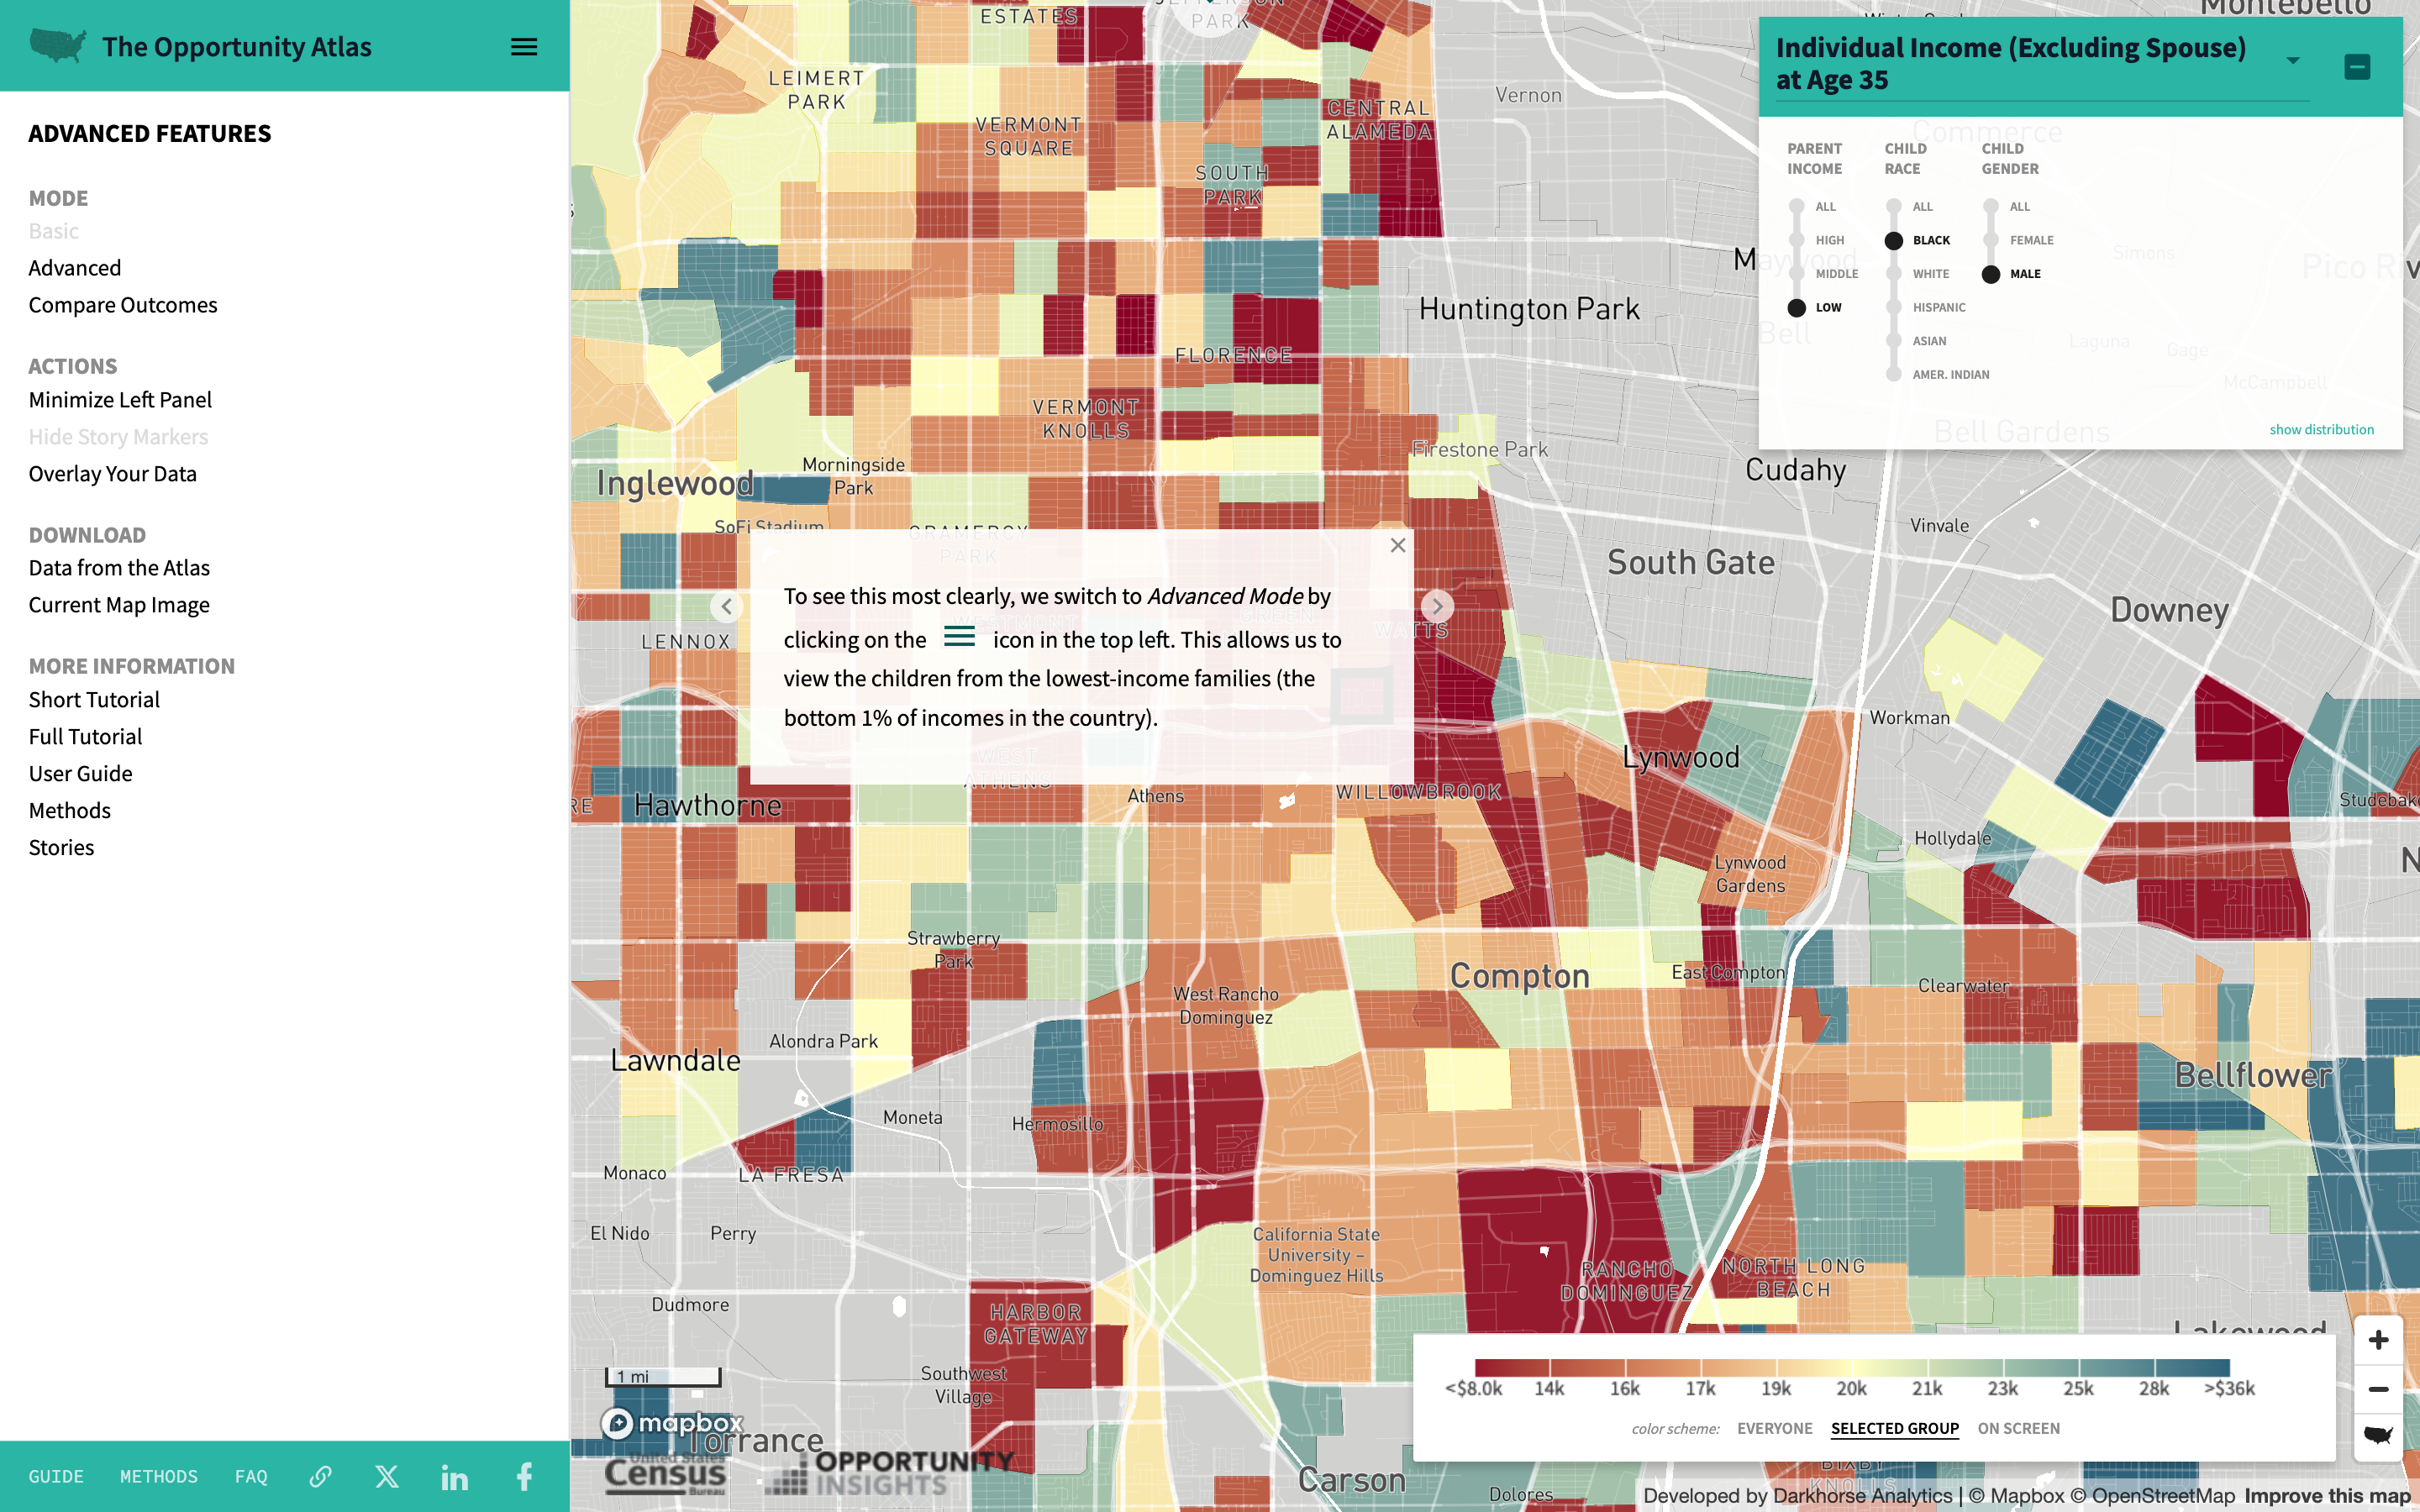
The platform visualizes outcomes for 20 million Americans who grew up in the 1980s, tracking metrics such as household income, incarceration rates, college attendance, and marriage rates. Users can explore data broken down by race, gender, and parental income level, allowing for nuanced analysis of how childhood neighborhoods shape life outcomes.
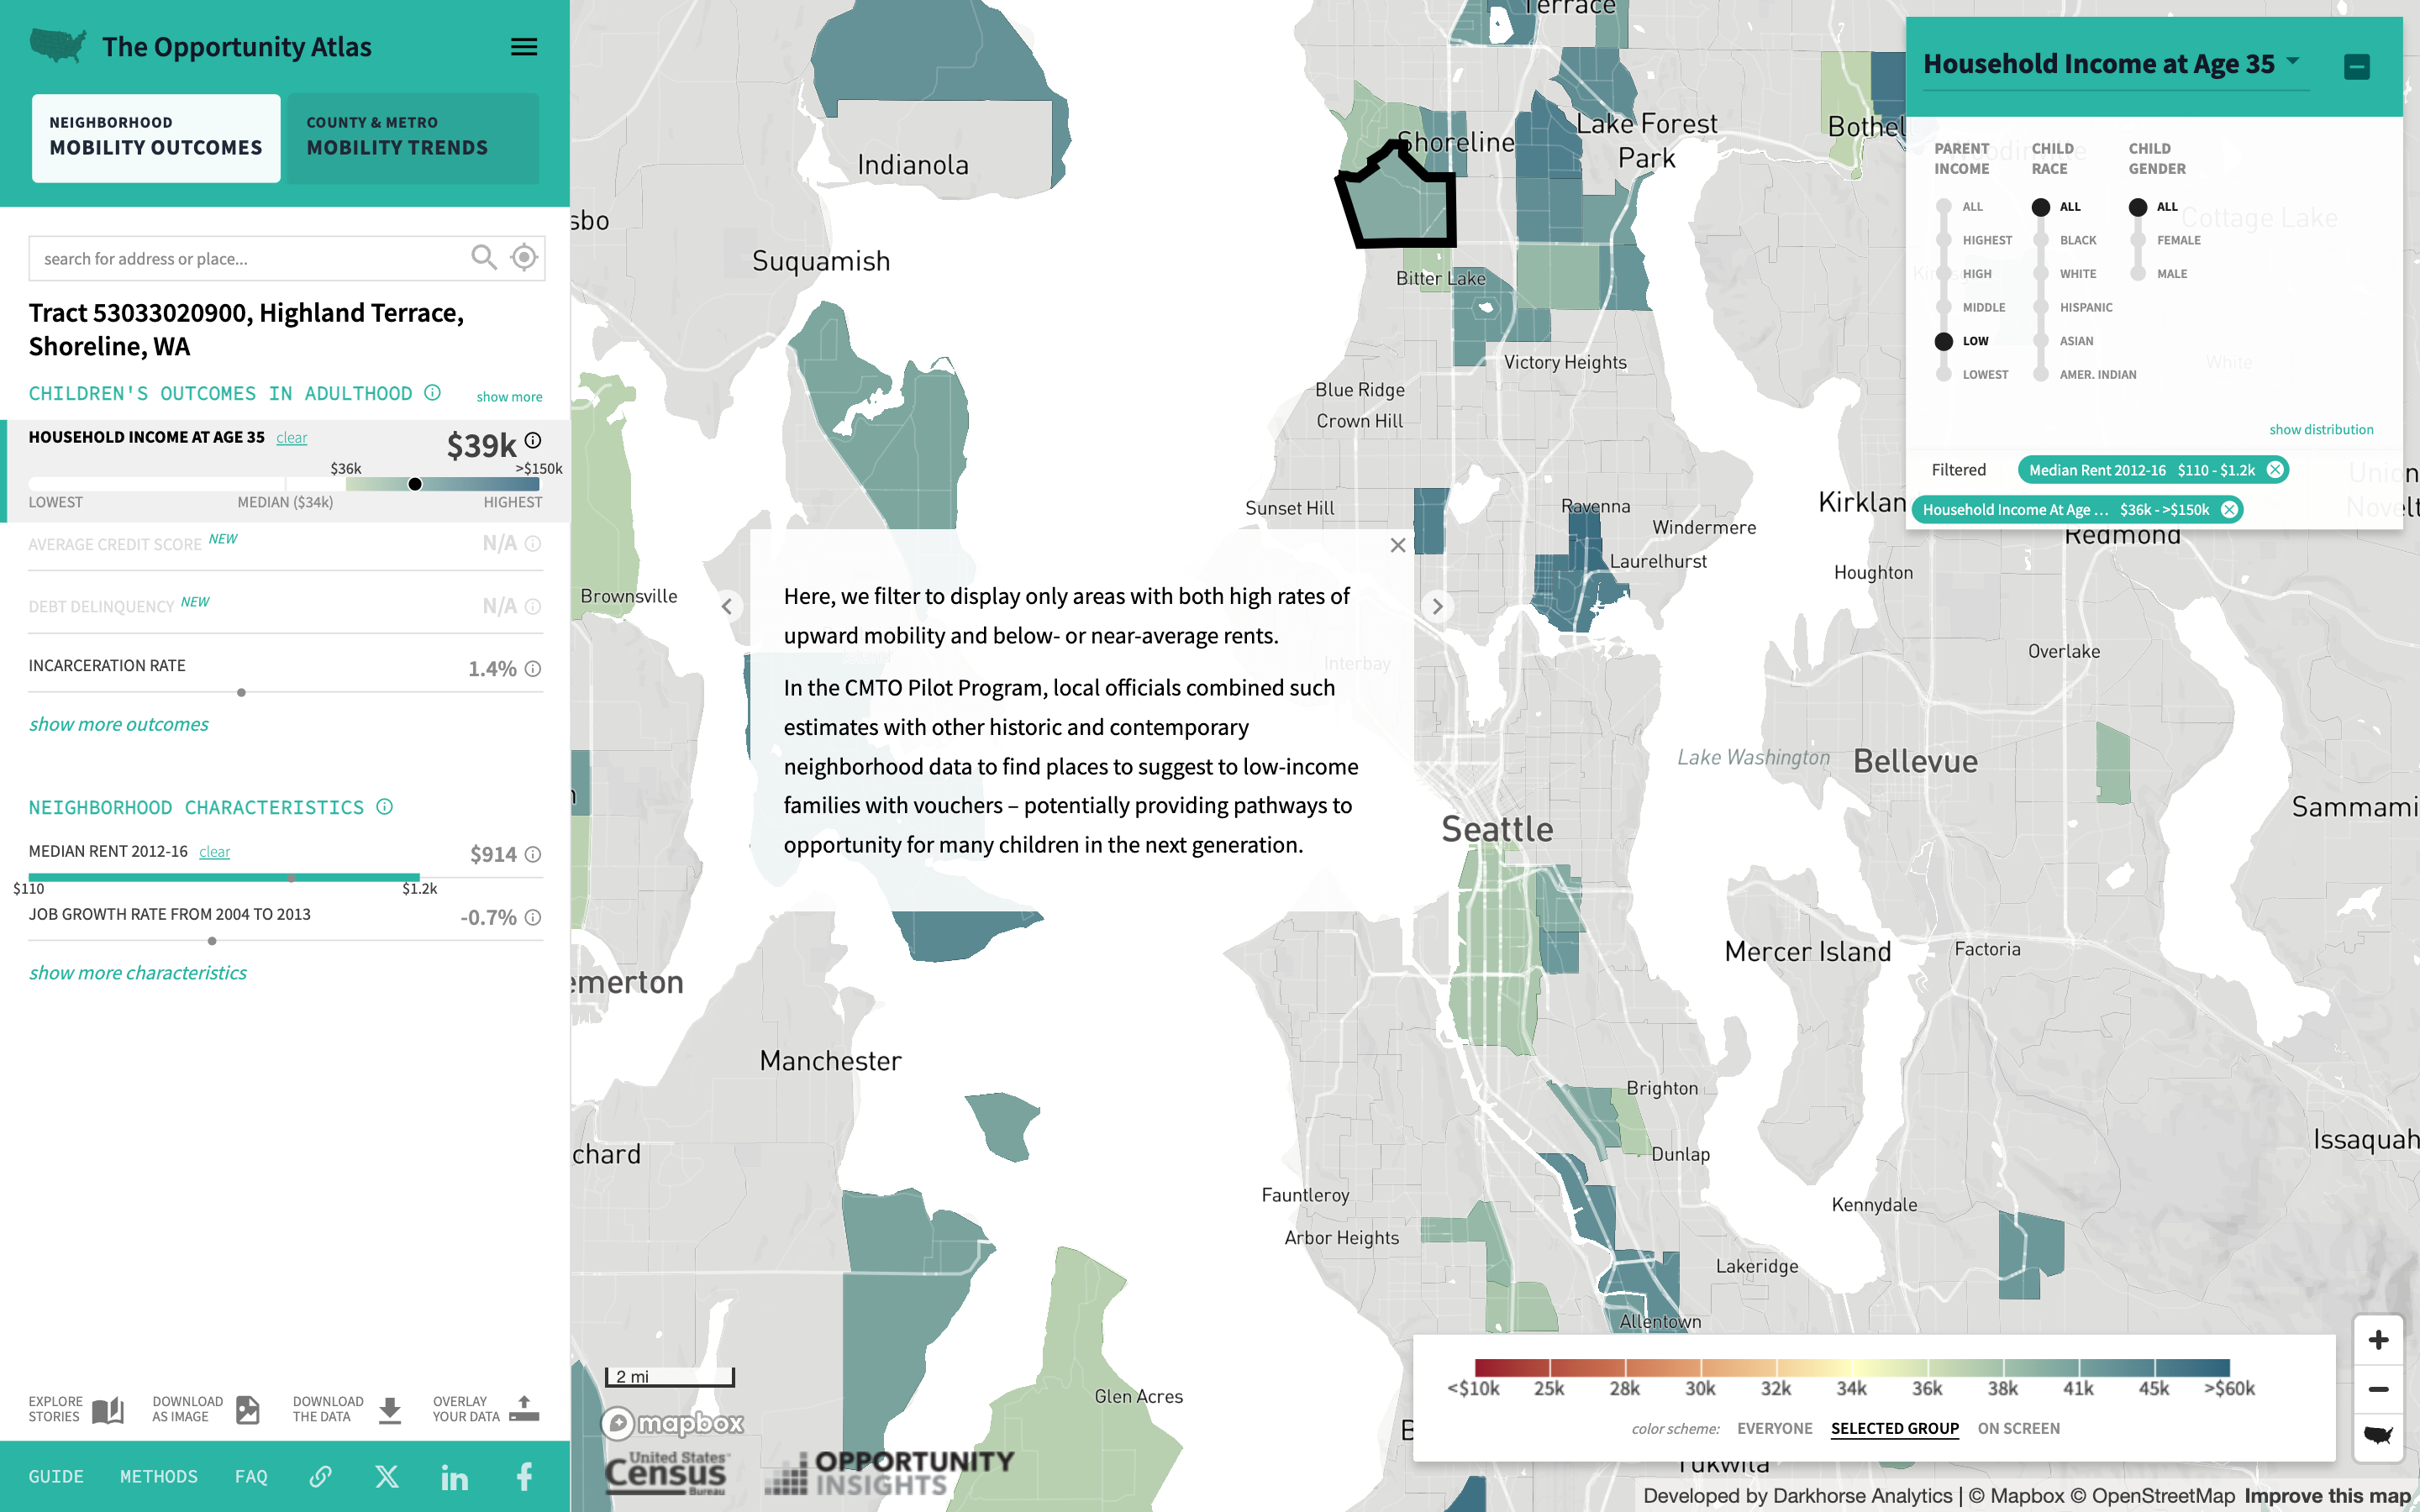
Key features include zoomable choropleth maps that display data from national to neighborhood scale, interactive data cards with detailed statistics for selected areas, and comparative tools for analyzing outcomes across different demographics and geographies. The visualization uses color gradients to show relative outcomes, with warmer colors indicating better opportunities and cooler colors showing areas with limited upward mobility.
Built on extensive research using anonymized tax records and census data, the Atlas enables policymakers to identify areas needing intervention, helps families make informed housing decisions, and provides researchers with granular data for studying economic mobility patterns.